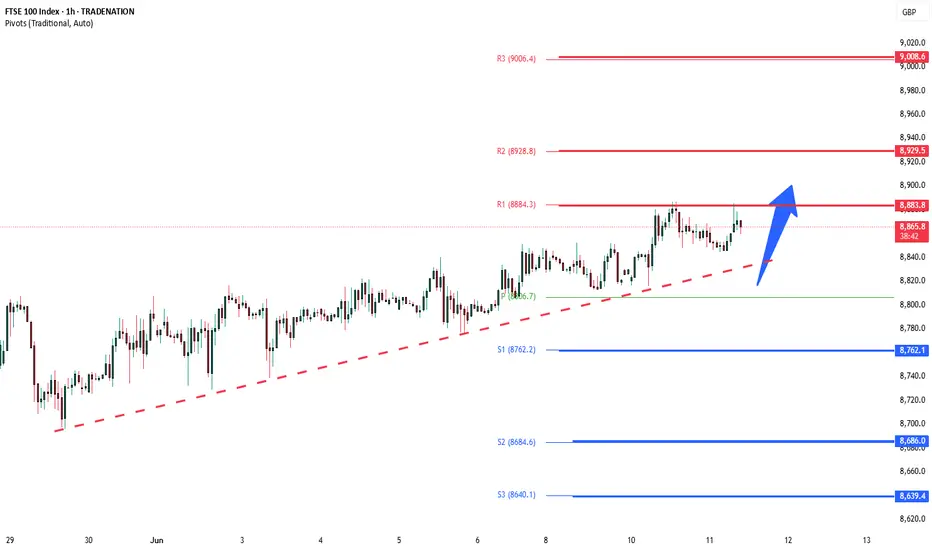
FTSE100 oversold rally testing resistance at 8820The FTSE remains in a bullish trend, with recent price action showing signs of a corrective pullback within the broader uptrend.
Support Zone: 8695 – a key level from previous consolidation. Price is currently testing or approaching this level.
A bullish rebound from 8695 would confirm ongoing upside momentum, with potential targets at:
8820 – initial resistance
8855 – psychological and structural level
8900 – extended resistance on the longer-term chart
Bearish Scenario:
A confirmed break and daily close below 8695 would weaken the bullish outlook and suggest deeper downside risk toward:
8640 – minor support
8600 – stronger support and potential demand zone
Outlook:
Bullish bias remains intact while the FTSE holds above 8695. A sustained break below this level could shift momentum to the downside in the short term.
This communication is for informational purposes only and should not be viewed as any form of recommendation as to a particular course of action or as investment advice. It is not intended as an offer or solicitation for the purchase or sale of any financial instrument or as an official confirmation of any transaction. Opinions, estimates and assumptions expressed herein are made as of the date of this communication and are subject to change without notice. This communication has been prepared based upon information, including market prices, data and other information, believed to be reliable; however, Trade Nation does not warrant its completeness or accuracy. All market prices and market data contained in or attached to this communication are indicative and subject to change without notice.
Ftse100

FTSE Oversold rally resistance at 8820The FTSE remains in a bullish trend, with recent price action showing signs of a corrective pullback within the broader uptrend.
Support Zone: 8695 – a key level from previous consolidation. Price is currently testing or approaching this level.
A bullish rebound from 8695 would confirm ongoing upside momentum, with potential targets at:
8820 – initial resistance
8855 – psychological and structural level
8900 – extended resistance on the longer-term chart
Bearish Scenario:
A confirmed break and daily close below 8695 would weaken the bullish outlook and suggest deeper downside risk toward:
8640 – minor support
8600 – stronger support and potential demand zone
Outlook:
Bullish bias remains intact while the FTSE holds above 8695. A sustained break below this level could shift momentum to the downside in the short term.
This communication is for informational purposes only and should not be viewed as any form of recommendation as to a particular course of action or as investment advice. It is not intended as an offer or solicitation for the purchase or sale of any financial instrument or as an official confirmation of any transaction. Opinions, estimates and assumptions expressed herein are made as of the date of this communication and are subject to change without notice. This communication has been prepared based upon information, including market prices, data and other information, believed to be reliable; however, Trade Nation does not warrant its completeness or accuracy. All market prices and market data contained in or attached to this communication are indicative and subject to change without notice.

FTSE uptrend pause capped at 8854The FTSE remains in a bullish trend, with recent price action showing signs of a corrective pullback within the broader uptrend.
Support Zone: 8695 – a key level from previous consolidation. Price is currently testing or approaching this level.
A bullish rebound from 8695 would confirm ongoing upside momentum, with potential targets at:
8854 – initial resistance
8900 – psychological and structural level
8960 – extended resistance on the longer-term chart
Bearish Scenario:
A confirmed break and daily close below 8695 would weaken the bullish outlook and suggest deeper downside risk toward:
8640 – minor support
8600 – stronger support and potential demand zone
Outlook:
Bullish bias remains intact while the FTSE holds above 8695. A sustained break below this level could shift momentum to the downside in the short term.
This communication is for informational purposes only and should not be viewed as any form of recommendation as to a particular course of action or as investment advice. It is not intended as an offer or solicitation for the purchase or sale of any financial instrument or as an official confirmation of any transaction. Opinions, estimates and assumptions expressed herein are made as of the date of this communication and are subject to change without notice. This communication has been prepared based upon information, including market prices, data and other information, believed to be reliable; however, Trade Nation does not warrant its completeness or accuracy. All market prices and market data contained in or attached to this communication are indicative and subject to change without notice.

FTSE pivotal level at 8854The FTSE remains in a bullish trend, with recent price action showing signs of a corrective pullback within the broader uptrend.
Support Zone: 8695 – a key level from previous consolidation. Price is currently testing or approaching this level.
A bullish rebound from 8695 would confirm ongoing upside momentum, with potential targets at:
8854 – initial resistance
8900 – psychological and structural level
8960 – extended resistance on the longer-term chart
Bearish Scenario:
A confirmed break and daily close below 8695 would weaken the bullish outlook and suggest deeper downside risk toward:
8640 – minor support
8600 – stronger support and potential demand zone
Outlook:
Bullish bias remains intact while the FTSE holds above 8695. A sustained break below this level could shift momentum to the downside in the short term.
This communication is for informational purposes only and should not be viewed as any form of recommendation as to a particular course of action or as investment advice. It is not intended as an offer or solicitation for the purchase or sale of any financial instrument or as an official confirmation of any transaction. Opinions, estimates and assumptions expressed herein are made as of the date of this communication and are subject to change without notice. This communication has been prepared based upon information, including market prices, data and other information, believed to be reliable; however, Trade Nation does not warrant its completeness or accuracy. All market prices and market data contained in or attached to this communication are indicative and subject to change without notice.

FTSE INTRADAY bullish sideways consolidation Trend Overview:
The FTSE100 equity index remains in a bullish trend, characterised by higher highs and higher lows. The recent intraday price action is forming a continuation consolidation pattern, suggesting a potential pause before a renewed move higher.
Key Technical Levels:
Support: 8800 (primary pivot), followed by 8760 and 8700
Resistance: 8940 (initial), then 8977 and 9010
Technical Outlook:
A pullback to the 8800 level, which aligns with the previous consolidation zone, could act as a platform for renewed buying interest. A confirmed bounce from this support may trigger a continuation toward the next resistance levels at 8940, 8977, and ultimately 9010.
Conversely, a daily close below 8800 would suggest weakening bullish momentum. This scenario would shift the bias to bearish in the short term, potentially targeting 8760 and 8700 as downside levels.
Conclusion:
FTSE100 maintains a bullish structure while trading above the 8800 support. A bounce from this level would validate the consolidation as a continuation pattern, with upside potential toward the 8940 area. A breakdown below 8800, however, would invalidate this view and suggest deeper corrective risk.
This communication is for informational purposes only and should not be viewed as any form of recommendation as to a particular course of action or as investment advice. It is not intended as an offer or solicitation for the purchase or sale of any financial instrument or as an official confirmation of any transaction. Opinions, estimates and assumptions expressed herein are made as of the date of this communication and are subject to change without notice. This communication has been prepared based upon information, including market prices, data and other information, believed to be reliable; however, Trade Nation does not warrant its completeness or accuracy. All market prices and market data contained in or attached to this communication are indicative and subject to change without notice.

UK100 ShortManipulation in the Asian session, looking for price to retest higher supply then push down to the London and Asia low, this is a forecasted entry, entries will be based after 8am M5 candle opening.

FTSE sideways consolidation supported at 8800Trend Overview:
The FTSE100 equity index remains in a bullish trend, characterised by higher highs and higher lows. The recent intraday price action is forming a continuation consolidation pattern, suggesting a potential pause before a renewed move higher.
Key Technical Levels:
Support: 8800 (primary pivot), followed by 8760 and 8700
Resistance: 8940 (initial), then 8977 and 9010
Technical Outlook:
A pullback to the 8800 level, which aligns with the previous consolidation zone, could act as a platform for renewed buying interest. A confirmed bounce from this support may trigger a continuation toward the next resistance levels at 8940, 8977, and ultimately 9010.
Conversely, a daily close below 8800 would suggest weakening bullish momentum. This scenario would shift the bias to bearish in the short term, potentially targeting 8760 and 8700 as downside levels.
Conclusion:
FTSE100 maintains a bullish structure while trading above the 8800 support. A bounce from this level would validate the consolidation as a continuation pattern, with upside potential toward the 8940 area. A breakdown below 8800, however, would invalidate this view and suggest deeper corrective risk.
This communication is for informational purposes only and should not be viewed as any form of recommendation as to a particular course of action or as investment advice. It is not intended as an offer or solicitation for the purchase or sale of any financial instrument or as an official confirmation of any transaction. Opinions, estimates and assumptions expressed herein are made as of the date of this communication and are subject to change without notice. This communication has been prepared based upon information, including market prices, data and other information, believed to be reliable; however, Trade Nation does not warrant its completeness or accuracy. All market prices and market data contained in or attached to this communication are indicative and subject to change without notice.

UK100/FTSE100 - SHORT THE HELL OUT OF UK - Team, last week we kill few times SHORTING ON UK100/FTSE100
Here is a million strategy from Active Trader Room
SHORT NOW at the current price 8992-96
DOUBLE SHORT at 8912-36
Target 1 at 8870-62
Target 2 at 8855-47
Please note: once it hit first target ,take 50% profit
the rule is always pocket first and reduce the risk.
LET'S MAKE ANOTHER MILLIONS THIS WEEK

FTSE100 bullish sideways consolidation above 8800Trend Overview:
The FTSE100 equity index remains in a bullish trend, characterised by higher highs and higher lows. The recent intraday price action is forming a continuation consolidation pattern, suggesting a potential pause before a renewed move higher.
Key Technical Levels:
Support: 8800 (primary pivot), followed by 8760 and 8700
Resistance: 8940 (initial), then 8977 and 9010
Technical Outlook:
A pullback to the 8800 level, which aligns with the previous consolidation zone, could act as a platform for renewed buying interest. A confirmed bounce from this support may trigger a continuation toward the next resistance levels at 8940, 8977, and ultimately 9010.
Conversely, a daily close below 8800 would suggest weakening bullish momentum. This scenario would shift the bias to bearish in the short term, potentially targeting 8760 and 8700 as downside levels.
Conclusion:
FTSE100 maintains a bullish structure while trading above the 8800 support. A bounce from this level would validate the consolidation as a continuation pattern, with upside potential toward the 8940 area. A breakdown below 8800, however, would invalidate this view and suggest deeper corrective risk.
This communication is for informational purposes only and should not be viewed as any form of recommendation as to a particular course of action or as investment advice. It is not intended as an offer or solicitation for the purchase or sale of any financial instrument or as an official confirmation of any transaction. Opinions, estimates and assumptions expressed herein are made as of the date of this communication and are subject to change without notice. This communication has been prepared based upon information, including market prices, data and other information, believed to be reliable; however, Trade Nation does not warrant its completeness or accuracy. All market prices and market data contained in or attached to this communication are indicative and subject to change without notice.

FTSE INTRADAY sideways consolidation Overall trend remains bullish, supported by rising price action.
Recent Movement: Price is in a sideways consolidation phase after a strong uptrend.
Key Levels
Support:
8760 – Key level from prior consolidation.
8680, then 8640 – Next supports if 8680 breaks.
Resistance:
8830 – First upside target.
8930, then 9000 – Further resistance levels on continued strength.
Trading Scenarios
Bullish Scenario:
A pullback to 8760 followed by a bounce could lead to a move towards 8830, then higher to 8930 and 9000.
Bearish Scenario:
A confirmed break and daily close below 8760 would weaken the bullish case. In that case, expect a potential drop to 8680, then 8640.
Conclusion
The FTSE remains bullish, but a short-term pullback is possible. A bounce from 8760 would confirm trend strength. Watch 8680 closely — holding above favors bulls; a break below shifts sentiment to bearish.
This communication is for informational purposes only and should not be viewed as any form of recommendation as to a particular course of action or as investment advice. It is not intended as an offer or solicitation for the purchase or sale of any financial instrument or as an official confirmation of any transaction. Opinions, estimates and assumptions expressed herein are made as of the date of this communication and are subject to change without notice. This communication has been prepared based upon information, including market prices, data and other information, believed to be reliable; however, Trade Nation does not warrant its completeness or accuracy. All market prices and market data contained in or attached to this communication are indicative and subject to change without notice.

FTSE INTRADAY resistance retest Overall trend remains bullish, supported by rising price action.
Recent Movement: Price is in a sideways consolidation phase after a strong uptrend.
Key Levels
Support:
8760 – Key level from prior consolidation.
8680, then 8640 – Next supports if 8680 breaks.
Resistance:
8830 – First upside target.
8930, then 9000 – Further resistance levels on continued strength.
Trading Scenarios
Bullish Scenario:
A pullback to 8760 followed by a bounce could lead to a move towards 8830, then higher to 8930 and 9000.
Bearish Scenario:
A confirmed break and daily close below 8760 would weaken the bullish case. In that case, expect a potential drop to 8680, then 8640.
Conclusion
The FTSE remains bullish, but a short-term pullback is possible. A bounce from 8760 would confirm trend strength. Watch 8680 closely — holding above favors bulls; a break below shifts sentiment to bearish.
This communication is for informational purposes only and should not be viewed as any form of recommendation as to a particular course of action or as investment advice. It is not intended as an offer or solicitation for the purchase or sale of any financial instrument or as an official confirmation of any transaction. Opinions, estimates and assumptions expressed herein are made as of the date of this communication and are subject to change without notice. This communication has been prepared based upon information, including market prices, data and other information, believed to be reliable; however, Trade Nation does not warrant its completeness or accuracy. All market prices and market data contained in or attached to this communication are indicative and subject to change without notice.
FTSE 100 Surges Towards Record HighFTSE 100 Surges Towards Record High
Today saw the release of new data on the UK labour market.
According to official statistics, the number of payrolled employees in the UK fell by 55,000 (0.2%) between March and April 2025. Over the broader period from February to April 2025, the number declined by 78,000 (0.3%).
In response to the drop in employment, the UK’s FTSE 100 index (UK 100 on FXOpen) jumped sharply, rising close to the 8,900 mark — near its all-time high reached in early March this year.
Market participants likely interpreted the weakening labour market as an additional argument in favour of interest rate cuts by the Bank of England. Such a move would be seen as supportive of the economy and a bullish factor for equities.
Technical Analysis of the FTSE 100 (UK 100 on FXOpen)
From a technical perspective:
→ The FTSE 100 continues to trade within an ascending channel (shown in blue);
→ Today’s bullish momentum broke through the resistance line from below — a level that had previously capped the upward movement within the channel.
If the bulls can maintain the price above the 8,860 level, the likelihood increases for a continued uptrend and a potential new all-time high for the FTSE 100 index.
This article represents the opinion of the Companies operating under the FXOpen brand only. It is not to be construed as an offer, solicitation, or recommendation with respect to products and services provided by the Companies operating under the FXOpen brand, nor is it to be considered financial advice.

FTSE INTRADAY Bullish above support at 8760Overall trend remains bullish, supported by rising price action.
Recent Movement: Price is in a sideways consolidation phase after a strong uptrend.
Key Levels
Support:
8760 – Key level from prior consolidation.
8680, then 8640 – Next supports if 8680 breaks.
Resistance:
8830 – First upside target.
8930, then 9000 – Further resistance levels on continued strength.
Trading Scenarios
Bullish Scenario:
A pullback to 8760 followed by a bounce could lead to a move towards 8830, then higher to 8930 and 9000.
Bearish Scenario:
A confirmed break and daily close below 8760 would weaken the bullish case. In that case, expect a potential drop to 8680, then 8640.
Conclusion
The FTSE remains bullish, but a short-term pullback is possible. A bounce from 8760 would confirm trend strength. Watch 8680 closely — holding above favors bulls; a break below shifts sentiment to bearish.
This communication is for informational purposes only and should not be viewed as any form of recommendation as to a particular course of action or as investment advice. It is not intended as an offer or solicitation for the purchase or sale of any financial instrument or as an official confirmation of any transaction. Opinions, estimates and assumptions expressed herein are made as of the date of this communication and are subject to change without notice. This communication has been prepared based upon information, including market prices, data and other information, believed to be reliable; however, Trade Nation does not warrant its completeness or accuracy. All market prices and market data contained in or attached to this communication are indicative and subject to change without notice.

FTSE100 sideways consolidation capped at 8850Overall trend remains bullish, supported by rising price action.
Recent Movement: Price is in a sideways consolidation phase after a strong uptrend.
Key Levels
Support:
8680 – Key level from prior consolidation.
8625, then 8510 – Next supports if 8680 breaks.
Resistance:
8850 – First upside target.
8910, then 9020 – Further resistance levels on continued strength.
Trading Scenarios
Bullish Scenario:
A pullback to 8680 followed by a bounce could lead to a move towards 8850, then higher to 8910 and 9020.
Bearish Scenario:
A confirmed break and daily close below 8680 would weaken the bullish case. In that case, expect a potential drop to 8625, then 8510.
Conclusion
The FTSE remains bullish, but a short-term pullback is possible. A bounce from 8680 would confirm trend strength. Watch 8680 closely — holding above favors bulls; a break below shifts sentiment to bearish.
This communication is for informational purposes only and should not be viewed as any form of recommendation as to a particular course of action or as investment advice. It is not intended as an offer or solicitation for the purchase or sale of any financial instrument or as an official confirmation of any transaction. Opinions, estimates and assumptions expressed herein are made as of the date of this communication and are subject to change without notice. This communication has been prepared based upon information, including market prices, data and other information, believed to be reliable; however, Trade Nation does not warrant its completeness or accuracy. All market prices and market data contained in or attached to this communication are indicative and subject to change without notice.

UK100/FTSE100 - FOLLOW THIS STRUCTURE, SURELY YOU MAKE PROFITTeam, last night for the first time I make LIVE trading on video.
Everyday i did LIVE trading but not recording
last night we have SHORT EURUSD, LONG USDCHF, LONG US30 LONG NAS AND SHORT GOLD - 5/5 perfectly hit target
Today I want to show you the structure how we can deal with UK100/FTSE100
SHORT UK at 8817-26 - double up at 8846-62
lets set this LIMIT ORDER IN
Target 1 at 8792-96
Target 2 at 8776-8755
Lets kill the market tonight!

FTSE INTRADAY sideways consolidation continuationrend: Overall trend remains bullish, supported by rising price action.
Recent Movement: Price is in a sideways consolidation phase after a strong uptrend.
Key Levels
Support:
8680 – Key level from prior consolidation.
8625, then 8510 – Next supports if 8680 breaks.
Resistance:
8850 – First upside target.
8910, then 9020 – Further resistance levels on continued strength.
Trading Scenarios
Bullish Scenario:
A pullback to 8680 followed by a bounce could lead to a move towards 8850, then higher to 8910 and 9020.
Bearish Scenario:
A confirmed break and daily close below 8680 would weaken the bullish case. In that case, expect a potential drop to 8625, then 8510.
Conclusion
The FTSE remains bullish, but a short-term pullback is possible. A bounce from 8680 would confirm trend strength. Watch 8680 closely — holding above favors bulls; a break below shifts sentiment to bearish.
This communication is for informational purposes only and should not be viewed as any form of recommendation as to a particular course of action or as investment advice. It is not intended as an offer or solicitation for the purchase or sale of any financial instrument or as an official confirmation of any transaction. Opinions, estimates and assumptions expressed herein are made as of the date of this communication and are subject to change without notice. This communication has been prepared based upon information, including market prices, data and other information, believed to be reliable; however, Trade Nation does not warrant its completeness or accuracy. All market prices and market data contained in or attached to this communication are indicative and subject to change without notice.

FTSE100 INTRADAY key trading level at 8680Trend: Overall trend remains bullish, supported by rising price action.
Recent Movement: Price is in a sideways consolidation phase after a strong uptrend.
Key Levels
Support:
8680 – Key level from prior consolidation.
8625, then 8510 – Next supports if 8680 breaks.
Resistance:
8850 – First upside target.
8910, then 9020 – Further resistance levels on continued strength.
Trading Scenarios
Bullish Scenario:
A pullback to 8680 followed by a bounce could lead to a move towards 8850, then higher to 8910 and 9020.
Bearish Scenario:
A confirmed break and daily close below 8680 would weaken the bullish case. In that case, expect a potential drop to 8625, then 8510.
Conclusion
The FTSE remains bullish, but a short-term pullback is possible. A bounce from 8680 would confirm trend strength. Watch 8680 closely — holding above favors bulls; a break below shifts sentiment to bearish.
This communication is for informational purposes only and should not be viewed as any form of recommendation as to a particular course of action or as investment advice. It is not intended as an offer or solicitation for the purchase or sale of any financial instrument or as an official confirmation of any transaction. Opinions, estimates and assumptions expressed herein are made as of the date of this communication and are subject to change without notice. This communication has been prepared based upon information, including market prices, data and other information, believed to be reliable; however, Trade Nation does not warrant its completeness or accuracy. All market prices and market data contained in or attached to this communication are indicative and subject to change without notice.

FTSE INTRADAY sideways consolidation supported at 8680Trend: Overall trend remains bullish, supported by rising price action.
Recent Movement: Price is in a sideways consolidation phase after a strong uptrend.
Key Levels
Support:
8680 – Key level from prior consolidation.
8625, then 8510 – Next supports if 8680 breaks.
Resistance:
8850 – First upside target.
8910, then 9020 – Further resistance levels on continued strength.
Trading Scenarios
Bullish Scenario:
A pullback to 8680 followed by a bounce could lead to a move towards 8850, then higher to 8910 and 9020.
Bearish Scenario:
A confirmed break and daily close below 8680 would weaken the bullish case. In that case, expect a potential drop to 8625, then 8510.
Conclusion
The FTSE remains bullish, but a short-term pullback is possible. A bounce from 8680 would confirm trend strength. Watch 8680 closely — holding above favors bulls; a break below shifts sentiment to bearish.
This communication is for informational purposes only and should not be viewed as any form of recommendation as to a particular course of action or as investment advice. It is not intended as an offer or solicitation for the purchase or sale of any financial instrument or as an official confirmation of any transaction. Opinions, estimates and assumptions expressed herein are made as of the date of this communication and are subject to change without notice. This communication has been prepared based upon information, including market prices, data and other information, believed to be reliable; however, Trade Nation does not warrant its completeness or accuracy. All market prices and market data contained in or attached to this communication are indicative and subject to change without notice.

FTSE INTRADAY bullish uptrend consolidation supported at 8600Trend: Overall trend remains bullish, supported by rising price action.
Recent Movement: Price is in a sideways consolidation phase after a strong uptrend.
Key Levels
Support:
8600 – Key level from prior consolidation.
8480, then 8430 – Next supports if 8600 breaks.
Resistance:
8850 – First upside target.
8910, then 9020 – Further resistance levels on continued strength.
Trading Scenarios
Bullish Scenario:
A pullback to 8600 followed by a bounce could lead to a move towards 8850, then higher to 8910 and 9020.
Bearish Scenario:
A confirmed break and daily close below 8600 would weaken the bullish case. In that case, expect a potential drop to 8480, then 8430.
Conclusion
The FTSE remains bullish, but a short-term pullback is possible. A bounce from 8600 would confirm trend strength. Watch 8600 closely — holding above favors bulls; a break below shifts sentiment to bearish.
This communication is for informational purposes only and should not be viewed as any form of recommendation as to a particular course of action or as investment advice. It is not intended as an offer or solicitation for the purchase or sale of any financial instrument or as an official confirmation of any transaction. Opinions, estimates and assumptions expressed herein are made as of the date of this communication and are subject to change without notice. This communication has been prepared based upon information, including market prices, data and other information, believed to be reliable; however, Trade Nation does not warrant its completeness or accuracy. All market prices and market data contained in or attached to this communication are indicative and subject to change without notice.

"UK100 Grand Heist: Bullish Loot Plan with Thief Trading Style!🌍 Hello, Global Wealth Warriors! Ciao, Salut, Guten Tag, Ola! 🌟
Fellow Profit Pirates & Market Mavericks, 💸⚡
Unveiling our cunning blueprint to plunder the "UK100/FTSE100" Index Market, crafted with 🔥Thief Trading’s razor-sharp technical and fundamental insights🔥. Stick to the chart’s game plan, zoned in on a long entry. Our mission? Slip out near the high-stakes ATR Zone Level—a perilous spot with overbought vibes, consolidation, trend flips, and traps where bearish bandits lurk. 🏴☠️💰 Celebrate your wins, traders—you’ve earned it! 🎉
📈 **Entry Point**: The vault’s unlocked! Grab the bullish bounty at current prices—the heist is live!
💡 Pro Tip: Set buy limit orders on a 15 or 30-minute timeframe, targeting recent or swing lows/highs. Don’t forget to set chart alerts for precision! 🚨
🛑 **Stop Loss**:
📍 Thief SL parked at the recent/swing low on the 4H timeframe (8500.0) for day/swing trades.
📍 Tailor your SL to your risk appetite, lot size, and number of orders. Stay sharp!
🎯 **Target**: Aim for 8850.0 or make a swift exit just before.
👀 **Scalpers, Listen Up**: Stick to long-side scalping. Got deep pockets? Dive in now! Otherwise, join swing traders for the grand heist. Use trailing SL to shield your loot. 💰
💹 **Market Pulse**: The UK100/FTSE100 is in a neutral zone but leaning bullish, fueled by key drivers. ☝
🌐 Dive into fundamentals—macro economics, COT reports, geopolitical updates, sentiment, intermarket analysis, and index-specific trends. Check the linkss for the full scoop! 🔗🌍
⚠️ **Trading Alert**: News can shake the market! 📰
🔐 Protect your positions:
- Pause new trades during news releases.
- Use trailing stop-loss to lock in gains.
💪 **Join the Heist**: Smash the Boost Button to supercharge our robbery squad! 💥 With Thief Trading Style, we rake in profits daily with ease. 🚀 Your support fuels our market conquests. 🤝❤️
Stay tuned for the next daring heist, money makers! 🤑🐱👤🎯

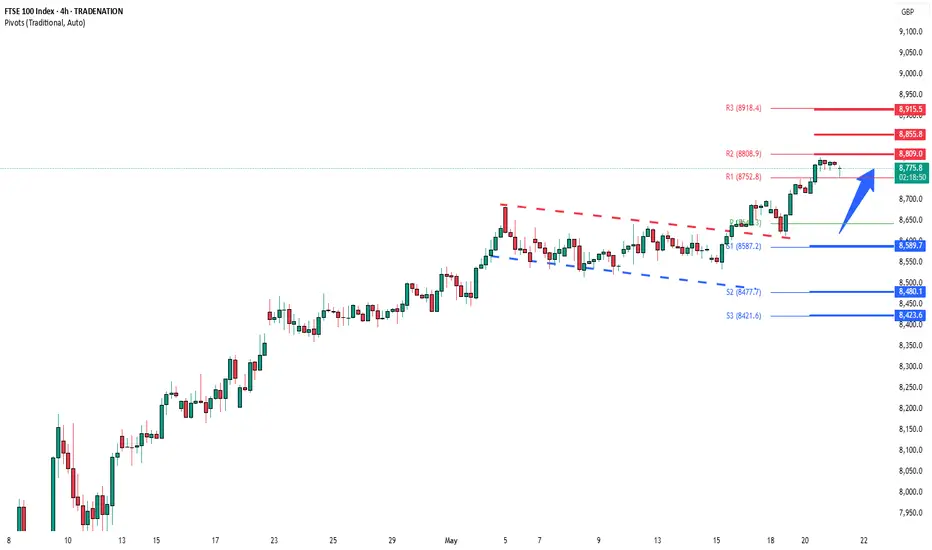
FTSE INTRADAY bullish continuaation breakoutThe FTSE 100 is showing bullish momentum, supported by an ongoing uptrend. Recent price action suggests a breakout above a period of sideways consolidation, indicating strong buying interest.
Key Support: 8590 – This was the previous consolidation zone and now acts as a critical level.
If the index pulls back to 8590 and holds, it may resume the uptrend with potential upside targets at:
8810 (near-term resistance)
8850, then 8920 (longer-term targets)
Bearish Scenario: A daily close below 8590 would weaken the bullish case and could lead to a decline toward:
8480 (next support)
Then 8420 if selling pressure increases
Conclusion:
The FTSE 100 remains bullish above 8590. Watch for a bounce from this level to confirm further upside. A break below would shift the outlook to bearish in the short term.
This communication is for informational purposes only and should not be viewed as any form of recommendation as to a particular course of action or as investment advice. It is not intended as an offer or solicitation for the purchase or sale of any financial instrument or as an official confirmation of any transaction. Opinions, estimates and assumptions expressed herein are made as of the date of this communication and are subject to change without notice. This communication has been prepared based upon information, including market prices, data and other information, believed to be reliable; however, Trade Nation does not warrant its completeness or accuracy. All market prices and market data contained in or attached to this communication are indicative and subject to change without notice.

FTSE INTRADAY bullish breakout continuation above 8590The FTSE 100 is showing bullish momentum, supported by an ongoing uptrend. Recent price action suggests a breakout above a period of sideways consolidation, indicating strong buying interest.
Key Support: 8590 – This was the previous consolidation zone and now acts as a critical level.
If the index pulls back to 8590 and holds, it may resume the uptrend with potential upside targets at:
8810 (near-term resistance)
8850, then 8920 (longer-term targets)
Bearish Scenario: A daily close below 8590 would weaken the bullish case and could lead to a decline toward:
8480 (next support)
Then 8420 if selling pressure increases
Conclusion:
The FTSE 100 remains bullish above 8590. Watch for a bounce from this level to confirm further upside. A break below would shift the outlook to bearish in the short term.
This communication is for informational purposes only and should not be viewed as any form of recommendation as to a particular course of action or as investment advice. It is not intended as an offer or solicitation for the purchase or sale of any financial instrument or as an official confirmation of any transaction. Opinions, estimates and assumptions expressed herein are made as of the date of this communication and are subject to change without notice. This communication has been prepared based upon information, including market prices, data and other information, believed to be reliable; however, Trade Nation does not warrant its completeness or accuracy. All market prices and market data contained in or attached to this communication are indicative and subject to change without notice.
FTSE 100: Bearish Order flowBearish Crab Pattern via the 1H timeframe. Let's see how this plays out.
There's also an order block at the bottom on the H4 timeframe. Maybe price could go bearish to mitigate it. As they say, false move beginning of the week.
