WILL GOLD CONTINUE ITS RALLY OR FACE A MAJOR CORRECTION? XAUUSD – WILL GOLD CONTINUE ITS RALLY OR FACE A MAJOR CORRECTION?
Gold is at a pivotal point after experiencing a significant correction following its recent rally. With the market showing mixed signals, the question now is whether gold will continue its upward trajectory or experience further corrections before breaking new highs. The current global economic climate, combined with macroeconomic factors, will be the driving forces behind gold's next move.
🌍 MACROECONOMIC OUTLOOK & MARKET SENTIMENT
US Dollar Strength: The USD has been strengthening, which has put some pressure on gold prices. However, this comes amid uncertainty in global trade relations, particularly between the US and China, which is creating mixed market sentiment. Gold remains a key asset for hedging against currency risks and geopolitical tensions.
Federal Reserve's Stance on Interest Rates: The Fed has signaled that while inflation remains a concern, it’s unlikely to cut interest rates in the near future. This could limit gold's upside potential in the short term, but the metal remains attractive due to its safe-haven status.
Geopolitical Tensions: With ongoing concerns over US-China trade talks and tensions surrounding Ukraine, investors continue to flock to gold as a hedge against political and economic instability. These external pressures continue to fuel demand for gold.
📈 TECHNICAL ANALYSIS (H1 – EMA 13/34/89/200)
Current Correction: Gold has been correcting after a strong surge, testing key support levels like 3300. On the H1 timeframe, the EMA indicators suggest consolidation and weakness, signaling that further pullbacks are possible before any potential breakout.
Technical Pattern – "Flag" Formation: Gold is forming a bearish flag pattern, indicating a temporary pause after a strong upward trend. This pattern suggests that gold might continue to trade sideways, with a breakout above key resistance levels leading to a continuation of the uptrend.
Key Resistance and Support Levels: Gold is facing significant resistance levels at 3320 and 3330, while key support levels at 3300 and 3270 will be crucial to watch in the coming sessions.
📍 KEY LEVELS TO WATCH
Resistance Levels: 3320 – 3330 – 3338 – 3350 – 3360
Support Levels: 3300 – 3270 – 3250
🧭 RECOMMENDED TRADE SETUPS
🔵 BUY ZONE: 3270 – 3272
SL: 3265
TP: 3280 → 3300 → 3320 → 3330 → 3350
🔻 SELL ZONE: 3320 – 3325
SL: 3330
TP: 3310 → 3295 → 3280 → 3265
✅ SUMMARY
Gold is currently experiencing a correction after a solid rally, but the long-term outlook remains bullish. Macro-economic factors, including the Fed’s policies and geopolitical risks, are likely to drive gold prices higher in the future. However, short-term fluctuations should be expected as the market tests key resistance and support levels.
Traders should focus on well-defined entry and exit points within these key levels and maintain a disciplined risk management strategy.
Fundamental-analysis

Fundamental Market Analysis for June 10, 2025 EURUSDAn Event to pay attention today:
13:00 EET. USD - NFIB Small Business Optimism Index
EURUSD:
The EUR/USD pair is struggling to capitalise on the previous day's gains and is attracting new sellers around 1.1435 during Tuesday's Asian session. The intraday decline is driven by solid demand for the US dollar (USD) and has pushed spot prices below 1.1400 in the last hour.
Friday's US non-farm payrolls (NFP) report, which showed higher-than-expected data, dampened hopes for an early interest rate cut by the Federal Reserve (Fed) this year. This, along with optimism about the resumption of trade talks between the US and China, is prompting traders to ease their bearish bets on the US dollar, which is proving to be a key factor putting pressure on the EUR/USD pair. However, as negotiations continued into a second day in London, traders may refrain from aggressive directional bets.
In addition, traders still see a rate cut by the US central bank in September as more likely. This, along with concerns about the financial health of the US government, may limit further strengthening of the US dollar and provide support for the EUR/USD pair. In contrast, the European Central Bank (ECB) hinted at the end of its rate-cutting cycle at its meeting last week. This could further benefit the single currency and help limit losses for the currency pair.
Traders may also refrain from aggressive betting ahead of this week's US inflation data release.
Trading recommendation: SELL 1.1390, SL 1.1410, TP 1.1300

USD/CAD - Channel Breakout (10.06.2025)The USD/CAD pair on the M30 timeframe presents a Potential Buying Opportunity due to a recent Formation of a Channel Breakout Pattern. This suggests a shift in momentum towards the upside and a higher likelihood of further advances in the coming hours.
Possible Long Trade:
Entry: Consider Entering A Long Position around Trendline Of The Pattern.
Target Levels:
1st Resistance – 1.3757
2nd Resistance – 1.3792
🎁 Please hit the like button and
🎁 Leave a comment to support for My Post !
Your likes and comments are incredibly motivating and will encourage me to share more analysis with you.
Best Regards, KABHI_TA_TRADING
Thank you.
Disclosure: I am part of Trade Nation's Influencer program and receive a monthly fee for using their TradingView charts in my analysis.

WILL EUR CONTINUE TO RALLY AHEAD OF THE IMPORTANT NFP DATA?EUR/USD – WILL EUR CONTINUE TO RALLY AHEAD OF THE IMPORTANT NFP DATA?
📈 EUR/USD IS AT A CRITICAL POINT AHEAD OF KEY ECONOMIC DATA
Amid the ongoing pressure on the US Dollar and macroeconomic factors supporting the Euro, EUR/USD might continue its short-term bullish trend. However, key data such as US CPI and central bank meetings could determine the direction for this currency pair moving forward.
🌍 Macroeconomic Overview & Market Sentiment
USD & DXY: The US Dollar continues to weaken due to signals from the Federal Reserve (Fed) that they are not in a hurry to cut interest rates. DXY has fallen below the 99 level, with macroeconomic factors showing a continued bearish trend for the USD.
Eurozone: The ECB (European Central Bank) is maintaining a slightly tight monetary policy. However, the Eurozone economy is showing signs of recovery, with positive data from the region.
US Economy: Forecasts for the US labor market data could impact the USD and lead to volatility in the EUR/USD pair. All attention is on the reports from the US this week.
📊 Technical Analysis (H1 – H4 – D1)
EMA 13/34/89/200: The EMA indicators on the H1 and H4 timeframes support the current bullish trend for EUR/USD in the short term. In particular, the EMA 13 and EMA 34 are crossing above the EMA 200, signaling a strong upward trend.
Wave Structure: EUR/USD is currently in a corrective wave after testing the strong resistance level at 1.1450. A recovery signal is emerging around the support level at 1.1380, which could present a buying opportunity in the short term.
Fibonacci Expansion: The Fibonacci extension levels at 1.1470 and 1.1490 could be the next targets if EUR/USD breaks through the 1.1400 resistance zone.
⚡ Key Levels to Watch
Resistance: 1.1450, 1.1470, 1.1490, 1.1500
Support: 1.1380, 1.1350, 1.1320, 1.1300
🧭 Trading Scenario
🔵 BUY ZONE: 1.1380 – 1.1365
SL: 1.1340
TP: 1.1420 → 1.1450 → 1.1470 → 1.1490
🔻 SELL ZONE: 1.1450 – 1.1460
SL: 1.1475
TP: 1.1420 → 1.1400 → 1.1370 → 1.1350
✅ Summary
EUR/USD is currently in a short-term bullish trend and could continue to rise if the support at 1.1365 holds. However, key economic data from the US, especially CPI and central bank meetings from the Fed and ECB, could impact the next direction for this pair. Traders should keep an eye on important support and resistance levels to identify safe trading opportunities.

Will the Trend Explode or Continue to Retrace? XAUUSD Trading Plan - Will the Trend Explode or Continue to Retrace? 🔥
📉 Current Situation:
Gold is currently undergoing a retracement after a strong increase at the beginning of the week. The market is being influenced by macroeconomic factors like the US-China trade negotiations and fluctuations in the US dollar. Gold may either continue its retracement or break out of the current price range.
🔧 Technical Analysis:
🔶 Key Levels:
🔶 Support Zone: 3,276.121 - 3,289.874. These zones are crucial in confirming the strength of the bullish trend.
🔶 Resistance Zone: 3,345.715, 3,363.845. If these levels are broken, gold could continue to rise sharply.
📊 Technical Indicators:
The Exponential Moving Averages (EMA) 13, 34, and 89 support the short-term bullish trend.
The trendline shows that the bullish trend is intact, but a slight correction may happen in the short term.
💼 Fundamental and Macro Analysis:
The US-China trade negotiations are the key drivers of market sentiment. If the negotiations yield positive news, gold could continue to rise. However, if concerns arise about tariffs or failed talks, gold could face pressure.
Key US economic indicators, such as PMI, GDP, and NFP, will play a crucial role in shaping the direction of the US dollar, and thus, the price of gold.
🎯 Trading Plan:
🔶 Buy Zone:
Entry Zone: 3,289.874 - 3,276.121
Stop Loss (SL): 3,269.000
Take Profit (TP):
TP 1: 3,302.000
TP 2: 3,317.000
TP 3: 3,327.000
TP 4: 3,340.000
🔶 Sell Zone:
Entry Zone: 3,345.715 - 3,363.845
Stop Loss (SL): 3,370.000
Take Profit (TP):
TP 1: 3,327.000
TP 2: 3,310.000
TP 3: 3,300.000
TP 4: 3,289.000
⚠️ Key Points to Watch:
🔒 Strong Support Zone: 3,289.874 represents a key support zone. If the price breaks below this level, we could see gold approach 3,276.121.
🔓 Strong Resistance Zone: 3,345.715 - 3,363.845 is the key resistance zone. If broken, gold could continue to rise to 3,380.000 or higher.
📈 Market Psychology:
Gold is in a retracement phase after a significant rise, but both technical and fundamental factors suggest that the bullish trend may continue. It is essential to closely monitor signals from the US-China trade negotiations and economic news affecting the US dollar.
💥 Conclusion:
Gold is in a retracement phase after a strong increase, but technical and fundamental factors indicate that a bullish recovery could be on the horizon. Prepare your trading plans based on key support and resistance levels.
📌 Good luck and happy trading to all!

Fundamental Market Analysis for June 9, 2025 USDJPYThe Japanese Yen (JPY) is rising at the start of the new week, reacting to upward revisions to Japan's first quarter GDP data. This comes amid signs of rising inflation in Japan and confirmation of bets that the Bank of Japan (BoJ) will continue to raise interest rates, which in turn provides a slight boost to the JPY. In addition, a modest decline in the US Dollar (USD) is putting some downward pressure on the USD/JPY pair during the Asian session.
For now, the Yen appears to have broken a two-day losing streak against its US counterpart, although traders may refrain from aggressive directional bets ahead of key US-China trade talks in London. In addition, stronger-than-expected US jobs data released on Friday dampened hopes that the Federal Reserve (Fed) will cut interest rates soon this year, which could serve as a tailwind for the dollar and limit USD/JPY pair losses.
Trade recommendation: SELL 143.85, SL 144.85, TP 141.85

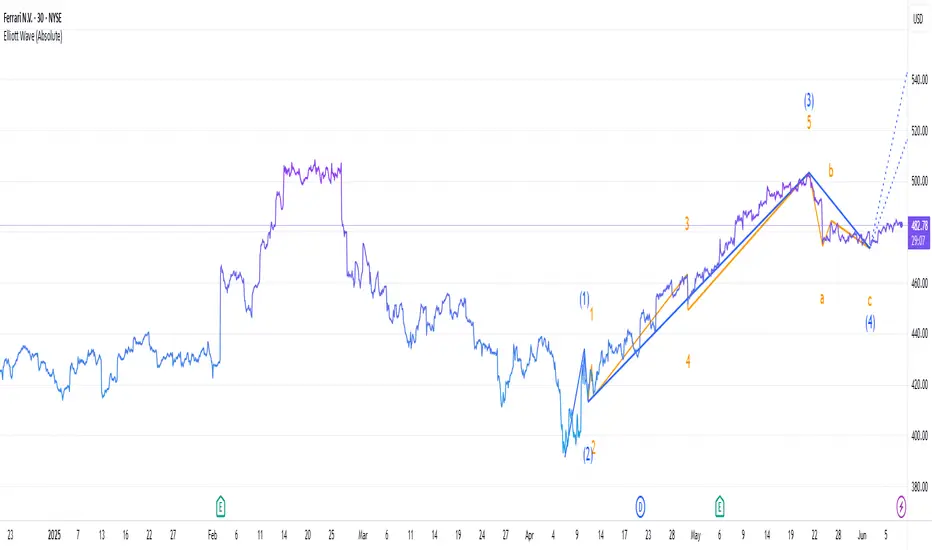
Is Ferrari's stock still bullish?Is Ferrari's stock still bullish?
Technical Outlook
Elliot Wave theory suggests a cautious bullish stance. The present correction seems to be a temporary setback, likely driven by guidance and tariff fears, but sets the stage for a potential rally to $520-$540 if support is not broken. However, risks of a deeper correction (i.e., to $420-$440) persist if pressures from the outside intensify.
The stock is currently trading above all three of its major EMA levels — daily, weekly, and monthly — that is a good technical signal. The rising daily EMA at 479.98 suggests that short-run momentum remains healthy. The weekly EMA at 461.77 provides medium-term support, while the monthly EMA at 421.08 supports the longer-term trend solidly.
Positive Sentiment Factors
Ferrari reported robust Q1 2025 results, with net revenues of €1.79 billion (up 13% YoY), an operating profit of €542 million (up 22.7%), and a net profit of €412 million (up 17%). Adjusted earnings per share were €2.30, surpassing analyst expectations of €2.28. This shows Ferrari’s strong pricing power and demand for personalized vehicles.
Analyst Sentiment: Optimism remains for Ferrari among some analysts. UBS raised its price target to $560 from $520, maintaining a Buy rating, with the new Ferrari Elettrica a major catalyst, the company said. Bernstein and RBC Capital maintained Outperform ratings on the stock at $575 and €500, respectively. Barclays upgraded Ferrari to Overweight, calling it a "safe haven" in a shaky European automotive environment.
Brand Strength and Strategic Positioning: Ferrari’s luxury brand and high demand for models like the Roma Spider, 296 GTS, SF90 XX, and Purosangue bolster its market position.
Neutral Sentiment Factors
Market and Industry Context: The broader market has been volatile due to trade developments and tariff relief rallies. Ferrari’s stock has been influenced by these macroeconomic factors, but its luxury positioning makes it less sensitive than mass-market automakers.
Formula 1 Performance: Ferrari’s underwhelming Formula 1 season, with McLaren significantly outscoring Ferrari in points poses some concern among investors. While this does not directly impact stock performance, it may indirectly affect brand sentiment among enthusiasts.
Negative Sentiment Factors
Tariff Concerns: Ferrari shares have been sensitive to Trump's U.S. tariff policies. A tariff increase would add up to $50,000 to the price of an average Ferrari, potentially cutting sales volumes in the U.S., which accounts for 28.8% of net sales. JPMorgan warned that tariff impacts might be "worse" for Ferrari, lowering the price target to $460 from $525
Conclusion
Ferrari stock has a bullish but cautious bias, supported by solid fundamentals, favorable technical momentum, and positive analyst sentiment on upcoming product releases such as the Ferrari Elettrica. Macro risks, however, including U.S. trade policy and market volatility, are still major overhangs.
USD/JPY - Triangle Breakout (06.06.2025)The USD/JPY pair on the M30 timeframe presents a Potential Buying Opportunity due to a recent Formation of a Triangle Pattern. This suggests a shift in momentum towards the upside and a higher likelihood of further advances in the coming hours.
Possible Long Trade:
Entry: Consider Entering A Long Position around Trendline Of The Pattern.
Target Levels:
1st Resistance – 144.94
2nd Resistance – 145.52
🎁 Please hit the like button and
🎁 Leave a comment to support for My Post !
Your likes and comments are incredibly motivating and will encourage me to share more analysis with you.
Best Regards, KABHI_TA_TRADING
Thank you.
Disclosure: I am part of Trade Nation's Influencer program and receive a monthly fee for using their TradingView charts in my analysis.

AJA's Gold view. The Bear is in charge for now.Just the start of the Bearish move.
Like I analysed. For now, we're selling till 3315.
Check my last analysis. What do you think?

Fundamental Market Analysis for June 6, 2025 GBPUSDThe GBP/USD pair is trading near 1.3570 with little movement ahead of the US (US) labor market data.
The US Dollar Index (DXY), which measures the value of the US Dollar against six major currencies, is trading above around 98.80 at the time of writing. The upcoming US non-farm payrolls data for May is expected to add 130,000 jobs, down from April's 177,000. The unemployment rate is also expected to remain unchanged at 4.2%.
Weekly initial jobless claims rose to 247,000, above the 235,000 expected, U.S. Labor Department data showed. ADP US private sector employment data released on Thursday showed a 37,000 increase in May versus a 60,000 increase (revised from 62,000) recorded in April, well below market expectations of 115,000.
GBP/USD is gaining support as the Pound Sterling (GBP) finds support amid rising risk sentiment in the United Kingdom (UK) markets following US President Donald Trump's executive order signed on Tuesday. British exporters still face the previous 25 percent tariff rate as Trump granted the UK temporary relief from the US' stiff 50 percent tariffs on steel and aluminum.
Trading recommendation: SELL 1.3500, SL 1.3600, TP 1.3300

EURO-USD BUY STRONG 1. "EUR/USD Strong Buy Alert 🚀 | Key support zone holding firm – bulls eyeing the next leg up!"
2. "Strong Buy Zone ✅ | EUR/USD showing bullish momentum from this support level – eyes on 1.09+"
3. "EUR/USD Reversal Zone 💥 | Buyers stepping in strong – potential rally ahead!"
4. "Watch this zone! EUR/USD strong buy setup forming – bullish confirmation underway 📈"
5. "EUR/USD bouncing from key demand zone 🔥 | Technicals align for a strong buy signal!"

USD/CHF - Triangle Breakout (06.06.2025)The USD/CHF pair on the M30 timeframe presents a Potential Buying Opportunity due to a recent Formation of a Triangle Pattern. This suggests a shift in momentum towards the upside and a higher likelihood of further advances in the coming hours.
Possible Long Trade:
Entry: Consider Entering A Long Position around Trendline Of The Pattern.
Target Levels:
1st Resistance – 0.8263
2nd Resistance – 0.8227
🎁 Please hit the like button and
🎁 Leave a comment to support for My Post !
Your likes and comments are incredibly motivating and will encourage me to share more analysis with you.
Best Regards, KABHI_TA_TRADING
Thank you.
Disclosure: I am part of Trade Nation's Influencer program and receive a monthly fee for using their TradingView charts in my analysis.

USD/CAD - Bearish Flag (04.06.2025)The USD/CAD Pair on the M30 timeframe presents a Potential Selling Opportunity due to a recent Formation of a Bearish Flag Pattern. This suggests a shift in momentum towards the downside in the coming hours.
Possible Short Trade:
Entry: Consider Entering A Short Position around Trendline Of The Pattern.
Target Levels:
1st Support – 1.3645
2nd Support – 1.3605
🎁 Please hit the like button and
🎁 Leave a comment to support for My Post !
Your likes and comments are incredibly motivating and will encourage me to share more analysis with you.
Best Regards, KABHI_TA_TRADING
Thank you.
Disclosure: I am part of Trade Nation's Influencer program and receive a monthly fee for using their TradingView charts in my analysis.

Fundamental Market Analysis for June 5, 2025 EURUSDThe EUR/USD pair is trading cautiously, slightly above the key level of 1.14000 during Thursday's Asian trading session. The major currency pair is expected to remain in a sideways trend as investors await the European Central Bank's (ECB) interest rate decision.
The ECB is almost certain to cut its key lending rates by 25 basis points (bps), bringing the deposit rate and the main refinancing rate to 2% and 2.15%, respectively. This will be the ECB's seventh consecutive interest rate cut and the eighth since June last year, when it began its cycle of monetary expansion.
Traders are increasingly confident of a seventh consecutive ECB interest rate cut as deflationary trends persist in the eurozone. Preliminary data from the eurozone's harmonized index of consumer prices (HICP) released on Tuesday showed that inflationary pressure fell below the central bank's 2% target.
With the Fed widely expected to cut interest rates, investors will be watching ECB President Christine Lagarde's press conference closely for clues on likely monetary policy in the second half of the year. Market participants would also like to hear about the progress of trade negotiations with the US.
Meanwhile, the US dollar (USD) is struggling to stay near a six-week low as weak US data has reignited stagflation risks. The ISM Services PMI unexpectedly declined in May, while its components showed that production costs continue to rise rapidly. ADP employment change data, which reflects labor demand in the private sector, showed that 37,000 new jobs were created in May, the lowest figure since February 2021.
Trading recommendation: SELL 1.14100, SL 1.14400, TP 1.13600

GBP/NZD - Triangle Breakout (05.06.2025)The GBP/NZD Pair on the M30 timeframe presents a Potential Selling Opportunity due to a recent Formation of a Triangle Breakout Pattern. This suggests a shift in momentum towards the downside in the coming hours.
Possible Short Trade:
Entry: Consider Entering A Short Position around Trendline Of The Pattern.
Target Levels:
1st Support – 2.2345
2nd Support – 2.2285
🎁 Please hit the like button and
🎁 Leave a comment to support for My Post !
Your likes and comments are incredibly motivating and will encourage me to share more analysis with you.
Best Regards, KABHI_TA_TRADING
Thank you.
Disclosure: I am part of Trade Nation's Influencer program and receive a monthly fee for using their TradingView charts in my analysis.

AJA'S Gold view... Daily Timeframe Analysis.Gold has been on a correction spree now, with short term buys.
On the monthly timeframe, Gold is completely OVERSOLD.
From my analysis on the daily timeframe, the bear power is more, we'll keep selling to our poi, which is our order block at 3025-2975.
Gold needs to make a huge correction by coming down past the inducement point at 3122 before hitting the order block at that BOS.
Then we'll see if the bearish market will continue, or the bull will take power.
What do you think about this analysis?

USDCAD 04/06 – BoC Rate Decision Ahead USDCAD 04/06 – BoC Rate Decision Ahead | Will the Market Break Higher or Reverse From 1.3820?
The USDCAD pair is trading around the 1.3700 area as markets prepare for the upcoming Bank of Canada (BoC) interest rate decision. Price action shows potential for a breakout, but macro risks remain high.
🌍 MACRO OUTLOOK
BoC Expected to Hold Rates
Analysts widely expect the BoC to keep the interest rate unchanged at 2.75%, marking the third consecutive pause. Inflation has slipped below 2%, supporting the case for a dovish tone.
Trade Policy in Focus
With growing global uncertainties and Trump’s trade stance back in the spotlight, BoC Governor Tiff Macklem is expected to address policy risks, especially related to tariffs.
Market Sentiment
USD is mildly weaker after soft ISM data.
CAD remains near YTD highs but sensitive to policy commentary.
📉 TECHNICAL OUTLOOK – H2 Chart
Price is forming a potential double bottom near the 1.3693 zone – a key structure support.
Resistance sits at 1.3725 – 1.3757. A confirmed breakout could lead to a test of 1.3824, the recent high.
Failure to hold 1.3690 may expose deeper downside toward 1.3620–1.3600.
🔑 KEY LEVELS TO WATCH
🟢 BUY ZONE: 1.3693 – 1.3700
SL: 1.3670
TP: 1.3725 → 1.3757 → 1.3800 → 1.3824
🔴 SELL ZONE: 1.3824 – 1.3830
SL: 1.3850
TP: 1.3780 → 1.3750 → 1.3700 → 1.3650
🎯 TRADE STRATEGY
If BoC holds rates with a dovish bias, USDCAD may rally sharply toward 1.3824 and potentially higher.
If BoC surprises with hawkish comments, CAD strength may push the pair lower, targeting the 1.36 handle.
Traders should be cautious around 1.3690 – this is the pivot zone for the week.
📌 CONCLUSION
“The BoC’s decision may already be priced in – but the true volatility could come from Governor Macklem’s press conference. Any hint regarding Trump’s trade policies could trigger sharp moves. Stick to clean key levels and protect your capital.”

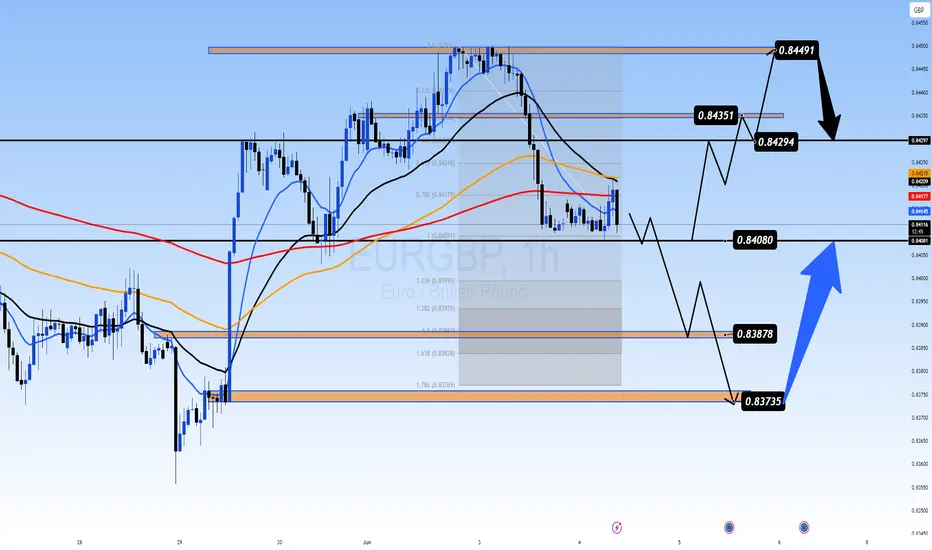
PMI Divergence & ECB Rate Decision Looms:0.84 Key Level in PlayEURGBP 04/06 – PMI Divergence & ECB Rate Decision Looms: 0.84 Key Level in Play
EUR/GBP is hovering around the 0.8420 mark after mixed PMI releases from the Eurozone and Germany. Traders are cautiously awaiting the ECB’s interest rate decision this Thursday, while the Bank of England signals potential easing — but remains non-committal on timing.
🌍 MACRO OUTLOOK
Eurozone & German PMI:
Eurozone Composite PMI eased to 50.2, still above forecasts (49.5) but reflecting slowing momentum.
German Composite dropped to 48.5; Services fell further to 47.1 — signaling contraction risk in Europe’s largest economy.
ECB Dovish Expectations:
Core inflation fell to 1.9% YoY in May — below the 2% ECB target for the first time in eight months.
Markets are fully pricing in a 25bps rate cut this week.
BoE Shifts Cautiously Dovish:
Governor Andrew Bailey acknowledged that monetary easing is likely, but warned of "uncertainty ahead."
The MPC is split — some fear sticky inflation; others warn that rates staying too high too long may damage growth.
Market Sentiment:
EUR remains pressured by ECB dovish expectations.
GBP is also under pressure from weak UK macro indicators and global trade tensions.
📉 TECHNICAL OUTLOOK (H1 Chart)
Price is consolidating near the EMA200 (0.8409) — a crucial dynamic support.
A tight sideways range has formed; 0.8408 is a key horizontal level to watch for breakout/breakdown confirmation.
Break below 0.8408 could send price toward Fibo 1.618 at 0.8383 or psychological support at 0.8373.
If bulls defend 0.8408, we may see a bounce toward 0.8429 → 0.8449 resistance zone.
🔑 KEY TRADE ZONES
🟢 BUY ZONE: 0.8380 – 0.8373
SL: 0.8358
TP: 0.8400 → 0.8415 → 0.8429 → 0.8435
🔴 SELL ZONE: 0.8448 – 0.8450
SL: 0.8460
TP: 0.8435 → 0.8420 → 0.8408 → 0.8388
⚠️ TRADE STRATEGY
Watch the 0.8408 area closely. If price holds → short-term BUY scalp opportunities.
If it breaks strongly → consider SELL toward lower Fibo/structure levels at 0.838x.
Be cautious around ECB release — avoid trading during the spike. Wait for structure confirmation post-news.
📌 CONCLUSION
"EUR/GBP is entering a critical zone near 0.8400. With ECB and BoE both leaning dovish, expect increased volatility. Hold or break at this key level will likely define the next directional leg. Stay patient and let the market show its hand."
Gold Awaits Breakout: Will the 3345–3370 Range Explode? XAUUSD 04/06 – Gold Awaits Breakout: Will the 3345–3370 Range Explode?
Gold is currently consolidating within a critical range between 3345–3370, following a wave 4 correction. After a sharp retracement to the 335x area, traders are closely watching for the next move — either a continuation of the correction or a breakout toward new highs.
🌍 MACRO CONTEXT
Trump–Xi Call Incoming: A high-level diplomatic call is expected in the coming days. Market participants are anticipating potential shifts in global trade sentiment.
US 10-Year Yields remain elevated, keeping pressure on gold in the short term. However, geopolitical risks and macro uncertainty still support demand for safe-haven assets.
The US Dollar Index (DXY) is showing signs of weakness after recent strength, which may give gold room for recovery.
📉 TECHNICAL ANALYSIS – H1 / H4 Timeframe
Gold is in a wave 4 structure within a 5-wave Elliott pattern. A break above 3370 could signal the beginning of wave 5, targeting 3400.
A breakdown below 3345 would imply deeper correction toward the 332x liquidity zone, completing wave 4 before a bullish continuation.
EMAs 13 and 34 remain above EMA200 on H1, indicating the broader uptrend is still intact.
🔑 STRATEGIC PRICE LEVELS
🟢 BUY ZONE: 3317 – 3315
Stop Loss: 3310
Take Profit: 3322 → 3326 → 3330 → 3334 → 3338 → 3345 → 3350 → 3360
🔴 SELL ZONE: 3372 – 3374
Stop Loss: 3378
Take Profit: 3368 → 3364 → 3360 → 3356 → 3350 → 3345
⚠️ STRATEGY RECOMMENDATION
Respect the 3345–3370 range until a breakout is confirmed.
Avoid chasing trades in the middle of the range. Wait for strong rejections or clear breakout confirmations.
Be cautious with unexpected news from the Trump–Xi call, which may trigger sudden market volatility.
📌 FINAL THOUGHT
“Gold is at a turning point. Break above 3370 and we may see wave 5 unfold toward 3400. But a breakdown below 3345 could drag price lower before the next bullish leg begins. Focus on the key zones — volatility is just getting started.”

GBPUSD – Is the Recovery Losing Steam? GBPUSD – Is the Recovery Losing Steam? Watch for Technical Pullback Ahead of NFP
The GBPUSD pair has recently rebounded impressively from the 1.3427 key support zone, reflecting short-term USD weakness and growing speculation of rate cuts by the Fed. However, after the strong bullish move, the market is now showing signs of exhaustion and potential profit-taking—especially with high-impact US employment data just around the corner.
🔍 Macro & Fundamental Overview:
United States: All eyes are on this week’s JOLTS and Non-Farm Payrolls (NFP) reports. Weak jobs data could strengthen the case for rate cuts by the Fed in Q3, weighing on the US Dollar. On the flip side, a solid print would revive “higher for longer” rate expectations and likely support USD strength.
United Kingdom: Although inflation remains above the Bank of England’s 2% target, political uncertainty ahead of July’s general election may keep GBP on the defensive, especially if BoE signals a dovish turn.
Bond Yield Spread (UK vs US): A widening spread in favor of the USD is exerting downward pressure on GBPUSD in the medium term.
📈 Technical Outlook (H1 Chart):
Structure: Price has formed a double-top pattern at 1.35598 and 1.35322, with multiple rejections—signaling a weakening bullish momentum after a sustained rally.
EMA 13 – 34 – 89 – 200 Setup: Price is currently testing the EMA89 zone (~1.34854). A clean break below this moving average could accelerate the downside correction.
FVG Zone (Liquidity Pool): The 1.3427 – 1.3457 area offers a potential liquidity sweep and may serve as a springboard for the next bullish leg.
📊 Trade Scenarios:
🔻 Short-Term SELL SCALP:
Entry: 1.3532 – 1.3545
Stop Loss: 1.3565
Take Profit: 1.3485 → 1.3457 → 1.3427
→ Ideal if price fails to hold above recent highs and forms bearish rejection candles.
🔵 BUY ZONE Setup:
Entry: 1.3427 – 1.3440
Stop Loss: 1.3400
Take Profit: 1.3475 → 1.3505 → 1.3535 → 1.3555
→ High-probability entry if price reacts positively to the FVG zone and maintains bullish structure.
📌 Final Thoughts:
GBPUSD is currently in a delicate zone where both technical and macro forces are converging. While the broader trend remains bullish, momentum is slowing. With critical US jobs data due, traders should stay cautious and rely on clear confirmations around key price levels. Maintain strict risk management and look for liquidity-driven moves around FVG zones.

EURUSD – Retracement Expected Before Further UpsideEURUSD – Retracement Expected Before Further Upside
The EURUSD pair has seen strong bullish momentum over the past two days, mainly driven by the weakening U.S. dollar. Last week’s softer-than-expected U.S. Core PCE and PMI data fueled speculation that the Federal Reserve may hold rates steady for longer, weighing on USD sentiment.
However, with upcoming speeches from FOMC members and the Non-Farm Payrolls (NFP) data due later this week, traders may look to take profit or step aside, leading to a short-term retracement before any continuation of the bullish trend.
🔍 Macro & Fundamental Overview:
USD remains under pressure amid declining inflation signals and weakening economic data.
ECB is expected to cut rates, but at a slower pace than the Fed, creating a divergence that supports the Euro in the near term.
Political uncertainties in the EU, including upcoming elections, are worth monitoring.
📉 Technical Analysis:
The medium-term trend remains bullish with EMA 13–34–89–200 aligned to the upside.
Price is currently reacting at the 0.0 FIBO level (1.1420), suggesting a potential pullback.
Key support lies between 1.1345 – 1.1317. If this zone holds, it could serve as a solid base for a bullish continuation.
🧭 Suggested Trade Scenarios:
🔵 BUY ZONE: 1.1317 – 1.1345
SL: 1.1285
TP: 1.1370 → 1.1400 → 1.1420 → 1.1450+
🔻 SELL ZONE (Short-term counter-trade): 1.1418 – 1.1425
SL: 1.1450
TP: 1.1385 → 1.1350 → 1.1320

Fundamental Market Analysis for June 3, 2025 GBPUSDThe GBP/USD pair attracted sellers during Tuesday's Asian session and broke part of a strong overnight move up towards the 1.3560 area, or multi-day peak.
The U.S. Dollar Index (DXY), which tracks the dollar against a basket of currencies, rebounded from a six-week low reached on Monday and proved to be a key factor putting downward pressure on the GBP/USD pair.
In addition, concerns over the deteriorating US fiscal situation and renewed trade tensions between the US and China should help limit USD gains. The British Pound (GBP), on the other hand, may continue to receive support from expectations that the Bank of England (BoE) will take a pause at its next meeting on June 18 and will not rush to cut interest rates further.
Traders may also prefer to wait for the hearing of the Bank of England's monetary policy report in Parliament. Investors will be closely watching comments from Bank of England Governor Andrew Bailey and other members of the Monetary Policy Committee (MPC) for information on the policy outlook, which in turn will influence the GBP exchange rate.
Trading recommendation: SELL 1.3495, SL 1.3595, TP 1.3295

WAVE 3 PEAK OR SETUP FOR A NEW RALLY? XAUUSD PLAN – JUNE 3RD | WAVE 3 PEAK OR SETUP FOR A NEW RALLY?
After a massive $100 rally at the start of the week, gold has begun to pull back — dropping over $30 during the Asia session today. This is likely the end of Wave 3 (the strongest impulse in a 5-wave Elliott structure), as investors lock in profits and await key macro events.
🌍 MACRO & FUNDAMENTAL CONTEXT
A high-stakes call between Trump and Xi Jinping is expected this week, which could reshape short-term trade sentiment.
Investors are moving into cash positions, taking profits after Monday’s surge, and waiting for direction from the upcoming US-China negotiations.
Macro themes remain supportive for volatility: tariff risks, inflation worries, and geopolitical uncertainty.
📉 TECHNICAL OUTLOOK – H2 / H4 / D1
On the higher timeframes (H4 and D1), gold maintains a bullish structure, with EMAs aligned for upside continuation.
On intraday charts (M30–H1), we’re seeing a clean correction, likely to fill the Fair Value Gap (FVG) zone below.
The key BUY zone at 3320–3310 will decide direction:
If it holds: strong long setups.
If it breaks: possible structure shift and deeper downside.
🔑 KEY LEVELS TO WATCH
🟢 BUY ZONE: 3320 – 3318
SL: 3314
TP: 3324 → 3328 → 3332 → 3336 → 3340 → 3344 → 3350 → 3360 → ???
🔴 SELL ZONE: 3388 – 3390
SL: 3394
TP: 3384 → 3380 → 3376 → 3370 → 3366 → 3360 → 3350
📌 FINAL THOUGHTS
“Gold is in a healthy correction after a massive surge. The 3310–3320 zone is crucial. Hold it, and bulls may take over again — break it, and we may see a deeper pullback."
⚠️ Stay cautious ahead of political headlines. Any remarks from the Trump–Xi call could spark aggressive price action.
