USD/JPY - Bullish Channel, Next Targeting 148.95 (23.09.2025)#USDJPY #Forex #Trading #TechnicalAnalysis
USD/JPY is trading within a Bullish Channel Pattern on the 30M chart, holding above the rising trendline support. The pair is bouncing from the support zone (147.50 – 147.70), signaling potential upside continuation.
🔹 Market Structure:
Bullish channel intact with higher highs & higher lows.
Price rejected the support zone and trendline.
Momentum suggests buyers could retest upper channel resistance.
🔹 Key Levels:
Support Zone: 147.50 – 147.70
1st Resistance: 148.58
2nd Resistance: 148.95
📈 Trading Idea:
As long as USD/JPY stays above the support zone, bulls may drive price higher toward 148.58 → 148.95.
⚠️ Invalidation:
A break below 147.50 would weaken the bullish outlook.
“Discipline + Patience = Consistency 🔑”
Fundamental-analysis

Fundamental Market Analysis for September 24, 2025 EURUSDEUR/USD holds near 1.18 amid a mix of more cautious Federal Reserve signals and signs of a gradual recovery in euro area business activity. Markets are pricing the Fed’s first step toward policy easing in a year alongside messages about proceeding carefully, which reduces the dollar’s appeal while Treasury yields remain broadly steady. The euro is supported by fresh flash PMIs: the composite index for the region improved, even if the picture remains uneven across countries. At the same time, the ECB kept rates unchanged at its September meeting and indicated that the pace of any further changes will depend on the inflation path and domestic demand.
In the United States, “fast” indicators point to slower business momentum, while price pressures—still above target—look more contained. This strengthens expectations for a moderate Fed rate-cut cycle by year-end. In this setup, the balance of yield differentials and policy expectations tilts slightly toward the euro, especially if incoming U.S. data continue to confirm cooling growth.
Key risks for EUR/USD buyers are U.S. inflation and employment releases: any upside surprises could revive demand for the dollar. On the euro side, vulnerabilities include German industrial weakness and stagnating new orders. Nevertheless, for the current week the balance of factors looks neutral-to-positive for the pair, supporting tactical buys from the 1.18 area.
Trading recommendation: BUY 1.18050, SL 1.17750, TP 1.18600

iQIYI: bet on recovery or just another illusion?Fundamentally, iQIYI is often called the “Netflix of China.” In recent years, it has faced heavy pressure from high debt levels, fierce competition from Tencent Video and Bilibili, and slower growth in the Chinese domestic market. However, recent earnings reports show positive shifts: a growing subscriber base, higher ARPU (average revenue per user), and reduced operating losses. With government support for the tech and entertainment sector and signs of consumer recovery, iQIYI has a real chance to strengthen in the mid to long term. If subscriber growth and cost control continue, the company’s market cap could start to recover, making current levels attractive for medium-term investors.
Technically, the stock still trades below the 200 EMA, showing ongoing seller pressure. The key support zone is $2.30–2.40, and holding this area keeps the bullish scenario alive with targets at $3.40 and $5.25. A longer-term recovery could extend toward $10.40, but only if a sustainable uptrend is confirmed. Losing $2.30 would invalidate the bullish case and expose downside toward $1.60–1.80.
This is one of those situations where market expectations diverge from reality. Optimism makes a reversal seem near, but as always, emotions must be put aside — we wait for clear technical signals before entering.

USDX: demand zone holds but downside pressure remainsThe US dollar index remains under pressure, trading within a descending channel. The recent bounce from the support zone around 96.30–96.90 stalled at the EMAs and the supply zone near 98.30–98.60, where sellers reappeared. On the 4H chart, price has failed to sustain above 97.80, keeping the bearish scenario in play.
It is also important to note that the index is trading below the 200 EMA, reinforcing the bearish bias and signaling that sustainable recovery is less likely without strong fundamental catalysts.
If 96.90 breaks, the next downside target is 96.30, followed by 95.40. Stronger bearish momentum could even push the index toward 94.00, signaling further dollar weakness. For now, 96.30 acts as the key support barrier.
From a fundamental perspective, the dollar index remains weighed down by expectations of a dovish Fed and lower yields. Any hawkish surprise from Fed officials could lift price back toward 98.50, but the structure still favors bearish continuation.
This is exactly the kind of situation where market expectations diverge from reality, and the longer it lasts the more it feels like a trend reversal is near. But as always, emotions must be set aside — we wait for clear signals, not illusions.

ES (E-mini S&P 500) — Plan for Wed Sep 24Fundamentals (tomorrow, ET)
04:00 Germany IFO Business Climate (often moves European risk tone during London).
10:00 U.S. New Home Sales (Aug) — official Census schedule lists New Residential Sales at 10:00 a.m..
10:30 EIA Weekly Petroleum Status Report (standard time each Wed).
13:00 U.S. 5-Year Note auction (can nudge yields/indices).
Context: Yesterday’s U.S. flash PMIs showed slower but still-expanding activity (Composite 53.6 vs 54.6 Aug).
Bias(HTF→LTF)
HTF: Uptrend but near prior highs; Tuesday printed a lower-timeframe selloff into ~6,701–6,705 (confluence with D1 1.272 ≈ 6,705).
Base case into London: Two-way trade inside 6,701–6,744–6,756 triad while Europe digests IFO.
Two paths for NY:
Acceptance ↑ above 6,756.5 → squeeze the weak-highs toward 6,765–6,770, then 6,798–6,800 (D1 1.618).
Acceptance ↓ below 6,701–6,705 → trend rotation toward 6,690s → 6,680s (next liquidity shelves).
London session game plan
If Europe pushes up early: Watch 6,744. Failure there → rotate back to 6,711–6,718; clean reclaim → sets NY for a 6,756 test.
If Europe bleeds down: Look for sweep & hold behavior at 6,701–6,705; loss of that area on 15m body-through tends to trend extend into the 6,69x/6,68x shelves before NY AM.
NY AM (09:30–11:00 ET) and NY PM (13:30–16:00 ET) → full size, run the exact confirmations and targets I gave.
A++ Acceptance LONG — above 6,756.5
Confirmations (15/5/1):
• 15m full-body close above 6,756.5 (acceptance).
• 5m pullback holds ≥ 6,754–6,756 and re-closes up.
• 1m HL entry on first clean re-trigger.
Entry: 6,756–6,758 on the retest (or continuation >6,760 after 5m re-close).
Hard SL: below the 15m trigger wick or < 6,744 by 0.25–0.50 pt (whichever is lower).
Targets: TP1 6,765–6,770, TP2 6,798–6,800, TP3 6,901.
Management: No partials before TP1; at TP1 close 70%, set 30% runner to BE; no trail before TP2. Time-stop 45–60m if neither TP1 nor SL hits. Max 2 attempts at this level.
Invalidation: 15m close back inside < 6,756 after entry that fails the 5m hold → cancel and reassess.
=============
A++ Acceptance SHORT — below 6,701–6,705
Confirmations (15/5/1):
• 15m full-body close below 6,701 (body-through the band).
• 5m LH + re-close down on the retest of 6,701–6,705.
• 1m LH entry on first pullback failure.
Entry: 6,699–6,703 on the retest.
Hard SL: above the 15m trigger wick or > 6,705 by 0.25–0.50 pt (whichever is higher).
Targets: TP1 6,690–6,692, TP2 6,680–6,685, TP3 trail if trend accelerates.
Management: Same rules as Setup #1 (TP1 70% + runner to BE; 45–60m time-stop; max 2 attempts).
Invalidation: Reclaim on 15m back above 6,705 that holds → cancel the short.
⸻
Risk & timing notes
• 10:00 New Home Sales and 10:30 EIA can cause abrupt spikes; favor entries after the first post-data 5m bar closes unless already in with cushion.
• 13:00 5-Year auction can alter yield curve into the NY PM window; manage runners.

Gold (Sep 22–26): Can Bulls Defend $3,700 as ETF Inflows Slow?1. Institutional Forecast Updates
Goldman Sachs (Sep 4, 2025): Targets $3,700/oz for Q4 2025 and $4,000/oz for Q2 2026.
J.P. Morgan (Apr 22, 2025): Projects $3,650/oz for Q4 2025 and sees prices above $4,000/oz by Q2 2026.
References:
www.reuters.com
www.reuters.com
2. Key Drivers & Risks
🟪 Gold ETF flows: Gold-backed ETF inflows surged in 2025, but high prices have caused those inflows to slow.
🟧 Central Bank Statistics: Central bank demand increased in 2025, but they largely held their reserves with little buying or selling.
🟨 Markets are anticipating further Fed rate cuts, which would lower real interest rates and reduce the opportunity cost of holding gold.
🟩 Political and geopolitical tensions have eased recently, with no new developments providing additional support for gold prices.
🟦 The economic environment appears stable (the S&P 500 VIX is currently low), which could shift capital toward higher-risk markets.
⇨ There are no clear signs of a sustained decline in gold prices, but caution is advised around the $3,700/oz level, as institutional inflows are weakening and downside risks are present.
Source: World Gold Council
3. 🏦📊 Technical Analysis
* Trend: assessed using at least three trend indicators, with market structure as the primary guide.
** Weak or Reversal Signals: Assessed based on one of our criteria for trend reversal signals.
*** Support/Resistance: Selected from multiple factors – static (Swing High, Swing Low, etc.), dynamic (EMA, MA, etc.), psychological (Fibonacci, RSI, etc.) – and determined based on the trader’s discretion.
**** Our advice takes into account all factors, including both fundamental and technical analysis. It is not intended as a profit target. We hope it can serve as a reference to help you trade more effectively. This advice is for informational purposes only and we assume no responsibility for any trading results based on it.
How do you think about this idea? Let us know your thoughts below :)

Fundamental Market Analysis for September 23, 2025 USDJPYThe key fundamental driver remains unchanged: the yield and rate gap between the US and Japan, where the Bank of Japan maintains ultra-loose policy while the US supports relatively high yields, systematically supporting long USD positions against the yen. In quiet periods, carry trade mechanics work stably, and occasional verbal interventions from Tokyo usually have short-lived effect without trend base changes absent central bank policy shifts. On this background, even after pullbacks, the pair tends to resume gains reflecting yield premium and global USD demand amid strengthening US macro data.
News assessments on EURUSD and market sentiment highlight high USD sensitivity to inflation and labor data releases, which, upon strong data, usually translates into USDJPY gains via the UST curve. With ECB holding rates and markets expecting Fed easing later, short-term USD fluctuations are often data surprise-driven, while yen remains the "weak link" due to BOJ policy. Therefore, an entry near 147.800 is justified for tactical buying with controlled risk until signs of sustained policy shifts in Tokyo or sharp US yield drops emerge.
Current cross rates through EUR confirm the USDJPY calculated target near 147.800 for today's session, consistent with entry choice at 147.800 for carry-support continuation scenario. Risk management implies a tight stop within 0.20 given possible short-term volatility on news and comments from Japanese officials. The target around 148.800 reflects gradual advance amid sustaining divergence in US-Japan monetary regimes.
Trading recommendation: BUY 147.800, SL 147.600, TP 148.800

EUR/AUD - Selling Pressure Below 1.7850 (22.09.2025)#EURAUD #Forex #Trading #TechnicalAnalysis
EUR/AUD – Channel Breakout Pattern (30M)
EUR/AUD has broken below the rising channel, confirming a bearish reversal after completing a Head & Shoulders pattern at the top.
🔹 Market Structure:
Clear rejection from the resistance zone (1.7850 – 1.7860)
Breakdown of the bullish channel support
Head & Shoulders formation adding to bearish momentum
🔹 Key Levels:
1st Support: 1.7715
2nd Support: 1.7710
📉 Trading Idea:
As long as EUR/AUD stays below the channel resistance, selling pressure could drive price toward the support levels.
🎁 Please hit the like button and
🎁 Leave a comment to support for My Post !
Your likes and comments are incredibly motivating and will encourage me to share more analysis with you.
Best Regards, KABHI_TA_TRADING
Thank you.

EURUSD: wedge narrowing with downside targets in sightOn the daily chart, EURUSD has formed a rising wedge pattern, and the current price action indicates readiness for a decline. Attempts to hold above 1.1800 have failed, pressure has increased, and last week’s close can be viewed as a potential false breakout.
The first downside target is at 1.1413, where a strong support level lies. Further targets may shift to 1.0750 and 1.0480 levels that have accumulated significant volume over the past few months. A full breakdown of the wedge would give momentum to the bearish scenario and increase pressure on the euro.
From a fundamental perspective, the picture remains mixed: the 200 EMA capping from above and the sideways movement in the dollar index confirm the likelihood of euro weakness, but every pullback continues to be aggressively bought, preventing a collapse. If the dollar gains additional support from US macroeconomic data or Federal Reserve policy, the bearish scenario will become dominant.

Fundamental Market Analysis for September 22, 2025 GBPUSDThe latest public finance data showed that net borrowing by the public sector reached £18 billion, the highest monthly figure in five years. Economists had expected public borrowing to be significantly lower, at £12.8 billion. Analysts believe that this move threatens to exacerbate the debt burden and increase fiscal risks, which could put some pressure on the pound sterling.
On Thursday, the Bank of England voted to keep interest rates at 4.0% amid uncertain growth prospects and a weakening labor market. This decision was made after the UK central bank last cut its key interest rate by 25 basis points (bps) in August. The Bank of England reiterated that “a gradual and cautious further easing of monetary policy constraints remains appropriate.”
As for the US dollar, last week the US Federal Reserve (Fed) approved a widely expected rate cut and signaled that there would be two more cuts before the end of the year.
Traders will be focusing more on the Fed's statements later on Monday. Comments from Fed officials may provide some clues about the outlook for US interest rates.
Trading recommendation: SELL 1.3430, SL 1.3460, TP 1.3380

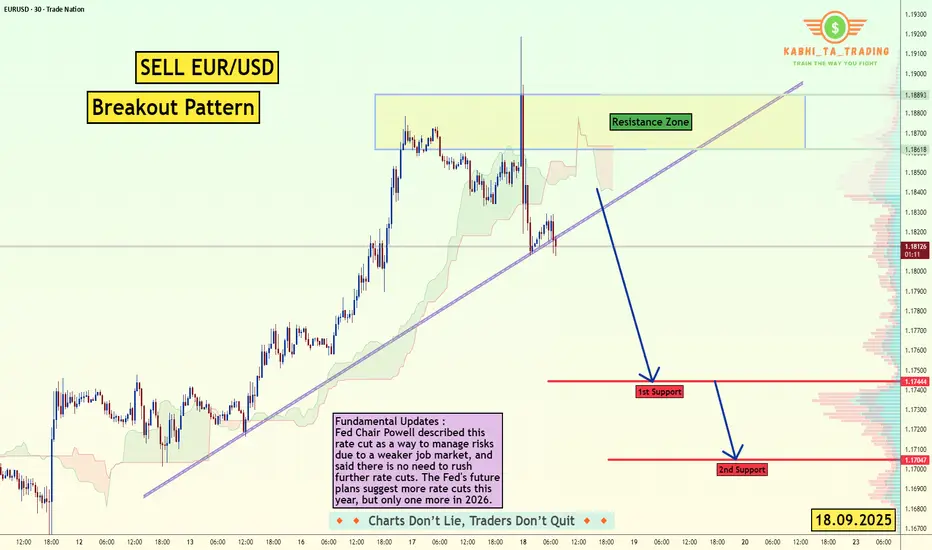
EUR/USD - Fundamental Move (18.09.2025)The EUR/USD Pair on the M30 timeframe presents a Potential Selling Opportunity due to a recent Formation of a Breakout Pattern.
This suggests a shift in momentum towards the downside in the coming hours.
Possible Short Trade:
Entry: Consider Entering A Short Position around Trendline Of The Pattern.
Target Levels:
1st Support – 1.1744
2nd Support – 1.1704
Fundamental Updates :
Fed Chair Powell described this rate cut as a way to manage risks due to a weaker job market, and said there is no need to rush further rate cuts. The Fed's future plans suggest more rate cuts this year, but only one more in 2026.
🎁 Please hit the like button and
🎁 Leave a comment to support for My Post !
Your likes and comments are incredibly motivating and will encourage me to share more analysis with you.
Best Regards, KABHI_TA_TRADING
Thank you.
Fundamental Market Analysis for September 19, 2025 EURUSDThe US Department of Labor (DOL) reported on Thursday that the number of Americans filing new claims for unemployment benefits fell to 231,000 for the week ending September 13. The latest data was lower than the initial estimate of 240,000 and lower than the previous week's figure of 264,000 (revised from 263,000). Meanwhile, the number of people continuing to claim unemployment benefits fell by 7,000 to 1.920 million for the week ending September 6.
The US dollar remains strong after the Federal Reserve (Fed) announced an expected rate cut on Wednesday but did not indicate that it would rush to lower borrowing costs in the coming months.
The decline in the EUR/USD pair may be limited as the euro (EUR) could be supported by growing expectations that the European Central Bank (ECB) will end its cycle of rate cuts after the release of the latest inflation data.
ECB Vice President Luis de Guindos said the central bank should take a “very cautious” approach given the high uncertainty. Guindos added that the current rate is adequate given inflation trends and monetary policy transmission.
Trade recommendation: SELL 1.1735, SL 1.1765, TP 1.1685

Fundamental Market Analysis for September 18, 2025 USDJPYAfter the Fed’s rate cut, the U.S.–Japan yield differential narrowed slightly, supporting the yen and capping USD/JPY. The focus now is on tomorrow’s Bank of Japan meeting: the base case is unchanged policy settings, with heightened attention to assessments of inflation and wages as well as comments on the balance of risks over the coming months.
Even without immediate BoJ steps, expectations of further normalization of monetary policy in Japan later this year periodically boost demand for the yen. At the same time, the dollar enjoys short-term support after the Fed decision, though it is constrained by messaging about a gradual approach going forward, which limits the potential for a sustained rise in the pair.
Overall, the balance of factors tilts toward a tactical decline in USD/JPY, while warranting caution given the pair’s sensitivity to BoJ communication and U.S. yield dynamics. Selling with a moderate stop-loss and a conservative target is preferred.
Trade recommendation: SELL 146.900, SL 147.400, TP 146.000

HINO📊 HINO (PSX) Analysis (One can also buy on current market price)
🔎 Fundamentals
🚌 Buses & Trucks: Orders surged 80% 🚀
💰 Undervalued Price → Attractive entry point for long-term investors
📈 Earnings Growth: EPS improved to 4.67 ✅
🤝 MFTBC (Mitsubishi Fuso Truck & Bus Corp.) agreement with HINO → backed by a 100% publicly listed global player 🌍
📉 Technicals
📍 3 Accumulation Areas → Strong buying interest spotted
📊 Trendline Break (Daily) → Closed at 562 → ✅ Buy Signal
🔄 Support Bounce: Price moves in the 562–582 range → Ideal Buy Zone
⚡ If Support Breaks: Next attractive Buy Zone → 360–390
Note: (One can also buy on current market price)

Fundamental Market Analysis for September 17, 2025 GBPUSDThe pound is supported by sticky domestic inflation: in July, the index accelerated to 3.8% y/y, and releases and commentary point to the risk of sustained high inflation, forcing the Bank of England to act cautiously in easing pace and maintaining a premium on UK yields.
The scenario of a 25 bps Fed rate cut today sets a softer external backdrop for USD and narrows the yield differential in favor of GBP, boosting inflows into sterling assets on expectations that the BoE will signal slower easing ahead given persistent price pressures.
Market ranges for GBPUSD in recent weeks concentrated around 1.35000–1.36000, which is confirmed by price behavior and news flow, aligning the chosen trade levels with current spot values and fundamental drivers.
Additionally, market participants monitor U.S. developments: ahead of the Fed meeting the dollar index declined and equities traded cautiously, reflecting near‑full pricing of a 25 bps cut and the search for dovish hints in the statement, which, if confirmed, strengthens the case for pound appreciation.
The risk balance for GBP is also supported by the fact that the BoE has eased gradually before and may prefer a pause if service inflation accelerates, maintaining sterling’s appeal relative to currencies with faster rate cuts.
Trade recommendation: GBPUSD: BUY 1.36500, SL 1.36300, TP 1.37500

Sanghvi Movers growth story unfolds"Sanghvi Movers: A Strong Stock!
Fundamentally strong company growing with good profits and cash flow. Range breakout done with volume and RSI above 60.
Targets:
1. ₹450
2. ₹575
3. ₹700 (100% return)
Best investment opportunity!"

Fundamental Market Analysis for September 16, 2025 EURUSDThe euro is gaining support against other currencies thanks to comments from the European Central Bank (ECB). European Central Bank (ECB) board member Isabel Schnabel said on Tuesday that interest rates in the eurozone are at a good level, adding that risks of inflation remain prevalent. Schnabel said growth is likely to exceed potential as domestic demand offsets the decline in exports.
ECB board member Peter Kazimir said on Monday that policy should not be adjusted due to “minor deviations” from the inflation target, while warning of the risks of rising inflation. Kazimir added that interest rates had been brought to a neutral level.
The EUR/USD rose as the US dollar (USD) weakened on growing expectations that the Federal Reserve (Fed) would cut rates by 25 basis points at its September meeting on Wednesday. Markets also see the likelihood of a more significant 50 basis point cut as low, while anticipating continued policy easing through 2026 to counter the risk of recession.
Trade recommendation: BUY 1.1805, SL 1.1770, TP 1.1860

USD/CAD - Bearish Flag (15.09.2025)The USD/CAD Pair on the M30 timeframe presents a Potential Selling Opportunity due to a recent Formation of a Bearish Flag Pattern. TRADENATION:USDCAD
This suggests a shift in momentum towards the downside in the coming hours.
Possible Short Trade:
Entry: Consider Entering A Short Position around Trendline Of The Pattern.
Target Levels:
1st Support – 1.3814
2nd Support – 1.3796
🎁 Please hit the like button and
🎁 Leave a comment to support for My Post !
Your likes and comments are incredibly motivating and will encourage me to share more analysis with you.
Best Regards, KABHI_TA_TRADING
Thank you.

Fundamental Market Analysis for September 15, 2025 USDJPYThe pair trades around 147.4. Last week the yen firmed after political headlines from Tokyo: the prime minister’s resignation increased uncertainty and supported safe-haven demand for JPY. At the same time, US yields pulled back on softer labor data and a mild PPI, narrowing the rate differential in the dollar’s favor.
On Japan’s side, debate has revived about further BoJ normalization as wages rise and inflation stabilizes. Even if the BoJ leaves settings unchanged at the next meeting, the risk balance is shifting from one-sidedly dovish toward more neutral, which limits USD/JPY upside as a Fed cut appears likely.
The combination of a prospective Fed cut on Wednesday and elevated political noise in Japan makes further downside drift plausible. We prefer selling at 147.500 with a 146.000 target and a 148.500 stop. A “hawkish” Fed reaction and/or an ultra-cautious BoJ could push the pair back toward 148+.
Trading recommendation: SELL 147.500, SL 148.500, TP 146.000

fed press confrencehere to share an idea and show a road , on 17th the press is gonna decide where the markets will be going towards and probably on the next monday im expecting to see another gap on the CME chart which the market will tend to fill it where when how i dont know but based on my experience and expectation there will be another cme gap created in the upcoming weeks , certainly saying and claiming that the BTC price will get pumped or dumped is not really a professional way to look at the markets im expecting to see a 135k to 160k btc on new years eve but these again are just expectations.
thank you for reading this if it was helpful
leave your impression that would help my account to reach more people and help them to understand the markets better

Fundamental Market Analysis for September 12, 2025 GBPUSDThe pound is trading near 1.35500 amid a weak dollar and expectations that the Bank of England will keep rates unchanged on September 18. The market highly values the likelihood of a pause, as wage growth and persistent “hard core” service inflation are keeping the regulator from easing anytime soon. This supports the interest rate differential in favor of the GBP against the dollar in the coming weeks.
The US, in turn, is providing additional tailwinds through growing signs of a weakening labor market and easing inflationary pressures in segments relevant to PCE. Risk appetite remains strong, which is combined with investor caution towards the long dollar ahead of the Fed meeting. Political and fiscal risks exist in the UK, but in the short term, they are secondary to the monetary agenda.
Based on the fundamental balance, the base scenario is to buy with careful money management: BUY 1.35550, SL 1.35150 (below the nearest macro news “risk threshold”), TP 1.36250 — provided that the Fed/BoE rhetoric remains moderately dovish and there are no surprises on inflation.
Trading recommendation: BUY 1.35550, SL 1.35150, TP 1.36250

If gold stays above 3,585 and breaks 3,680, it could target 3,70 External News Factors
Gold is supported by expectations of a Fed rate cut in September, which continues to drive safe-haven inflows.
Additionally, geopolitical tensions (Russia–Ukraine, Middle East) and concerns over the U.S. debt crisis (interest payments surpassing $1.1 trillion, fiscal deficit nearing $2 trillion) further strengthen gold’s bullish momentum.
The U.S. dollar is showing slight weakness, adding more fuel to gold’s upside.
Overall Trend
Gold (XAU/USD) is in a strong uptrend, clearly shown by the steep rally from the support area around ~3,420 USD.
Price has already broken through several key Fibonacci retracement levels and is now testing the upper resistance zone (~3,650 – 3,680 USD).
Key Support and Resistance
Main Resistance: 3,650 – 3,681 USD (red zone on the chart). This is a strong supply zone where price is consolidating.
Nearest Support: Around 3,585 – 3,517 USD (Fibo 0.786 and 0.618 levels).
Major Support: 3,420 USD (aligned with Fibo 0.382 and the previous consolidation area marked “SUPPORT”).
Price Pattern
Within the resistance zone, price is showing signs of forming a triangle/sideways accumulation pattern.
A breakout to the upside could confirm a continuation pattern (trend continuation).
Trade Scenarios
Bullish Scenario (preferred): If gold holds above 3,585 and breaks through 3,680, the next target would be the psychological level of 3,700 – 3,720 USD.
Bearish/Correction Scenario: If price fails to hold 3,585, it could retrace deeper to 3,517 or even 3,420 before buyers step in again.
👉 In summary: The main trend remains bullish. Gold needs to consolidate and decisively break above 3,680 to aim for 3,700+. If it fails, a pullback towards 3,585 – 3,517 is likely before another buying opportunity.

Fundamental analysisFundamental analysis is a method of evaluating the intrinsic value of a financial asset by analyzing economic, financial, and geopolitical factors that influence its price.
It’s the opposite of technical analysis, which focuses on charts and price patterns. Instead, fundamental analysis looks at the "why" behind price moves.
