Silver pump vs the Algo - Who will win?COMEX:SI1! COMEX_MINI:SIL1! TVC:SILVER
The algorithm has reached a terminal exhaustion state at the 4.0 Standard Deviation Macro-Extension effectively completing the parabolic expansion cycle initiated from the 2024 lows.
The current price action represents a 'Distribution Node' at the 60.00 psychological event horizon where the Smart Money is actively offloading inventory into late retail buyers before initiating a high-velocity repricing event to the 54.020 algorithmic equilibrium.
Entry: 58.850 (Market Execution / Sell Limit)
Stop loss: 60.150 (1.300 points)
Take profit: 54.020 (4.830 points)
Risk to reward ratio: 3.71R
The Opportunity
The Monthly chart reveals the absolute truth: Price has struck the 4.0 Standard Deviation projection. In the realm of IPDA, this is the 'Statistical Extremity'—a zone where the probability of continued vertical expansion collapses to near zero and the probability of a mean reversion increases exponentially.
The market has left a massive 'Liquidity Void' between 54.00 and 58.00. This is not structural support; it is thin air. The algorithm abhors this vacuum. The 54.020 level identified is not merely a support level; it is the 'Fair Value' origin of the final impulse leg. The market must return here to close the circuit and validate the breakout.
The Entry
Entering short at the 58.850 region capitalizes on the 'bull trap' formed by the failure to displace above 59.50. The 8-hour chart shows a loss of momentum and the formation of a 'Rounded Top' distribution profile.
The algorithm is currently holding price up solely to induce 'Fear of Missing Out' (FOMO) longs. Once the Asian/London liquidity is swept, the floor will be removed, and the price will seek the path of least resistance: down through the vacuum.
The Invalidation
The bearish causal chain is ontologically corrupted if price achieves a daily close above the 60.150 Omega Point.
A breach of this level would imply that the market has entered a 'Hyper-Inflationary' discovery mode, ignoring standard deviation constraints.
This would shift the probability manifold to the Primary Antithetical Chain targeting the 62.00-65.00 vector.
Key Trajectory Waypoints
Target 1: 57.200 | Type: Immediate Structural Low | Probability: 85% | ETA: 24-48 Hours
Target 2: 55.500 | Type: 1.5 SD / Mid-Void | Probability: 70% | ETA: End of Week
Target 3: 54.020 | Type: The Great Rebalance | Probability: 55% | ETA: 1-2 Weeks
The Shadow Reality
A 20% probability exists for the antithetical reality: The Flag Continuation.
In this scenario, the 58.00 level acts as a 'High Tight Flag' support, and the market consolidates sideways to burn time before one final thrust to 61.00.
This reality is confirmed if price refuses to trade below 57.80 for 48 hours.
Future

Future Nearing.Been peeped Silver since 2023, watch as price rally above $42 soon. Especially with Gold topping out above $3K. The future, full of robotics and humanoids, is nearing. Who’s ready? Who’s scared? Who’s taking advantage of this opportunity?
Whatever happens, do not fomo, stay calculated.

Nasdaq reversa 6-11-25Sellers were absorbed in that area, and the Nasdaq will likely reverse from this point in the coming days.
If it breaks through the supply zone, the trend could turn bullish in the next few days.

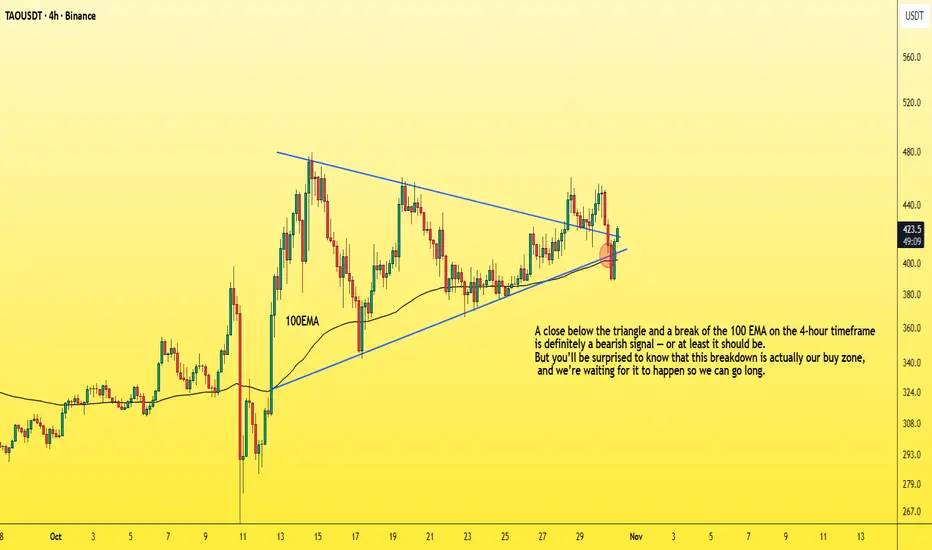
How to enter a successful futures tradeDrop everything and let me show you how to enter a successful long position with the lowest possible risk.
You need to understand that the market maker usually acts against us at major support areas on the chart — like the 100 EMA, 0.618 Fibonacci level, or a trendline.
To make this clearer, let’s take TAO as an example and I’ll explain why.
TAO has strong momentum and a large market cap,
so don’t apply what I’m about to say to meme coins, for example.
Now let’s go step by step on how to enter a futures position after choosing the coin 👇
1. First, wait for a bullish pattern to form — like a triangle — and for the coin to break it upwards with increasing long momentum.
2. The price will then retest the trendline, encouraging people to enter with larger positions, and those who missed the first breakout will likely place buy orders at the retest zone.
3. Then, the market surprises them — it drops back inside the triangle, giving a small bounce at the lower side.
4. But it doesn’t stop there — it continues dropping, breaking below the triangle and closing below the 100 EMA on the 4-hour chart.
This makes you panic and close your long position.
Others start entering shorts thinking it’s a real breakdown.
5. That’s when the market reverses sharply upward,
trapping short traders in losses,
while long traders who exited too early also lose.
In the end, only those who placed buy orders slightly below the strong support level (not directly on it, like under the 100 EMA) — and of course the market maker — end up winning.
So basically, the long traders lose, the short traders lose,
and only a small percentage of smart traders and the market maker win.
Small things to pay attention to 👇
-Your entry point should be slightly below the support, not too far below it.
(That support could be the 100 EMA, below the triangle pattern, or the 0.618 Fibonacci level, as we mentioned.)
-Don’t use high leverage — x5 should be your maximum.
-Place your stop loss 5% below your entry zone,
which equals about 25% loss if you’re using x5 leverage.
And with that, you’ve got yourself a long setup with over a 90% success rate,
and you can apply the same logic in reverse when taking a short position.
Best Regards:
Ceciliones🎯
Trump & The Eighth (8): The Millennium S&P500 Long Deal!For friends and Donald Trump the Magnificent (Trump).
Friends, based on analysis of data from the S&P 500 index, Trump's visible activity, and the Federal Reserve's aggressive interest rate cutting cycle - the conclusion is obvious. The US economy, and therefore the global economy, is transitioning from stagnation to recession. Consequently, the S&P 500 will first enter a correction, then experience a severe crash in 2026.
However, there exists an algorithm that can soften this collapse and save the global economy. This is the exact algorithm Trump intends to execute through a deal with Russia, achieved via a Russia-Ukraine ceasefire. This must become more than a temporary truce - it must be peace for generations to come.
To save millions of lives, to rescue the global economy and US markets, the Eighth (8) will come:
The Eighth (8) - the man who, through agreements with both Putin and Trump, will provide security guarantees and immunity for Putin, his inner circle, and their capital.
The Eighth (8) will sign a peace agreement with Zelenskyy based on a 50-year lease of territories along the current front lines. Using unfrozen Russian sovereign assets, he will restore both Russian and Ukrainian territories and pay all due compensations to victims' families.
The Eighth (8) will make a deal with Trump ensuring complete cooperation, mutual understanding, and prosperity for Russia, Ukraine, and the United States.
These three steps will enable comprehensive resolution of both regional and international issues, which in turn will sustain the global economy and US market indices.
Best regards,
VinterFrank (8)

HOW to USE OB After Liq sweept on daily bais CME_MINI:MNQ1!
After we took PDL we Choch on 1H
and 5 min ob appear for more push

US30: Flash pump not enough to break resistanceSPREADEX:DJI Analysis – Weak flash pump signals a possible pullback ahead.
📊 Technical Overview
On the 30-minute timeframe, Wall Street (US30) has recently shown a quick rebound — a flash pump — after a strong flash dump earlier in the week. Price is now trading near the 46,400 – 46,500 area, right below the major resistance zone between 46,600 – 46,750 (highlighted in green).
Below, the support range around 46,050 – 46,200 (marked in red) remains the key demand area.
⚙️ Market Structure Insight
The recent flash pump recovered quickly from the previous drop, but the momentum appears insufficient to break through the prior flash dump zone. This imbalance often indicates a short-term exhaustion in buying pressure, meaning the market could need one more corrective leg before finding new strength.
🧭 Main Scenario
The most likely scenario is that price will move sideways or slightly pull back toward the 46,200 support zone before deciding its next major move.
• If buyers defend 46,200 successfully, the index could attempt another test of 46,700.
• However, failure to hold that support might open the door to a deeper correction.
💡 Personal View
The weak flash pump following the previous flash dump signals that the market is still in a consolidation and absorption phase. A short-term pullback could help reset momentum before a more sustainable trend emerges.
⛔ This analysis represents a personal technical perspective and should not be taken as investment advice. Always manage your risk before entering any position.
Please like and comment below to support our traders. Your reactions will motivate us to do more analysis in the future 🙏✨
Harry Andrew @ ZuperView

NASDAQ Faces Downside Risk Amid Tariff and Shutdown UncertaintyUSNAS100 – Technical Outlook Aligned with Fundamentals
The Nasdaq 100 fell sharply on Friday, losing nearly 1,200 points within six hours as it retreated from its all-time high.
The drop came amid renewed U.S.–China tariff tensions and growing uncertainty from the ongoing U.S. government shutdown, which has delayed key economic data releases and weighed on sentiment ahead of third-quarter earnings season.
Technically, the index is showing clear bearish pressure, and sellers will likely maintain control while the price remains below 23,930.
A short-term corrective rebound toward 24,160 – 24,350 is possible before renewed downside momentum.
If the price closes a 1H or 4H candle below 23,930, it would confirm a continuation of the bearish trend, opening the way toward 23,700 → 23,500 → 23,350.
Conversely, as long as the index trades above 23,930, limited corrections may occur, but overall bias remains weak under current macro headwinds.
Pivot Line: 23,930
Support Levels: 23,700 / 23,500 / 23,350
Resistance Levels: 24,160 / 24,340 / 24,480
Summary:
Fundamental headwinds — from tariff threats to the shutdown’s data vacuum — are fueling pressure on tech stocks.
Technically, bias stays bearish below 23,930, with a potential correction toward 24,350 before continuation to the downside.

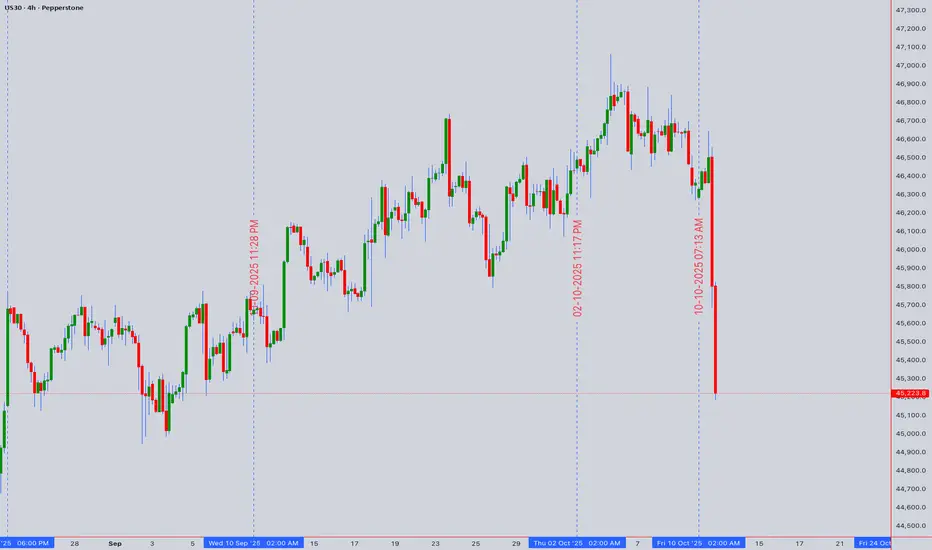
US30 (DOW30) At a Critical Juncture Amid Distribution Signs
The US30 consolidates near its all-time high of 45,223.8, showing early signs of exhaustion. Our multi-faceted analysis suggests a pivotal moment is at hand, with a bearish bias for the short term. The key level to watch is the recent high at 45,250, which is acting as a formidable resistance.
Intraday Trading Strategy (5M - 4H Charts)
Bearish Scenario: A rejection from the 45,150 - 45,250 resistance zone, confirmed by a bearish candlestick pattern (like a bearish engulfing) on the 1H chart, signals a short opportunity. Initial target is the 44,900 support (recent swing low), followed by 44,750. Use a tight stop above 45,300. The 1H RSI showing divergence and price action below the VWAP support this move.
Bullish Scenario: A decisive 4H close above 45,250 invalidates the immediate bearish outlook and could trigger a momentum buy. The target would then be an uncharted rally towards 45,500. However, low volume on any breakout would signal a potential bull trap.
Swing Trading Outlook (4H - Daily Charts)
The larger picture reveals a market potentially in a Wyckoff distribution phase. The failure to sustain new highs, coupled with rising volume on downswings, points to smart money distributing shares. An Elliott Wave count suggests we may be in a final Wave 5 extension or have completed it, priming for a larger corrective (ABC) pullback.
Swing Sell: A daily close below the key support at 44,500 would confirm a shift in medium-term momentum, opening targets down to 43,800 (50-day EMA and a significant psychological level).
Swing Buy: A sustained hold above 45,250, supported by strong volume and a bullish RSI crossover on the daily chart, would delay the bearish count and target new highs.
Key Technical Rationale:
RSI Divergence: The daily RSI is forming a bearish divergence against the higher price highs, indicating weakening momentum.
VWAP & Volume: Anchored VWAP from the last significant low shows price is extended. Recent up-moves appear on weaker volume, characteristic of a weak bullish trend.
Gann & Ichimoku: Price is trading at the upper range of a Gann square, suggesting a potential reversal zone. The Ichimoku Cloud on the 4H is thin, offering little dynamic support below 44,800.
Market Context: Geopolitical tensions and political uncertainty are injectting volatility, making risk assets like the DJI susceptible to sharp pullbacks. Traders should remain agile.
Disclaimer: This is technical analysis, not financial advice. Always use stop-losses and manage your risk accordingly.
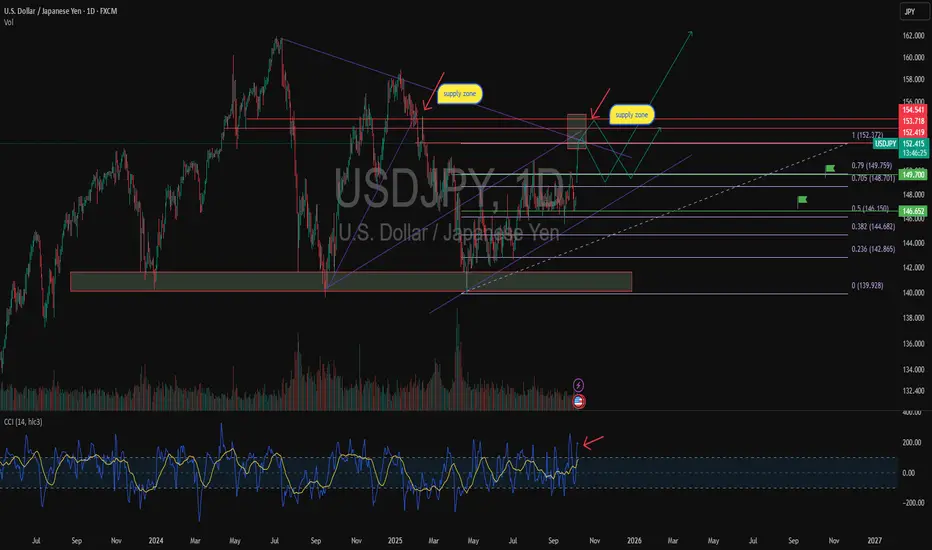
USDJPY: CCI divergence and pullback from supply zoneUSDJPY forms a bearish divergence on the CCI indicator (4H chart), signaling a potential loss of momentum. The pair is testing the supply zone 153.70–154.50, where large players previously took profits.
A confirmed reversal could lead to a decline toward 152.00 → 149.70 → 146.65, aligning with Smart Money structure and liquidity zones.
Fundamentally, the yen may strengthen amid possible Bank of Japan interventions and stabilizing U.S. bond yields.
The USD remains fundamentally strong due to rate differentials but is short-term overbought.
Bearish CCI divergence and approach to a key supply zone suggest a potential correction lower.
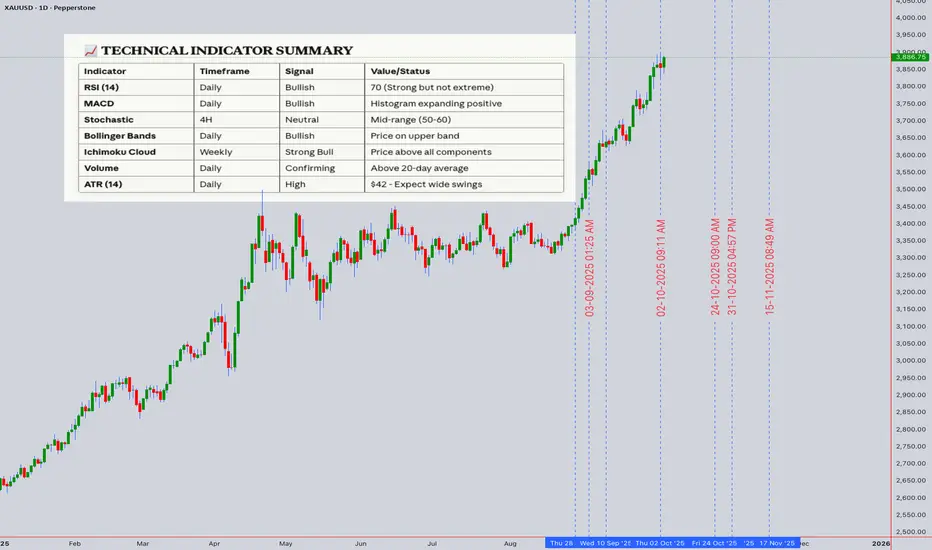
XAUUSD (Gold) Technical Analysis & Trading ForecastXAUUSD (Gold) Technical Analysis & Trading Forecast
Current Price: $3,886.75 | Date: October 4, 2025, 12:54 AM UTC+4
Executive Summary
Gold is trading at historic levels above $3,880, reflecting strong safe-haven demand amid ongoing geopolitical tensions and potential monetary policy shifts. The asset is currently testing critical resistance zones while maintaining bullish momentum across multiple timeframes. Both intraday and swing traders should monitor key technical levels for optimal entry and exit strategies.
Multi-Timeframe Technical Analysis
Monthly & Weekly Perspective (Swing Trading)
Gold has experienced significant appreciation in 2025, with the current price action suggesting a continuation of the long-term uptrend that began in late 2022. Monthly charts reveal:
Elliott Wave Analysis: Gold appears to be in Wave 5 of a major impulse sequence, targeting the $4,000-$4,200 zone based on Fibonacci extensions from previous wave structures.
Ichimoku Cloud (Monthly): Price is trading well above the cloud with bullish Tenkan/Kijun cross, confirming strong trend strength. The cloud ahead remains thin, suggesting limited resistance until $4,050.
Gann Analysis: Using the Square of 9 methodology from the 2020 low ($1,450), the current price aligns with the 315-degree angle, projecting next major resistance at $4,015 (360-degree completion) and $4,180 (next 45-degree increment).
Key Weekly Support/Resistance Levels:
Major Resistance: $3,920, $4,015, $4,180
Primary Support: $3,850, $3,765, $3,680
Critical Support: $3,580 (weekly 50 EMA)
Daily Chart Analysis
Candlestick Patterns: The recent price action shows a series of bullish engulfing patterns following pullbacks, indicating strong buying pressure at lower levels.
Wyckoff Analysis: The current phase suggests we are in a re-accumulation schematic, with recent consolidation between $3,850-$3,920 representing a potential spring or test before continuation to higher targets.
Harmonic Patterns: A bullish Gartley pattern completed at $3,765, projecting targets at $3,950 (0.618 retracement) and $4,050 (1.272 extension).
RSI (Daily): Currently at 68, approaching overbought territory but not yet extreme. Historical analysis shows gold can sustain RSI above 70 for extended periods during strong trends.
Bollinger Bands: Price is riding the upper band, with bandwidth expansion indicating increasing volatility. The middle band at $3,820 serves as dynamic support.
Moving Averages:
20 EMA: $3,842 (immediate support)
50 EMA: $3,765 (critical support)
200 EMA: $3,580 (long-term trend confirmation)
Golden Cross remains intact with 50 EMA well above 200 EMA
Intraday Trading Strategy (Next 5 Trading Days)
4-Hour Chart Setup
Current Structure: Gold is forming an ascending triangle pattern with resistance at $3,920 and rising support trend line from $3,765.
VWAP Analysis: Anchored VWAP from October 1st stands at $3,872. Price trading above indicates bullish control. Volume profile shows high volume node at $3,860-$3,870, serving as magnetic support zone.
Scenario 1 - Bullish Breakout:
Entry: Break and close above $3,920 on 4H chart with strong volume
Target 1: $3,965 (measured move from triangle)
Target 2: $4,015 (Gann resistance)
Target 3: $4,050 (Harmonic target)
Stop Loss: $3,875 (below VWAP and triangle support)
Risk/Reward: 1:3
Scenario 2 - Retracement Play:
Entry: Pullback to $3,850-$3,860 zone with bullish reversal candle
Target 1: $3,900
Target 2: $3,920 (triangle resistance)
Stop Loss: $3,830 (below 20 EMA on 4H)
Risk/Reward: 1:2.5
1-Hour Chart Tactical Levels
Immediate Resistance Zones:
$3,900-$3,905 (prior consolidation area)
$3,920-$3,925 (major resistance cluster)
$3,950 (psychological level)
Immediate Support Zones:
$3,872-$3,875 (VWAP & prior resistance turned support)
$3,860-$3,865 (high volume node)
$3,850 (minor swing low)
RSI (1H): Currently 58, neutral zone with room to move higher. Watch for bullish divergence on pullbacks.
Bollinger Bands (1H): Price oscillating between middle and upper band. Squeeze conditions suggest potential breakout imminent.
15-Minute & 5-Minute Scalping Strategy
Best Trading Sessions: London open (08:00-12:00 UTC+4) and US open (15:30-19:30 UTC+4) for highest volatility and volume.
Entry Criteria:
Price must be above 15-min 50 EMA for long entries
RSI pullback to 40-50 zone followed by bullish momentum surge
Volume confirmation (above 20-period VWMA)
Scalping Levels (Valid for next 5 days):
Buy Zone: $3,875-$3,885 (quick 10-15 point targets)
Sell Zone: $3,915-$3,925 (if rejection occurs)
Stop Loss: Maximum 20 points ($200/contract)
Target: 15-25 points ($150-$250/contract)
Pattern Recognition: Watch for bull flags on 15-minute chart during uptrends as continuation patterns, typically resolving within 3-6 candles.
Swing Trading Strategy (1-4 Week Horizon)
Primary Swing Setup - Long Position
Entry Strategy:
Preferred Entry: $3,850-$3,870 on any weekly pullback
Aggressive Entry: Current levels with wider stop
Conservative Entry: Wait for daily close above $3,920
Position Sizing: Allocate only 30-40% of capital initially, scaling in at lower levels if opportunity presents.
Target Zones:
Target 1: $4,015 (15% position exit) - Gann resistance
Target 2: $4,180 (35% position exit) - Elliott Wave projection
Target 3: $4,350 (30% position exit) - 1.618 Fibonacci extension
Runner: Hold remaining position with trailing stop
Stop Loss Management:
Initial Stop: $3,765 (below daily 50 EMA)
Move to breakeven once Target 1 is reached
Trail stop at previous week's low as price advances
Risk/Reward: Approximately 1:4 from current levels
Alternative Swing Setup - Counter-Trend (Higher Risk)
Entry Trigger: Daily close below $3,850 with increased volume
Short Entry: $3,840-$3,850
Targets: $3,765 (T1), $3,680 (T2)
Stop Loss: $3,920
Note: Only consider if clear reversal pattern forms (bearish engulfing, head and shoulders). Current trend remains bullish.
Pattern & Theory Analysis
Elliott Wave Count
Primary Count:
Wave 1: $1,810 to $2,150 (2023)
Wave 2: $2,150 to $1,990 (correction)
Wave 3: $1,990 to $3,200 (extended wave)
Wave 4: $3,200 to $2,960 (complex correction)
Wave 5: $2,960 to current (potentially targeting $4,200+)
We appear to be in sub-wave 5 of larger Wave 5, suggesting final leg of impulse move approaching.
Harmonic Patterns
Completed Patterns:
Bullish Gartley (completed at $3,765)
Bullish Bat pattern (completed in September at $3,680)
Potential Forming Patterns:
Bullish Butterfly pattern developing with D point potential at $3,750 if retracement occurs
Wyckoff Market Phases
Current analysis suggests Phase D (markup) of re-accumulation schematic. Characteristics observed:
Signs of Strength (SOS): Strong rallies from $3,765 to $3,920
Last Point of Support (LPS): Recent test at $3,850-$3,860
Backup to the edge of creek: Minor pullbacks quickly bought
This suggests institutional accumulation continues with further upside likely.
Gann Time & Price Projections
Time Cycles: Significant Gann time windows approaching:
October 7-9, 2025: 90-degree square from previous major low
October 15-18, 2025: 180-degree opposition, potential reversal or acceleration point
Price Squares:
Square of current price ($3,886) suggests natural resistance at $3,969 (square root progression)
Gann angles from September low project resistance at $3,985
Ichimoku Analysis
Daily Ichimoku:
Price above all cloud components (strongly bullish)
Tenkan-sen (9): $3,868
Kijun-sen (26): $3,845
Senkou Span A: $3,810
Senkou Span B: $3,765
Cloud Interpretation: Thick bullish cloud below price provides strong support cushion. Future cloud remains green, suggesting trend continuation expected.
Trap Scenarios
Bull Trap Risk:
If price breaks above $3,920 but fails to hold and reverses below $3,880 within 24 hours with high volume, this could signal a bull trap
Probability: Low (15-20%) given current fundamental backdrop
Bear Trap Watch:
Any sharp drop below $3,850 that quickly reverses above $3,870 could trap bearish traders
This would likely accelerate the next leg higher
Probability: Moderate (35-40%) if pullback occurs
Volume & Momentum Analysis
Volume Profile:
High volume acceptance between $3,800-$3,900
Point of Control (POC): $3,865
Low volume area above $3,950 suggests potential for rapid movement if breached
VWAP Signals:
Price consistently holding above daily VWAP indicates institutional buying
Weekly VWAP at $3,820 serves as strong support for swing positions
Volume volatility increasing suggests preparing for significant move
RSI Across Timeframes:
5-min: 52 (neutral)
15-min: 58 (bullish lean)
1H: 58 (bullish lean)
4H: 64 (approaching overbought, still healthy)
Daily: 68 (strong but not extreme)
Weekly: 71 (overbought but sustainable in strong trends)
Moving Average Analysis:
All major EMAs in bullish alignment (20>50>200)
No death cross signals on any timeframe
Price trading above 20 EMA on all timeframes except 5-min (normal intraday oscillation)
Market Context & External Factors
Fundamental Backdrop
While this is primarily a technical analysis, traders should be aware that gold's current strength reflects:
Geopolitical tensions that may be supporting safe-haven demand
Central bank policies and potential monetary easing cycles
Currency fluctuations particularly USD weakness
Inflation concerns that typically support precious metals
Key Events to Monitor (Next Week)
Federal Reserve speakers: Any dovish commentary could propel gold higher
Geopolitical developments: Escalation or de-escalation affects safe-haven flows
Economic data: Employment figures, inflation reports can trigger volatility
Dollar Index movements: Inverse correlation with gold typically strong
Recommended Approach: Maintain stop losses below technical support levels regardless of fundamental views. Markets can remain irrational longer than traders can remain solvent.
Risk Management Guidelines
Position Sizing
Intraday Trades:
Risk 0.5-1% of account per trade
Maximum 2-3 concurrent positions
Respect maximum daily loss limit of 2% account value
Swing Trades:
Risk 1-2% of account per position
Scale in across multiple entries if possible
Limit total gold exposure to 10-15% of portfolio
Stop Loss Discipline
Non-Negotiable Rules:
Always set stop loss before entering position
Never move stop loss further from entry (only toward profit)
Exit immediately if stop is touched - no exceptions
If stopped out twice from same level, wait for new setup
Profit Taking Strategy
Systematic Approach:
Take partial profits at first target (never wrong to take profit)
Move stop to breakeven after Target 1
Trail stop using previous swing lows (intraday) or daily lows (swing)
Never let winner turn into loser once breakeven is reached
Trading Plan Summary
For Intraday Traders (Next 5 Days)
Primary Focus: Watch for breakout above $3,920 or pullback to $3,860 support zone
Best Times to Trade: London and US session opens for maximum liquidity
Key Levels:
Resistance: $3,920, $3,950, $4,000
Support: $3,875, $3,860, $3,850
Recommended Strategy: Buy dips near support with tight stops, or breakout trades above resistance with momentum confirmation
For Swing Traders (1-4 Weeks)
Primary Outlook: Bullish continuation toward $4,000-$4,200 zone
Optimal Entry: Any pullback to $3,850-$3,870 represents opportunity
Position Management: Scale in across multiple entries, scale out across multiple targets
Major Resistance: $4,015 (Gann), $4,180 (Elliott Wave)
Critical Support: $3,765 (daily 50 EMA) - break here invalidates bullish setup
Conclusion & Final Recommendations
Gold remains in a strong uptrend across all major timeframes with technical indicators supporting further appreciation. The current consolidation near all-time highs is typical behavior before the next leg higher. Both intraday and swing traders have clearly defined opportunities with favorable risk/reward ratios.
Confidence Level: 75% probability of testing $4,000+ within next 2-4 weeks based on technical confluence
Preferred Strategy: Buy dips with defined risk, scale out into strength
Critical Warning: Any daily close below $3,765 would damage the bullish structure and require reassessment
Next Major Update: October 11, 2025, or immediately following any significant technical breakout/breakdown
Disclaimer: This analysis is for educational and informational purposes only. Trading financial instruments involves substantial risk of loss. Past performance does not guarantee future results. Always conduct your own research and consider your risk tolerance before trading. The author is not responsible for any trading losses incurred based on this analysis.
Next Update: October 11, 2025
Analysis Valid Through: October 18, 2025
Prepared using advanced technical analysis incorporating Wyckoff, Elliott Wave, Gann, Harmonic Patterns, Ichimoku, and modern momentum indicators.RetryClaude can make mistakes. Please double-check responses.
SPX500 – Bearish Below 6,662 as Shutdown Risks Cloud Fed OutlookSPX500 – Overview
SPX500 is trading cautiously as Wall Street weighs the risk of a potential U.S. government shutdown and the Fed’s next policy steps.
The lack of clarity over upcoming economic data—especially if NFP is delayed—adds to volatility and makes short-term moves highly data- and headline-driven.
Technical Outlook
The index has stabilized below the 6,662 pivot, which supports ongoing bearish momentum.
→ As long as price stays under 6,662, downside targets are 6,635 and 6,617, with a further extension toward 6,580 if momentum accelerates.
However, if price stabilizes above 6,673, the bullish trend could resume toward 6,699 and higher.
Pivot: 6,662
Support: 6,635 – 6,617 – 6,580
Resistance: 6,674 – 6,699 – 6,742

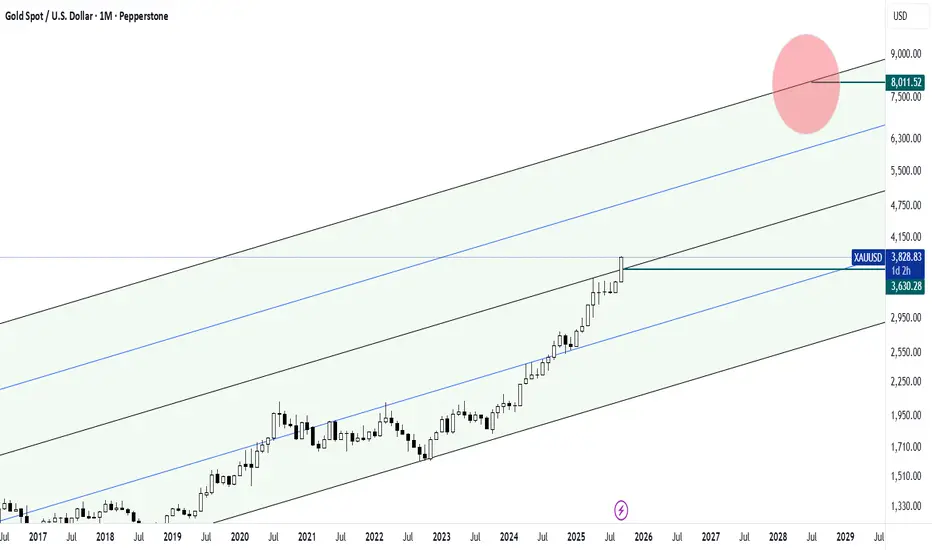
What direction are we really heading in?When the dark and difficult outlook of a very long-term analysis of the gold ounce chart contains hidden news, what else do you think about besides the chart?
$8,000 per ounce!!
I hope you succeed this time too.
#BTCUSDT.P (15m Chart)#BTCUSDT.P
(15m Chart)
🔹️ Update 🔹️
Entry zone (109,800 – 109,500) was not reached,
but Targets 1, 2, and 3 (111,000 – 112,400) have been hit ✅
⚠️ Bullish scenario played out, but no entry was triggered. Risk management first.
🆔 @Rasoolahmadi

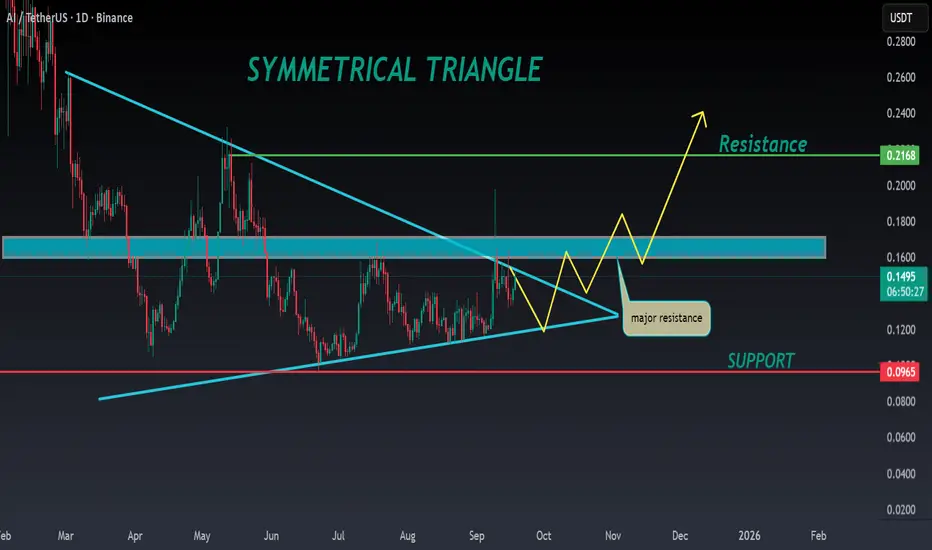
AI ANALYSIS🔮#AI Analysis 💰💰
#AI is trading in a symmetrical triangle in a weekly time frame and if it breakouts with high volume then we can see a bullish momentum in #AI. Before that we will see little bit bearish movement .
🔖 Current Price: $0.1490
⏳ Target Price: $0.2100
⁉️ What to do?
- We can trade according to the chart and make some profits in #AI. Keep your eyes on the chart, observe trading volume and stay accustom to market moves.💲💲
#AI #Cryptocurrency #Pump #DYOR
Strategy: The Convertible Trap
The Convertible Trap
Part One: The Architecture
December 2024
Marcus Chen stood before the floor-to-ceiling windows of his corner office on the 47th floor of One Manhattan West, watching the city blur into twilight. The Bloomberg terminal on his desk glowed with a constellation of green numbers—Bitcoin had just crossed $110,000, and MicroStrategy's stock was up another 15% for the day. As Chief Investment Officer at Sovereign Capital Management, overseeing $480 billion in assets, he'd seen every financial instrument imaginable. But what Michael Saylor and MicroStrategy were building was something else entirely.
"Marcus, you need to see this." Sarah Kozlowski, his senior analyst, burst through his door without knocking—a breach of protocol that meant something significant. She spread a series of charts across his Italian marble desk, her usually steady hands trembling slightly with excitement. "I've been modeling MSTR's convertible bond strategy for three weeks. It's not just clever—it's architecturally perfect."
Marcus studied the papers. MicroStrategy had issued another $2 billion in convertible bonds at 0.875% interest, due 2029. The bonds could convert to MSTR shares if the stock hit $1,000—currently trading at $450. The company would use every dollar to buy more Bitcoin.
"Explain it to me like I'm a client," Marcus said, though he understood perfectly well. He wanted to hear her reasoning.
Sarah pulled up a chair, her Princeton MBA and MIT engineering background evident in how she structured her explanation. "Think of it as a three-layer cake. Layer one: Institutions like us, State Street, Vanguard—we're legally restricted from holding Bitcoin directly. Our charters, our compliance departments, our insurance policies—they all prohibit direct cryptocurrency exposure."
"But they don't prohibit holding equities or corporate bonds," Marcus interjected.
"Exactly. Layer two: MicroStrategy becomes our proxy. They hold Bitcoin, we hold them. But here's where it gets beautiful—they've promised publicly, legally, repeatedly, that they will never sell a single Bitcoin. It's their core value proposition. They're a Bitcoin black hole."
Marcus walked to his window, processing. Twenty-three floors below, he could see the evening rush beginning on the Hudson River Greenway. Cyclists and joggers, oblivious to the financial architecture being constructed above them.
"Layer three?" he asked.
"The convertible bonds. We're calling them STRK internally—Saylor's Trap, Really, Kid—" Sarah smiled at the trader slang. "These aren't normal corporate bonds. They're a bet on MSTR reaching specific price targets. If MSTR hits $1,000, bondholders convert to equity. If not, they get their money back plus interest."
"And MicroStrategy uses the bond proceeds to buy more Bitcoin," Marcus said slowly, "which drives up their stock price because they're leveraged to Bitcoin's movement, which makes the conversion more likely, which attracts more institutional money to the bonds..."
"Which they use to buy more Bitcoin," Sarah finished. "It's a perpetual motion machine powered by institutional FOMO and regulatory arbitrage."
Part Two: The Believers
March 2025
The Sovereign Capital Management quarterly board meeting took place in the firm's pristine boardroom, with its Rothko paintings and panoramic views of the Hudson. Marcus presented to twelve board members, each representing different institutional stakeholders—pension funds, sovereign wealth funds, university endowments.
"We're recommending a $3 billion position," Marcus said, clicking through his presentation. "Split between MSTR equity and the convertible bonds."
Board member Patricia Thornton, former Federal Reserve governor, raised a manicured hand. "What's our downside protection?"
"The bonds provide a floor," Marcus explained. "Even if Bitcoin crashes, MicroStrategy owes us the principal plus interest. They have Bitcoin reserves worth $30 billion against $8 billion in convertible debt."
"Unless Bitcoin falls more than 70%," Patricia noted.
"Which has happened before," added James Park, representing the California State Teachers' Retirement System. "2022, Bitcoin fell from $69,000 to $16,000."
Marcus nodded. "True. But MicroStrategy's strategy has evolved. They're not just holding Bitcoin—they're the primary institutional gateway to Bitcoin. Every major fund that wants crypto exposure but can't hold it directly comes through them. They've become systemically important."
"Too big to fail?" Patricia's tone was skeptical.
"Too interconnected to fail," Marcus corrected. "State Street has $2 billion in MSTR. Vanguard has $3 billion. BlackRock, $4 billion. If MSTR fails, it takes down every institution's crypto allocation."
The board voted 10-2 to approve the investment.
That evening, Marcus met his old friend David Kim for drinks at The Campbell, a cocktail bar in Grand Central Terminal. David ran crypto strategy for Bridgewater Associates, the world's largest hedge fund.
"You're buying MSTR?" David asked, swirling his $30 Old Fashioned.
"Everyone is," Marcus replied. "You?"
"Ray Dalio thinks it's the greatest example of reflexivity he's ever seen. George Soros's theory made real—market participants' biased views shape market fundamentals, which shape views, which shape fundamentals..."
"Until?" Marcus prompted.
David was quiet for a moment, watching commuters rush past the bar's entrance. "Until the only way to maintain the reflexivity is to never sell. Ever. Saylor's created a roach motel for capital. Money checks in, but it can't check out."
Part Three: The Prophets
June 2025
The "Bitcoin Miami 2025" conference was a spectacle of excess. Marcus attended reluctantly, sent by his board to "understand the ecosystem." The Miami Beach Convention Center pulsed with electronic music, laser lights, and the energy of 50,000 true believers.
Michael Saylor's keynote was scheduled for prime time. Marcus found himself in the VIP section, surrounded by institutional investors trying to look casual in their business-casual interpretation of Miami wear—khakis and polo shirts that still screamed "Wall Street."
Saylor took the stage to thunderous applause. At 60, he looked energized, evangelical. Behind him, a giant screen showed MicroStrategy's Bitcoin holdings: 423,000 BTC, worth $52 billion at current prices.
"We are not a company," Saylor declared. "We are a Bitcoin bank for the institutional world. Every corporation, every pension fund, every sovereign wealth fund that cannot or will not hold Bitcoin directly—we are their bridge to the future."
The crowd roared. Marcus noticed Sarah in the row ahead, frantically taking notes.
"We will never sell," Saylor continued, his voice rising. "Not at $100,000. Not at $1 million. Not at $10 million per Bitcoin. MicroStrategy is where Bitcoin goes to live forever. We are the event horizon—once Bitcoin enters our treasury, it never leaves."
After the speech, Marcus found himself at an exclusive rooftop party, hosted by Galaxy Digital. The Miami skyline glittered around them, Biscayne Bay stretching to the dark Atlantic beyond.
"It's a cult," said a familiar voice. Marcus turned to find Christine Walsh, chief economist at the Federal Reserve Bank of New York, holding a mojito and looking deeply uncomfortable.
"Christine? What brings the Fed to Bitcoin Miami?"
"Systemic risk assessment," she said quietly. "We're tracking institutional exposure to crypto through MSTR. It's... significant."
"How significant?"
She glanced around, ensuring they weren't being overheard. "If you aggregate all the convertible bonds, equity holdings, and derivative exposure, the street has about $200 billion tied to MicroStrategy. That's not a company anymore, Marcus. It's a synthetic crypto ETF with no exit door."
"The SEC approved actual Bitcoin ETFs last year," Marcus pointed out.
"Which hold actual Bitcoin they can sell," Christine countered.
"MicroStrategy holds Bitcoin it claims it will never sell. What happens when bondholders want their money back, but selling Bitcoin would break the company's core promise?"
Before Marcus could answer, fireworks erupted over the bay, spelling out "BITCOIN" in golden sparks. The crowd cheered. Christine shook her head and disappeared into the party.
Part Four: The Mechanics
September 2025
Sarah's desk had become a command center for tracking the MSTR phenomenon. Six monitors displayed real-time data: Bitcoin price, MSTR stock, convertible bond prices, institutional holdings, social media sentiment, and blockchain analytics.
"Look at this," she called Marcus over one morning. "MSTR's beta to Bitcoin is now 2.8x. When Bitcoin moves 1%, MSTR moves 2.8%."
"That's the leverage," Marcus said. "They've borrowed to buy Bitcoin, so they're magnifying the moves."
"But watch this," Sarah pulled up a correlation chart. "The convertible bonds are creating a feedback loop. When Bitcoin rises, MSTR rises faster, making conversion more likely, so bond prices rise, so MicroStrategy can issue more bonds at better terms—"
"So they buy more Bitcoin," Marcus finished. "Show me the sensitivity analysis."
Sarah clicked through her models. "If Bitcoin hits $200,000, MSTR goes to approximately $2,000 per share. Every convertible bondholder converts to equity. MicroStrategy can issue new bonds against the higher equity value."
"And if Bitcoin falls to $50,000?"
Sarah's expression darkened. "MSTR drops to around $150. They'd owe $15 billion in bond principal against Bitcoin holdings worth $20 billion. Still solvent, but barely."
"What about $30,000?"
"Then they're underwater. They'd have to sell Bitcoin to pay bondholders, but—"
"But they've promised never to sell," Marcus said. "So they can't. They'd default instead?"
Sarah nodded. "Or find another way. Issue equity at crushed prices. Negotiate with bondholders. But once they break the 'never sell' promise, the entire thesis collapses."
Marcus studied the screens. Something felt familiar—dangerously familiar. He'd seen this kind of financial engineering before, in 2008, when mortgage-backed securities created similar feedback loops.
"Sarah, model one more scenario for me. What happens if several major institutions try to exit simultaneously?"
Her fingers flew across the keyboard. The model ran for several minutes, then displayed results that made them both step back.
"Cascade failure," Sarah whispered.
"If institutions holding 20% of MSTR try to exit, the selling pressure drops MSTR by 60%, triggering bond covenants, forcing Bitcoin sales, creating more selling pressure..."
"Print that out," Marcus ordered. "And schedule a meeting with risk management. Today."
Part Five: The Momentum
December 2025
Bitcoin crossed $200,000 on December 15th, 2025. The financial media called it the "Saylor Singularity"—MicroStrategy's holdings were worth $100 billion, making it one of the most valuable companies in the S&P 500 despite having only 2,000 employees and minimal revenue outside of Bitcoin appreciation.
Marcus watched the celebration from his office. On CNBC, analysts debated whether MSTR could reach $5,000 per share. On Bloomberg, Michael Saylor announced another $10 billion convertible bond offering—the largest in corporate history.
"The institutional demand is insatiable," Saylor told the interviewer. "We're giving the world's largest financial institutions what they want—Bitcoin exposure with a corporate wrapper. We're the bridge between the old financial system and the new."
Marcus's phone buzzed. David Kim from Bridgewater.
"You seeing this?" David asked without preamble.
"Watching Saylor on Bloomberg right now."
"No, check the blockchain. Someone just moved 50,000 Bitcoin from a wallet dormant since 2010."
Marcus pulled up the blockchain explorer. Sure enough, an ancient wallet—one of the original Bitcoin miners—had awakened. Fifty thousand Bitcoin, worth $10 billion at current prices, on the move.
"Satoshi?" Marcus asked, referring to Bitcoin's pseudonymous creator.
"Or someone from that era. Marcus, if original holders start selling into this rally..."
"They sell into MSTR's buying," Marcus said. "MicroStrategy is the buyer of last resort. They have to be—they've promised to buy Bitcoin with every dollar they raise."
"What if that's the point?" David's voice was strange. "What if the early Bitcoin holders have been waiting for someone like Saylor? Someone who would create a mechanism to buy their coins at any price, no questions asked?"
Marcus felt a chill despite his office's warmth. "You're suggesting this was planned?"
"I'm suggesting that anyone smart enough to create Bitcoin was smart enough to anticipate how institutions would eventually need to access it. And what better way to cash out tens of billions in Bitcoin than to create a buyer who publicly promises to never stop buying?"
Part Six: The Warning Signs
February 2026
The first crack appeared, as they often do, in an unexpected place. Turkey's central bank, facing a currency crisis, announced it would sell its Bitcoin reserves—50,000 coins accumulated since 2024. The market absorbed the selling initially, but then Iran announced similar plans, followed by Argentina.
Marcus convened an emergency meeting with his team.
"Sovereign sellers," he said, addressing the twelve analysts and traders gathered in the conference room. "We didn't model for this."
"MicroStrategy is buying," one trader reported. "They're deploying their latest bond proceeds. Taking everything the sovereigns are selling."
"At what price?" Marcus asked.
"Bitcoin's down to $180,000. MSTR is at $1,400, off 30% from the peak."
Sarah pulled up her models. "The February 2027 convertibles are now at risk. Strike price is $1,500. If MSTR doesn't recover, those bondholders will want cash, not equity."
"How much?"
"$4 billion in principal due."
Marcus did quick math.
"MicroStrategy would need to sell 22,000 Bitcoin to raise that cash."
"Which they won't do," Sarah said. "Can't do. The moment they sell a single Bitcoin, their stock goes to zero. Every institutional holder exits. The thesis breaks."
Patricia Thornton from the board called Marcus directly. "Are we hedged?"
"We've bought put options on MSTR," Marcus confirmed. "But Patricia, if MSTR fails, those puts might not pay. The counterparties are the same institutions that own MSTR. It's all interconnected."
"Systemic risk," Patricia said quietly.
"Like 2008."
"Worse," Marcus replied. "In 2008, the bad assets were mortgages on real houses. Here, the asset is Bitcoin—purely digital, purely psychological. If confidence breaks..."
He didn't need to finish.
Part Seven: The Unraveling
May 2026
The Bloomberg headline was stark: "MicroStrategy Bonds Trading at 70 Cents on Dollar as Bitcoin Slides."
Bitcoin had fallen to $120,000, down 40% from its peak. MSTR was at $800, down 60%. The mathematics were brutal and simple—leverage that magnified gains also magnified losses.
Marcus attended an emergency meeting at the Federal Reserve Bank of New York. The room was filled with the who's who of American finance—CEOs of major banks, heads of regulatory agencies, senior government officials.
Christine Walsh from the Fed led the meeting. "Total institutional exposure to MicroStrategy: $380 billion. That's direct holdings. Indirect exposure through derivatives and linked products: another $200 billion."
"They can just hold the bonds to maturity," suggested the CEO of JPMorgan. "Get paid back in cash."
"With what cash?" Christine asked. "MicroStrategy's business generates $500 million in annual revenue. They have $20 billion in convertible bonds outstanding. The only way they can pay is—"
"Selling Bitcoin," finished the Treasury Secretary. "Which they've promised never to do."
Michael Saylor appeared on the conference room screen via secure video link. Even through the pixelated connection, Marcus could see the strain on his face.
"Gentlemen, ladies," Saylor began, "MicroStrategy remains committed to our strategy. We will not sell Bitcoin. We have alternative financing options—"
"What options?" the JPMorgan CEO interrupted. "Your stock is down 60%. You can't issue equity at these levels. No one will lend to you."
"We're in discussions with sovereign wealth funds—"
"Who are selling Bitcoin themselves," the Treasury Secretary said. "Michael, the music has stopped. You need to sell Bitcoin to meet your obligations."
Saylor's jaw clenched. "The moment we sell, we destroy $380 billion in institutional value. Every fund that bought MSTR as a Bitcoin proxy loses everything. Is that what you want?"
The room fell silent. It was the ultimate prisoner's dilemma—everyone would be better off if MicroStrategy held, but MicroStrategy would be better off if it sold.
Part Eight: The Cascade
June 2026
The end came not with a bang, but with a spreadsheet.
MicroStrategy's CFO, under pressure from bondholders and facing personal liability, leaked an internal document showing the company's true financial position. Without Bitcoin sales, they could operate for three more months. The convertible bonds due in August couldn't be paid without liquidating Bitcoin.
The leak hit Reddit first, then Twitter, then the financial press. Within hours, MSTR was down 40%. Bitcoin, sensing weakness, fell 20%.
Marcus watched from his office as the cascade began. Funds that had bought MSTR on leverage faced margin calls. To meet them, they sold MSTR, pushing it down further, triggering more margin calls.
"It's 1987, 2008, and 2020 combined," Sarah said, standing beside him. "But faster. Everything's algorithmic now. The selling is automated."
By noon, MSTR was down 70% for the day. Trading was halted seventeen times. Each halt only increased the panic—buyers disappeared, knowing more selling was coming.
Then, at 2:47 PM Eastern Time, the announcement came:
"MicroStrategy Announces Strategic Bitcoin Sales to Ensure Financial Stability."
The press release was corporate speak for capitulation. They would sell 100,000 Bitcoin—roughly 20% of their holdings—to pay off near-term debt and establish a cash cushion.
The market's reaction was swift and brutal. If MicroStrategy was selling, everyone would sell. Bitcoin fell from $100,000 to $70,000 in an hour. MSTR stock, briefly halted, reopened down 85% from the morning.
Part Nine: The Reckoning
July 2026
The congressional hearing was held in the Rayburn House Office Building, the same room where they'd grilled bank CEOs after 2008. Michael Saylor sat alone at the witness table, facing forty-three members of the House Financial Services Committee.
"Mr. Saylor," the committee chair began, "your company's failure has resulted in over $400 billion in losses to institutional investors, pension funds, and retirement accounts. How do you explain this?"
Saylor leaned into the microphone. "MicroStrategy didn't fail. We adapted to market conditions. We still hold 400,000 Bitcoin—"
"Worth $30 billion at current prices," the chair interrupted. "Down from $100 billion. Your stockholders have lost everything. Your bondholders are being paid back at 30 cents on the dollar."
"The strategy was sound," Saylor insisted. "We created a mechanism for institutions to gain Bitcoin exposure—"
"You created a trap," the ranking member interjected. "A financial weapon of mass destruction, as Warren Buffett might say. Institutions couldn't buy Bitcoin directly, so they bought your promises. And when those promises broke..."
Marcus watched the hearing from his office—one of the few he still had. Sovereign Capital had survived, barely, by selling their MSTR position in January before the worst of the collapse. They'd lost $800 million but avoided the complete wipeout that befell others.
State Street: $2 billion loss.
Vanguard: $3 billion loss.
Various pension funds: $50 billion combined.
The numbers were staggering, but the second-order effects were worse. The collapse in Bitcoin and MSTR had triggered a broader market selloff.
Crypto-correlated stocks crashed.
Tech stocks, seen as speculative, fell 30%. Credit markets froze as institutions faced massive losses.
Part Ten: The Revelation
September 2026
Marcus met David Kim at a coffee shop in Greenwich Village, far from their usual Wall Street haunts. Both men had left their firms—Marcus to start a small advisory business, David to teach at Columbia.
"I've been analyzing the blockchain," David said, sliding a tablet across the table. "Look at this."
The screen showed Bitcoin wallet analytics—flows, timing, amounts.
"Remember those early wallets that woke up during the boom? They sold perfectly into MicroStrategy's buying. Almost like they knew exactly when and how much MSTR would buy."
Marcus studied the data. "You're suggesting coordination?"
"I'm suggesting something more elegant. What if Satoshi—or whoever created Bitcoin—understood that institutional adoption would require an intermediary? A bridge between the anarchist vision of cryptocurrency and the regulatory reality of institutional finance?"
"MicroStrategy," Marcus said slowly.
"Not specifically MicroStrategy, but something like it. Some entity that would promise to never sell, becoming a one-way valve for institutional capital. The early holders could sell into institutional buying, cashing out billions, while institutions got exposure to an asset they couldn't directly hold."
Marcus sat back. "But that would mean—"
"That Bitcoin was designed from the beginning as history's greatest liquidity extraction mechanism. Not a conspiracy, exactly. More like... intelligent design. Create a scarce digital asset, wait for institutional FOMO, provide a mechanism for them to buy but never sell, then cash out into their buying."
"That's insane," Marcus said.
"Is it?" David pulled up another chart. "Look at the net flows. Early Bitcoin holders—the ones from 2009 to 2013—cashed out $500 billion during the MicroStrategy boom. That money came from institutions, pension funds, retirement accounts. It was the greatest wealth transfer in history, from institutional capital to anonymous early adopters."
Marcus stared at the data. The pattern was undeniable.
Part Eleven: The New Normal
December 2026
Bitcoin stabilized around $50,000. MicroStrategy, restructured through bankruptcy, emerged as a small software company again, its Bitcoin holdings liquidated to pay creditors. Michael Saylor stepped down, his fortune evaporated, his legacy complicated.
The congressional committee issued a 400-page report recommending new regulations on corporate cryptocurrency holdings and convertible bond issuances. The SEC implemented strict rules on institutional crypto exposure. The era of financial engineering through crypto proxies was over.
Marcus stood in his new office—smaller, simpler, with a view of the East River instead of the Hudson. He was writing a book about the MicroStrategy phenomenon, trying to capture the madness and brilliance of it all.
His phone buzzed. Sarah, now running her own research firm.
"You see the news?" she asked.
"What now?"
"Some company in Singapore is issuing Bitcoin-backed bonds. They promise to hold Bitcoin forever, never sell. Institutions are interested."
Marcus laughed, dark and knowing.
"Different verse, same song."
"You think it'll happen again?"
Marcus looked out at the river, watching a container ship navigate toward the Atlantic. "The names change, the instruments evolve, but the pattern remains. Someone creates a mechanism to concentrate wealth while appearing to democratize it. Investors, driven by greed and FOMO, pile in. The machine runs until it can't. Then it collapses, and we promise never again."
"Until the next time," Sarah said.
"Until the next time."
Epilogue: The Historian
2030
Professor Marcus Chen stood before his graduate finance class at Columbia Business School. On the screen behind him: a chart of Bitcoin's price from 2009 to 2030, with the MicroStrategy era highlighted in red.
"The MicroStrategy collapse of 2026," he began, "represents a unique moment in financial history. It wasn't fraud, exactly—everything was disclosed. It wasn't illegality—regulators had approved it all. It was something more subtle: a system designed to fail profitably."
A student raised her hand. "Professor, do you think it was intentional? The whole Bitcoin-to-institutional-capital pipeline?"
Marcus considered the question he'd been pondering for four years. "Intent is hard to prove. But consider this: Bitcoin was created by someone or some group brilliant enough to solve the double-spending problem that had plagued digital currency for decades. They created a system that survived every attack, scaled beyond anyone's imagination, and eventually attracted trillions in institutional capital."
He clicked to the next slide, showing fund flows from 2024 to 2026.
"Is it so hard to believe they also anticipated how institutions would need to access Bitcoin? That they understood regulatory constraints would require intermediaries? That those intermediaries would create the perfect exit liquidity for early holders?"
The class was silent, absorbing the implications.
"The MicroStrategy story isn't just about one company or one man's obsession with Bitcoin. It's about how financial innovation can become financial extraction. How complexity can hide simple wealth transfers. How the promise of democratization can enable unprecedented concentration."
He clicked to his final slide: a quote from Satoshi Nakamoto's original Bitcoin whitepaper: "The traditional banking model achieves a level of privacy by limiting access to information to the parties involved and the trusted third party. The necessity to announce all transactions publicly precludes this method, but privacy can still be maintained by breaking the flow of information in another place: by keeping public keys anonymous."
"Perhaps," Marcus said, "the real innovation wasn't the anonymity of transactions, but the anonymity of the architects. They built a machine that would inevitably create its own exit liquidity, then disappeared before anyone understood what they'd built."
A student in the back called out, "So it was all a scam?"
Marcus smiled, the same ambiguous smile he'd worn since 2026. "No, not a scam. Something more elegant and more troubling. A system working exactly as designed, just not as advertised. The greatest magic trick in financial history—making institutional wealth disappear into anonymous wallets, and making everyone applaud the innovation while it happened."
The bell rang. Students filed out, discussing the lecture in hushed tones. Marcus remained, staring at the Bitcoin price chart, still wondering if he was seeing patterns that weren't there or missing patterns that were.
His phone buzzed. A news alert: "New DeFi Protocol Promises Institutional Gateway to Cryptocurrency 2.0."
Marcus shook his head and smiled. The machine was starting up again, with new gears, new levers, but the same essential mechanism—a one-way valve for institutional capital, a promise of revolution that delivered extraction.
He gathered his papers and left the classroom. Outside, New York hummed with its eternal energy, fortunes being made and lost, the next financial innovation always just around the corner.
In his pocket, his phone buzzed again. He didn't check it. He knew what it would say—someone, somewhere, was building the next MicroStrategy, the next bridge between institutional capital and digital assets. The next trap.
The cycle continued.
BTC to $21,000,000? Mirroring 2017 With Institutional Firepower.📈 Chart Thesis:
By duplicating the trajectory of the 2017 Bitcoin bull run and stretching it over the current cycle (2022–2027), we observe a surprisingly clean fit — both structurally and temporally.
2017 Bull Run: 150 bars (1,050 days)
Current Cycle: 245 bars (1,715 days)
Target: $21M by May 2027 (logarithmic trajectory within an ascending channel)
🧠 Technical Setup
Heikin Ashi Weekly candles show a strong parabolic continuation.
MA 50–100 cross (August 2022) signaled the macro bottom — historically reliable across cycles.
Volume profile reveals accumulation at the base of the current bull channel (similar to 2015–2016 and 2020).
Extended time window (245 bars) suggests a longer, more mature bull market compared to 2017, driven by institutional entry.
🧩 Fundamental Support for a $21M BTC
The bullish structure isn't just technical — the fundamentals are the strongest they’ve ever been:
✅ Bitcoin ETFs Approved
Spot Bitcoin ETFs (e.g. BlackRock, Fidelity) were approved in early 2024.
This unlocks trillions in institutional capital that previously had no secure gateway to Bitcoin exposure.
We’re seeing sustained inflows from IRAs, pensions, and conservative funds.
🇺🇸 Trump and Pro-Crypto Policy
Donald Trump openly endorsed Bitcoin during his 2024 campaign and has called it "America’s last defense against CBDCs."
His “401(k) Bitcoin bill” allows Americans to allocate retirement savings into BTC via regulated products (ETFs & trusts).
This could redirect hundreds of billions in retirement funds toward BTC.
💼 Michael Saylor’s Corporate Bitcoin Standard
MicroStrategy, led by Saylor, has doubled down — now holding over 250,000 BTC.
His strategy is being mimicked by mid-sized firms and even nation-states.
The corporate treasury narrative is back in full force — and this time, institutional CFOs have regulatory clarity.
🔗 Scarcity Meets Demand
With the 2024 halving behind us, daily issuance is now less than what MicroStrategy alone buys monthly.
Combine this with ETF demand and sovereign interest: the available float is evaporating.
As the final 2 million BTC approach circulation, the “digital gold” thesis becomes “digital diamond.”
🎯 The Case for $21 Million BTC
Some say $1M BTC is the ceiling — but consider this:
Global M2 money supply: Over $100 trillion.
Gold market cap: ~$14 trillion.
Global real estate & debt: >$600 trillion.
A $21 million Bitcoin price would give BTC a ~$420 trillion market cap — absurd at first glance, but not if BTC becomes the base layer collateral of the digital economy.
As fiat confidence erodes, a neutral, incorruptible, programmable monetary asset will gain exponential value.
🕰 Timeline Alignment
MA cross and macro bottom: August 2022
Consolidation and early breakout: 2023–2024
ETF & political momentum: 2024–2025
Acceleration and final parabolic phase: 2026–2027
Peak projection: May 10, 2027
🚀 Conclusion: Bitcoin’s Final Form?
This is not just a chart projection. It’s a convergence of:
Perfect technical structure,
Historical precedent,
Unprecedented institutional alignment,
Political support,
And hyper-monetary demand.
$21M sounds impossible… until it becomes inevitable.
🔗 Follow for updates as this cycle unfolds.
🧠 Stay irrationally rational.

GBPJPY 4HOUR TIME FRAME BUY ANALYSISOn the 4-hour chart, GBP/JPY is showing clear signs of a renewed bullish trend:
Higher-highs & higher-lows
Since mid-July, price has been carving out a staircase of successive peaks and troughs. The latest swing low around 197.30 held firm, and the subsequent rally cleared the June–July consolidation high near 198.40.
Breakout and retest
Price broke above a shallow descending trendline at ~197.65 late yesterday, then pulled back to retest that line as new support. Your entry at 197.902 sits just above that retest, giving a tight buffer to the stop.
Stop-loss placement
The SL at 197.275 undercuts the recent 4H swing low (197.30), so if that level fails it argues the bullish thesis is invalidated.

BTCUSD 4HOUR TIME FRAME ANALYSISOverall Structure & Trend
Over the past several 4-hour candles, BTCUSD has carved out a series of higher lows around 116,500–117,000 and higher highs around 120,000–120,500, defining a gentle up-sloping channel.
The current price (118,758) sits just above the middle of that channel, suggesting there’s still room toward the upper trendline before meeting heavy supply.
Key Support & Entry Zone
Primary support lies at 117,200–117,500 (the former swing high from three bars ago), which also aligns with the 50% retracement of the move up from 114,500 to 120,500. That zone offers confluence for the 118,758 entry.
A secondary buffer sits at 116,849 (your stop-loss), just below the channel’s lower boundary—if price breaches here, the bullish structure would be invalidated.

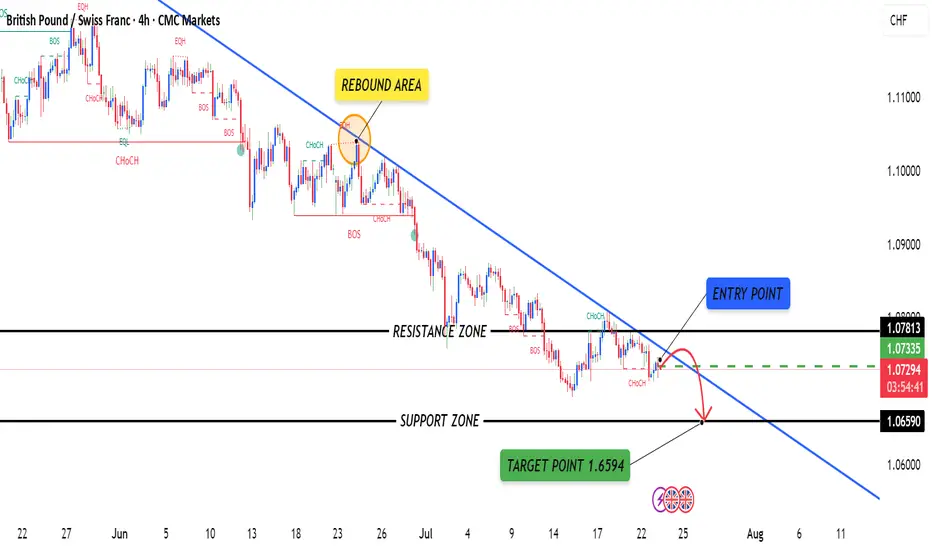
GBPCHFGBPCHF is currently in a downtrend, confirmed by a series of lower highs and lower lows.
The pair has recently formed a bearish engulfing candle below the minor resistance zone near 1.07400, signaling renewed bearish pressure.
Price rejection from the 50 EMA suggests sellers are still in control.
RSI is trending downward, staying below 50, indicating bearish momentum without being oversold.
GBPJPY 4HOUR TIME FRAME ANALYISOn the 4-hour chart, GBP/JPY has been tracing out a clear up-trend over the past several weeks, marked by a sequence of higher highs and higher lows. Your proposed long entry at 198.632 neatly coincides with two layers of support:
Trendline support: A rising trendline drawn off the last two significant swing lows intercepts right around 198.6, suggesting the pair is catching a bid as it back-tests that line.

Ethereum - ETH - Heading towards the CME Gap - 3200 Target+ After a significant crash, Ethereum has shown a strong recovery.
+ A large CME gap exists between $2,880 and $3,270.
+ Historically, 90% of CME gaps tend to get filled sooner or later.
+ Current price action suggests Ethereum is heading directly toward this gap.
+ High probability that the CME gap will be filled during this move.
+ Next target for ETH: $3,200.
Stay tuned for more updates.
Cheers,
GreenCrypto

GOLD fluctuates, but remains generally stable sidewaysOANDA:XAUUSD has been volatile and volatile but has remained broadly stable as investors assess the conflict between Israel and Iran while keeping an eye on this week's Federal Reserve policy meeting.
Spot gold was steady at $3.38/oz at press time, down from a high of $3,403/oz yesterday (Tuesday).
Israel and Iran traded fire for a fifth day on Tuesday as US President Donald Trump called for the evacuation of the Iranian capital Tehran and cut short his trip to the G7 summit in Canada, amid reports he had asked his administration's National Security Council to prepare in the Situation Room.
According to Reuters, Tehran has asked Oman, Qatar and Saudi Arabia to urge Trump to push Israel for a regional ceasefire in exchange for Iran's willingness to be flexible in nuclear talks.
Trump's latest Truth Social post stated: "I have not communicated with Iran in any way, shape or form about (peace talks). This is all fake news! If they want to negotiate, they know how to communicate with me. They should make a deal at the negotiating table, it will save lives!!!"
Forexlive commented that those who know Trump know that he will definitely wait for Iran to come to him. According to reports, Iran is trying to negotiate a ceasefire, but has not received any substantive news so far.
Non-yielding gold is seen as a hedge against geopolitical and economic uncertainty and has generally performed well in low interest rate environments. So, fundamentally speaking, gold should be positive in the current market environment, although the sharp declines often make new traders lose their confidence in the trend. I myself have been the same way, there have been many times this year when I did not believe in myself, did not believe in the uptrend and ended up with bad results…
The Fed's interest rate decision and Chairman Jerome Powell's speech will be released today (Wednesday). Traders are now expecting the Fed to cut interest rates twice by the end of the year.
According to CME's "Federal Reserve Watch" on June 18:
• The probability of the Federal Reserve keeping interest rates unchanged in June is 97.3% and the probability of a 25 basis point rate cut is 2.7%;
• The probability of a rate stay unchanged in July is 85.3%, the probability of a cumulative 25 basis point rate cut is 14.4% and the probability of a cumulative 50 basis point rate cut is 0.3%.
Technical Outlook Analysis OANDA:XAUUSD
On the daily chart, gold has been trading back and forth between the 0.236% Fibonacci retracement level and the 3,400USD whole price point, which was noted as the nearest support and resistance sent to readers in the previous issue.
However, the overall technical structure remains unchanged with the uptrend still dominating the chart, with the EMA21 support as the important support and the trend as the main trend. Meanwhile, the 0.236% Fibonacci retracement level is the nearest support and the price channel is the short-term trend.
In terms of momentum, the Relative Strength Index (RSI) remains above 50 and 50 is considered support in this case for the RSI, with the distance far from the overbought zone suggesting that there is still room for upside ahead.
During the day, if gold breaks above the raw price point of $3,400, it will give a positive signal for the bullish outlook and the target is then around $3,435 in the short term.
Finally, the notable positions will be listed as follows.
Support: $3,371 – $3,350
Resistance: $3,400 – $3,435
SELL XAUUSD PRICE 3423 - 3421⚡️
↠↠ Stop Loss 3427
→Take Profit 1 3415
↨
→Take Profit 2 3409
BUY XAUUSD PRICE 3351 - 3353⚡️
↠↠ Stop Loss 3347
→Take Profit 1 3359
↨
→Take Profit 2 3365
