NQ on Major Support Target 36,490Nasdaq 100 index is on major support since September. This is the area you want to buy and as it goes up take some profits if you want for a potential check back into support around early 2027 (green path).
There's the alternative scenario (orange path) that we just trend right up to 36,490 resistance and then have a major pullback to the long term trend. This one is less likely, but possible.
Either way if you sell some of your position (like shorter term options) in the middle of the range you're likely to be in a better position than holding the entire time as eventually that lower trend should get hit and that's a lot of time decay to ruin your positions.
Good luck!
Futures

#USDJPY , Second Round ?📌 Market Insight: {#USDJPY }
⚠️ Risk Assessment: {High}
🚀 Approach:
Second Round ? ... Lets see .
Need momentum Structure .... just for QuickScalp
#Ash_TheTrader #Forex #GBPJPY #MarketAnalysis #TradingSetup #RiskManagement #GOLD #Scalper #NQ #EURUSD

XAU/USD ANALYSIS 11/25/20251. Fundamental Analysis:
a) Economy:
• USD:
The USD is slightly weakening due to expectations that the FED will keep rates unchanged and may deliver more dovish signals in speeches this week.
• U.S. Stocks:
Wall Street inched higher last night, with the market leaning toward a risk-on sentiment, which usually weighs on gold. However, the gains were not strong → gold is not under heavy pressure.
• FED:
The FED continues to emphasize a “data-dependent” stance, but the market is starting to believe in the possibility of rate cuts in the coming months. This supports gold in the medium term.
• TRUMP Administration:
The new administration prioritizes economic recovery, deregulation, and tax cuts → which may stimulate the stock market, but geopolitical risks still linger → gold benefits whenever volatility rises.
• Gold ETF (SPDR):
SPDR has been buying and selling alternately with no clear trend. However, recent selling volume is not large → no major bearish pressure on gold. On Nov 24, the fund bought 0.29 tons—small, likely probing while waiting for upcoming news and market reactions.
b) Politics:
Tensions in the Middle East remain unresolved; additionally, U.S.–China trade competition still holds the potential for new conflicts → gold maintains its safe-haven appeal.
c) Market Sentiment:
The market is slightly risk-on, but within a narrow range and lacking strong momentum → reversal risks are always present.
The “waiting for FED this week” sentiment makes gold move more technically.
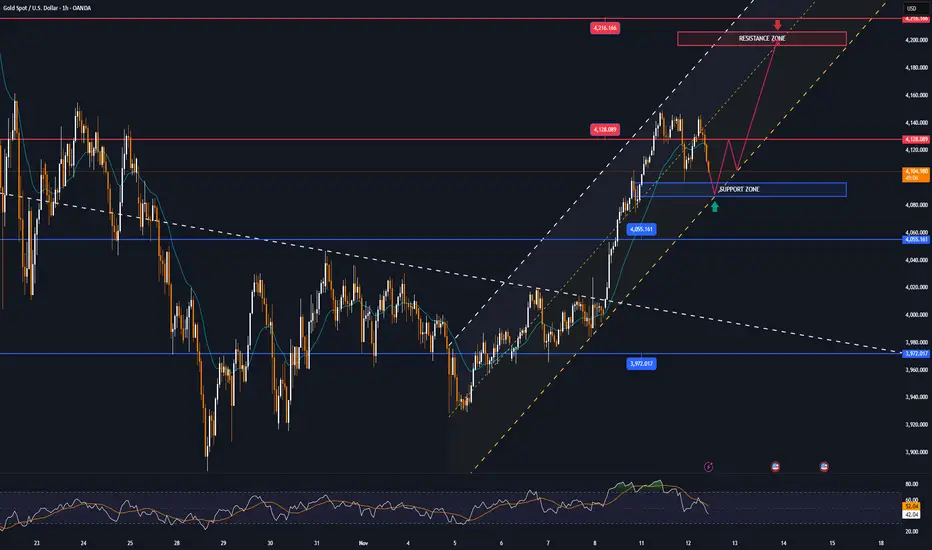
2. Technical Analysis:
The 30-minute timeframe gives extremely clear signals:
• Price has broken above the descending trendline extending from the Nov 17 high.
• A new uptrend (short- to medium-term) is forming.
• Extended targets if momentum holds: 4,244 – 4,276.
• RSI is in the mid-high zone but not overbought → still room for upside.
• MA20 has crossed above MA50 nicely, supporting the bullish trend.
Overall: Gold is likely retesting the breakout and continuing the upward trend.
RESISTANCE: 4,193 – 4,244 – 4,276
SUPPORT: 4,096 – 4,040 – 4,029 – 4,000
3. Previous Market Session:
• Gold surged strongly from the 4,040 zone, breaking the descending trendline and the ascending triangle.
• Price closed above all short-term EMAs → buying pressure dominates.
• Volume increased during the breakout → confirming the trend.
4. Strategy for Today (Nov 25, 2025):
🪙 SELL XAUUSD | 4195 – 4193
SL: 4199
TP1: 4187
TP2: 4181
🪙 BUY XAUUSD | 4084 – 4086
SL: 4080
TP1: 4092
TP2: 4098

GOLD market after “Fed fever”, growth momentum is challengedOANDA:XAUUSD prices remain in the spotlight as the market has been experiencing a series of strong fluctuations following mixed signals from the Federal Reserve and labor data. However, developments show that the risk of price declines is increasing as the precious metal has repeatedly failed in its efforts to hold the $4,100/ounce area, the first resistance level of this year's hot period.
For most of 2025, gold has risen more than 55%, despite high bond yields and a strong dollar. But as the Fed’s final policy meeting approaches and the market lacks consensus on the path of interest rate cuts, the traditional correlation between gold, interest rates, and the dollar is returning. According to CME’s FedWatch, the market still expects a more than 70% chance of the Fed cutting interest rates next month, while economists maintain a more cautious assessment of only about 50/50.
This puts the upcoming economic data in a decisive position for both market expectations and gold’s stability in this trading week.
Fed’s Dovish Return: A Direct Impact on Gold’s Upward Momentum OANDA:XAUUSD
Gold settled in the first half of the week as demand for havens increased, while the ADP report showed that the private sector cut an average of 2,500 jobs per week in the four weeks to November 1.
The 4,000 USD/ounce level continues to be the key threshold determining the short-term trend, as the market is moving within a correction zone but has not yet broken the medium-term bullish structure.
Technical analysis and suggestions OANDA:XAUUSD
1. Price Structure & Overall Trend
• Price is still within the ascending channel that has extended since August, although the range has narrowed compared to October. The October peak around 4,128 USD acts as a major medium-term resistance.
• The current decline is still only a pullback within the uptrend, as long as price holds above 3,972 USD (Fib 0.382) and especially the 4,000 USD psychological & technical support.
2. Key Technical Zones
• Nearest resistance: 4,128 – 4,216 USD
(A strong resistance cluster where price has been repeatedly rejected in November.)
• Nearest support: 4,055 – 4,000 USD
(This zone aligns with Fib 0.382 and the short-term bottom.)
• Deeper supports:
3,846 USD (Fib 0.5) – Important for a deep pullback scenario
3,720 USD (Fib 0.618) – Reaction support in case of strong macro volatility
3. Price Momentum – RSI
• RSI has moved out of oversold territory but remains weak and has not re-established a bullish structure.
• The RSI-MA21 is flat → the market lacks strong momentum; sideways movement or a retest of the 4,000 USD zone is highly likely.
4. Short-Term Outlook (Next Week)
• Market bias: Neutral to slightly bearish, but the medium-term uptrend remains intact.
• Price is likely to retest 4,000 USD, then form one of two scenarios:
o Hold 4,000 → rebound to 4,128 – 4,216 USD
o Break 4,000 → drop to 3,972 – 3,846 USD
👉 Conclusion: 4,000 USD is the decisive level for the short-term trend.
BUY XAUUSD PRICE 4102 - 4100⚡️
↠↠ Stop Loss 4106
→Take Profit 1 4094
↨
→Take Profit 2 4088
SELL XAUUSD PRICE 4016 - 4018⚡️
↠↠ Stop Loss 4012
→Take Profit 1 4024
↨
→Take Profit 2 4030

XAU/USD ANALYSIS 11/24/20251. Fundamental Analysis:
a) Economy:
• USD:
The USD is stabilizing after a recent period of weakness as markets expect the Fed to maintain lower interest rates in 2025, reducing pressure on gold.
• US Stock Market:
U.S. equities are seeing slight corrections, reflecting cautious sentiment ahead of this week’s FOMC minutes. When stocks stall, gold often benefits.
• FED:
Recent weak economic data has increased expectations that the Fed will cut rates earlier in 2025. Any dovish signals from the Fed will support gold prices.
• TRUMP Administration:
The Trump administration is considering a new economic stimulus package and adjustments to import taxes. Protectionist-leaning policies may cause volatility in the USD, but generally increase safe-haven demand — supporting gold.
• Gold ETF (SPDR):
SPDR has recently shown mixed buying and selling, indicating capital flows are not yet surging but also no longer experiencing heavy outflows. This is a neutral signal but slightly supportive of price stability.
b) Politics:
Tensions in the Middle East and concerns about the upcoming EU elections keep defensive capital flows active. These factors help support gold and limit the risk of deep declines.
c) Market Sentiment:
The market is in a mild risk-off state, with capital shifting toward safe assets, though not strongly yet. This aligns with gold maintaining its base and having the potential to break out if key technical levels are breached.
2. Technical Analysis:
• Price is maintaining a long-term uptrend line from early November.
• A compression triangle pattern has been broken to the upside — a clear bullish signal.
• The 4,064 level is a key retest zone currently being tested.
• If this zone holds, upside targets will expand.
• RSI on the M30 timeframe is in a balanced zone, not overbought — favorable for further upside movement.
Conclusion: The trend leans bullish as long as price does not break below the trendline and the 4,029 zone.
RESISTANCE: 4,096 – 4,125 – 4,193
SUPPORT: 4,029 – 4,000 – 3,964
3. Yesterday’s Market (21/11/25):
• Gold fluctuated strongly from the 4,029 support area and bounced back along the trendline.
• Buyers dominated late in the session, setting up a foundation for today’s recovery.
• Volatility has been narrowing, signaling a potential breakout.
4. Strategy for Today (24/11/25):
🪙 SELL XAUUSD | 4147 – 4145
SL: 4153
TP1: 4137
TP2: 4129
🪙 BUY XAUUSD | 3964 – 3966
SL: 3960
TP1: 3972
TP2: 3978

GOLD MARKET ANALYSIS AND COMMENTARY - [Nov 24 - Nov 28]This week, the international OANDA:XAUUSD price continued to hold above the support level of 4,000 USD/oz, but the risk of price decline is increasing due to geopolitical tensions and expectations that the FED will cut interest rates at the December meeting is not enough to create a strong rebound for gold prices.
The gold price next week may continue to fluctuate in a narrow range, waiting for US economic data to clarify the FED's interest rate reduction roadmap.
Retail sales and producer price index (PPI) reports, along with other data due next week, could help us get a better idea of the US economic situation. If the US economic data is below expectations, it could increase expectations for a Fed rate cut in December, pushing gold back above $4,100/oz next week. However, if these data continue to reduce expectations for a Fed rate cut, gold could break the important support level of $4,000/oz next week, opening the door to $3,845-$3,800/oz.
However, in the long term, gold prices are still expected to continue to rise as central banks continue to buy, although the pace of buying may slow down due to the high gold price. Moreover, gold has proven its value, even when compared to other stores of value such as cryptocurrencies, due to the sharp decline of bitcoin and many other cryptocurrencies. Therefore, the appeal of gold is still very large and has no rivals in the financial investment environment.
📌Technically, on the H4 chart, an important support level is established around the 4,000 USD/oz threshold. If this level is broken, the gold price is at risk of falling deeply to 3,900 or even 3,850 USD/oz. In case the gold price forms a double bottom pattern at 4,000 and breaks through the 4,132 resistance level, there is a chance to recover above the 4,200 USD/oz threshold.
SELL XAUUSD PRICE 4176 - 4174⚡️
↠↠ Stop Loss 4180
BUY XAUUSD PRICE 3964 - 3966⚡️
↠↠ Stop Loss 3960

E mini S&P 500 weekly outlook and HTF reference pointsCME_MINI:ES1!
Expansion levels on ES. Will approach on a day to day basis with the daily closures

Emini Nasdaq 100. Important Areas to look for and Weekly outlookCME_MINI:NQ1!
Highlighted the important levels. what to look for how we can approach the next week in terms of higher timeframe reference points

Wheat in Focus: How Ukraine, China, and Weather could move WheatWheat is one of the world’s most widely traded agricultural commodities, essential for food and animal feed. Prices are heavily influenced by global supply and demand, with major producers including the U.S., Russia, the EU, Canada, Australia, and Ukraine. Weather conditions, geopolitical events, and large importer activity can all create significant volatility in the market. Let’s break it down.
1. What Drives Wheat Prices
Supply Factors
Wheat supply is heavily shaped by the major exporting regions—Russia, the EU, Australia, the U.S., Canada, and Ukraine. Weather is the biggest swing factor: drought, heat stress, floods, or winterkill can quickly tighten global supply and spark rallies. Crop progress reports and yield updates show how each production cycle is developing, while geopolitics—especially in the Black Sea—can disrupt export flows overnight. Input costs like fertilizer and fuel influence how much farmers plant, and currency moves affect which exporters are most competitive. Together, these factors determine how much wheat the world can actually deliver to the market. To summarize:
Major producers: Russia, EU, Australia, U.S., Canada, Ukraine
Weather: drought, heat stress, winterkill, floods
Crop progress: planting pace, crop conditions, yield expectations
Geopolitics: Black Sea tensions, export bans, sanctions, port disruptions
Input costs: fertilizer, fuel, logistics
Currency impact: strong USD usually weighs on wheat prices
Demand Factors
Demand for wheat is driven by global food consumption, animal feed needs, and the buying behavior of major importers such as China, Egypt, and Indonesia. Economic conditions matter because stronger economies consume more food and feed. Price relationships with other grains like corn and rice can shift demand toward or away from wheat. Changes in trade flows—such as China sourcing more from the U.S. instead of the Black Sea—can quickly redirect global shipments. These factors help traders understand whether demand is strengthening or weakening relative to available supply. To summarize:
Global consumption (food + feed use)
Large importer buying: China, Egypt, Indonesia, Turkey
Economic conditions in EM (Emerging Markets)
Substitution vs. corn/rice
Global trade flow shifts
2. Key Reports Traders Actually Need to Track
Instead of monitoring everything, wheat traders focus on the handful of reports that truly move price:
WASDE (Monthly) – The most important report in wheat trading. This is where global production, consumption, exports, and ending stocks get revised.
Wheat can rip or dump instantly on WASDE changes. If you track only one thing, track WASDE.
Weekly USDA Export Sales – This shows an immediate view of demand. Watch for:
Big purchases from China, Egypt, Indonesia
Surprising cancellations
Shifts from Black Sea to U.S. buying
It’s one of the fastest ways to spot demand changes ahead of price.
Crop Progress (Weekly, in season) – Important only during planting, growing and harvesting periods. The report tracks:
% planted
% harvested
Crop condition (% good/excellent)
Poor Conditions generally = bullish. Strong Conditions generally = bearish
Geopolitical headlines – In our opinion wheat is the most geopolitically sensitive commodity. Anything related to the following can cause immediate moves.:
Corridor shutdowns
Port attacks
Export bans
Ceasefire rumors
This is the intraday volatility driver that news traders capitalize on.
Weather in key regions (Daily / weekly) – Focus on the key regions of the U.S. Plains, Black Sea, Australia.
Drought in these regions generally = bullish. Good moisture generally = bearish.
Use simple sources like NOAA maps or short ag weather summaries (weather reports that impact agriculture).
CFTC COT (Weekly) – This is for context and is not used for trading signals. It shows whether funds are heavily long or short. Only the extremes matter:
Funds very short → short-covering rallies possible
Funds very long → risk of liquidation selloffs
This report is more relevant for swing and position traders.
3. Recent Market Drivers
Peace-proposal speculation:
Reports of a U.S. proposal involving Ukraine ceding Donbas triggered a fast selloff as markets priced in the possibility of Ukrainian exports normalizing.
Zelenskiy has stated he won’t accept territorial concessions, so a confirmed ceasefire remains unlikely unless U.S./EU pressure increases.
Market reaction:
Wheat dumped immediately on the headline, but the move didn’t sustain — traders want confirmation, not speculation.
China buying U.S. wheat:
Ongoing chatter that China is shifting some purchases to the U.S. (no official tonnage yet). This is a supportive demand story worth monitoring.
4. Chart Analysis: Recent Price Action and What to expect
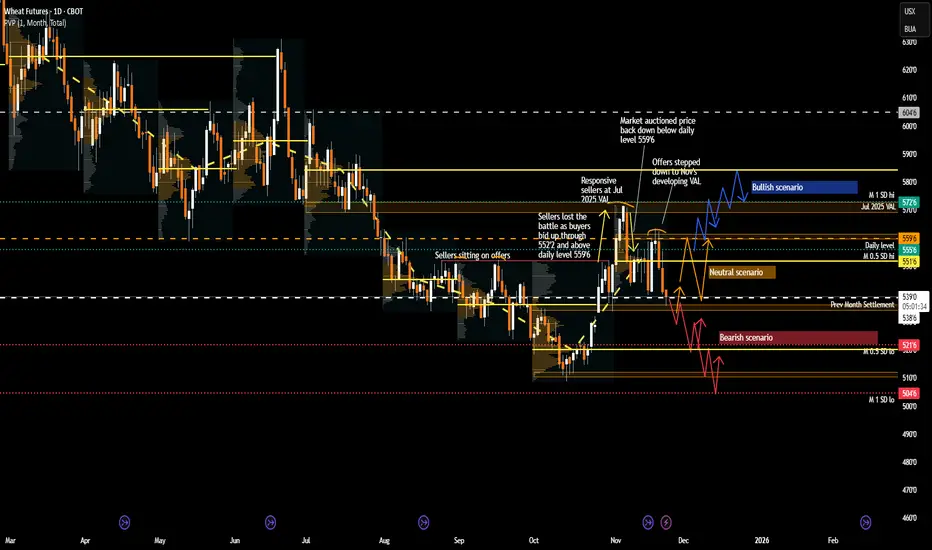
The developing monthly VPOC for November 2025 has shifted higher, marking a potential change in market sentiment after three consecutive months of declining VPOCs. In addition, the developing VA for November appears unlikely to overlap with the previous month’s VA. This suggests that market conditions are changing and that the recent downward trend may be ending.
Market based out around 520 and rallied from mid-October to early November, breaking 552’4 (previous seller defense) and reclaiming back above 559’6 daily level.
This rally was likely supported by the potential U.S.–China trade deal and initial Chinese wheat purchases in early November.
However, sellers stepped in at 570 (July’s VAL + monthly 1SD high), offering price back below 559’6. Market is now rotating inside a developing range between 559’6 and the 540–535’6 zone (October settlement/LVN) to establish value.
Bearish Scenario
A break and acceptance below 540 opens the door toward:
520 (October’s VPOC + monthly 0.5SD low)
510 (October low)
504’6 (monthly 1SD low)
Catalyst: Any news of confirmed progress toward a Russia–Ukraine ceasefire → removal of war-premium → likely downside.
Bullish Scenario
If market accepts back above 559’6, sets up a move toward:
570 (July VAL / M 1SD high) — expect sellers here.
585’6 (July VPOC) if 570 is cleared
Catalyst: Headline reversal or escalation in the conflict between Russia and Ukraine.
Neutral Scenario
Without fresh catalysts, expect continued range rotation between 559’6 and 540, with the market establishing value in this zone.
5. Conclusion
Wheat remains a headline-driven and weather-sensitive market, where geopolitical developments, major buyer activity, and crop conditions can quickly shift sentiment. Traders should monitor key reports and technical levels while staying aware of global supply and demand dynamics. With multiple factors in play, range rotations and sudden spikes or drops are likely until a clear catalyst drives the market decisively.
What are your thoughts? Are you watching the headlines, weather, or technical levels for clues? Please share your insights below and give this post a boost so the rest of the community can join the conversation.
Glossary Index for technical terms used:
VAH (Value Area High)
VAL (Value Area Low)
VPOC (Volume Point of Control)
SD (Standard Deviation)
LVN (Low Value Node)
VA (Value Area)
XAU/USD ANALYSIS 11/21/20251. Fundamental Analysis
a) Economics
– USD:
• The USD is slightly weakening as markets expect the FED to keep rates unchanged and still lean toward rate cuts in the upcoming quarters.
• No strong hawkish signals, so the USD is not putting significant pressure on gold this morning.
– U.S. Stock Market:
• U.S. equities edged higher last night thanks to rate-cut expectations, but the upside momentum is weak as markets await more economic data.
• Risk-on sentiment is mildly present, creating slight pressure on gold but nothing major.
– FED:
• The FED maintains a “data-dependent” stance without introducing new tightening signals.
• This provides medium-term support for gold (preventing deep declines).
– TRUMP:
• The Trump administration prioritizes tax cuts and economic support, increasing expectations of inflation.
• Long-term outlook: gold remains supported due to future Fed rate cuts.
– Gold ETF – SPDR:
• SPDR did not add holdings in the latest session → the gold market is waiting for December data.
• No large inflows → confirms a sideways, wait-and-see environment.
b) Geopolitics
• Middle East tensions have eased in the past 24 hours but are not fully resolved → no major gold volatility.
• Markets are watching the upcoming U.S.–EU diplomatic meeting on security issues.
c) Market Sentiment
• Current sentiment is mild risk-on, not strong.
• Risk-seeking investors are returning to equities but still keep a defensive allocation in gold → expectations for gold: sideways to slightly upward, not a strong decline.
2. Technical Analysis
– Trend:
• GOLD is moving sideways within the 4040 – 4115 range.
• RSI shows a mild bearish divergence, but not strong enough to create a downward trend.
– Key Levels:
• Major resistance: 4096 – 4125 – 4153
• Major support: 4050 – 4029 – 4000 (round number)
• Low volume → confirms a “hibernating market” as yesterday’s news was neutral.
– Projection for today:
• Gold is expected to continue ranging within 4040 – 4125 until a breakout later in the evening.
• High probability of retesting 4040–4050 before bouncing upward toward 4125, following the indicated arrow.
3. Yesterday’s Market
• GOLD moved within a sideways box pattern, repeatedly touching the top and bottom of the 4040–4100 range.
• No significant breakout occurred.
• Early top-picking and bottom-fishing trades were all “stop-hunted” both ways.
• Low liquidity at the end of the session → confirms the market is waiting for December data.
4. Trading Strategy for Today (Nov 21)
🪙SELL XAUUSD | 4147 - 4145
⚰️SL: 4153
⬆️TP1: 4137
⬆️TP2: 4129
🪙BUY XAUUSD | 4004 - 4006
⚰️SL: 3998
⬆️TP1: 4014
⬆️TP2: 4022

Spot + Hedge — The Fundamental Framework for Investors Who TradeYou don’t have to treat holding and trading as two separate worlds. The most effective market participants combine both. They anchor their strategy in long-term conviction while using short-term tools to manage volatility and protect capital. This balance allows them to participate in structural growth without exposing their portfolio to unnecessary drawdowns.
Spot holdings are the foundation. A well-built spot position compounds through cycles, absorbs volatility, and benefits from every wave of adoption that pushes the market forward. Staking adds an additional layer by generating yield during periods of consolidation. For traders who think in cycles rather than days, spot is the engine that keeps building value in the background.
A hedge position serves a different purpose. It is not designed for aggressive speculation. It is a tactical layer that reduces exposure when conditions become unstable. Futures shorts, when sized properly, act as a defensive tool that preserves the value of your long-term assets without forcing you to sell them. This approach keeps you invested while giving you room to breathe during sharp corrections.
When hedging makes sense:
– After a strong rally pushing into major resistance levels.
– When funding rates are extremely positive and the market is crowded with leveraged longs.
– When macro data shifts, liquidity tightens, or a regulatory event increases uncertainty.
– When your portfolio has grown significantly and you want to lock in part of that increase without taking profits.
The purpose of the hedge is stability. You are not aiming to turn the short into a profit engine. You are using it as portfolio insurance. A well-timed hedge limits the damage during pullbacks and keeps you positioned for the next leg of the cycle.
Simple implementation example: assume you hold $20,000 of ETH spot as your long-term allocation. To hedge, you short 25–30 percent of the position using ETH perpetual contracts. If ETH drops 10 percent, the hedge cushions the downside by generating gains on the short. If ETH continues rising, your spot position captures the upside and the hedge becomes the cost of protection, similar to an insurance premium.
This framework helps traders stay in the market, avoid emotional exits, and preserve capital during volatile periods. It combines conviction with discipline and gives long-term holders a practical way to navigate uncertainty without breaking their overall strategy.

CRUDE OIL (WTI): Bullish Move After Trap
There is a high chance that Crude Oil will pull back
from the underlined daily key level.
I see a confirmed bear trap followed by a bullish imbalance
candle on an hourly.
I expect a rise at least to 58.51 level.
❤️Please, support my work with like, thank you!❤️
I am part of Trade Nation's Influencer program and receive a monthly fee for using their TradingView charts in my analysis.

ES (SPX, SPY) Analysis, Levels, PA Forecast, Setups Fri (Nov 21)Analyzing Today’s Sharp Market Decline
The significant selloff observed today was not an arbitrary event. The day began with a robust rally following another impressive earnings report in the AI-chip sector, which propelled futures sharply upward and triggered a short squeeze in the Nasdaq. However, the release of a stronger-than-anticipated jobs report shifted the market's sentiment. While hiring showed signs of rebounding, the unemployment rate also ticked higher, undermining the prevailing narrative that the Federal Reserve would soon lower interest rates.
This development served as a stark reminder of the ongoing restrictive monetary policy, coupled with slowing economic growth and exorbitant valuations in the tech sector. Major investment funds capitalized on the morning’s strength in AI and large-cap stocks as an opportunity to reduce their risk exposure. Additionally, systematic trend-followers faced compulsion to sell once the S&P 500 fell below critical support levels.
The environment for high-beta assets, including cryptocurrencies, is already in a “reset” phase, which left little incentive for dip-buying at lower price points. As the E-mini S&P 500 futures broke through the previous day’s support levels, the situation escalated into a full liquidation. This perfect storm involved trapped long positions from the morning breakout, stop-loss orders falling into execution beneath yesterday’s lows, and mechanical selling, culminating in the largest intraday reversal since the spring.
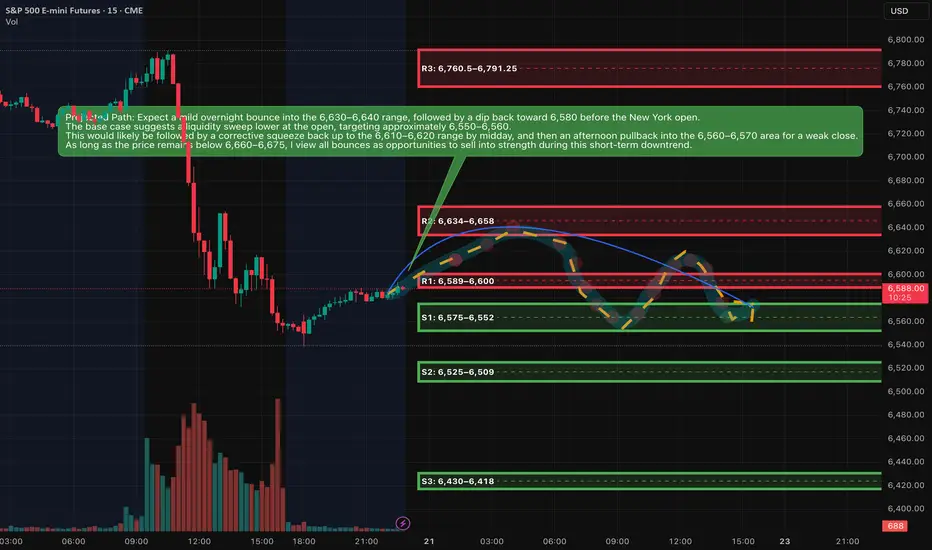
Market Outlook
The current market sentiment is skewed bearish as the ES remains entrenched below the critical 6,660 to 6,700 range. The price is hovering near a significant demand zone established around the lows of the previous trading day and today’s New York session. While we can expect some upward bounces, these movements appear to be temporary rallies within an ongoing downtrend, rather than indicators of a potential new upward leg.
Market Analysis: Is This the Beginning of a Downtrend or a Temporary Shakeout?
In the recent developments within the E-mini S&P 500 (ES) on the daily timeframe, we’ve observed the formation of a distinct lower high following the recent all-time peak. This shift has seen prices breach the last identified higher-low area, establishing a new narrative. The sequence has transitioned from a higher high to a lower high, culminating in a movement into prior demand zones marked by increased volume, all while momentum appears to be rolling over.
On the four-hour chart, the prevailing trend reflects a series of lower highs and lower lows. The recent selloff has further entrenched this trajectory into the discount zone, now signaling proximity to the next Fibonacci retracement target below.
While momentum indicators have already dipped from overbought conditions, they have not yet reached deeply oversold thresholds, indicating potential for another leg downward following any short-term corrective bounce.
From a broader perspective, the long-term trend remains positive; however, a short- to medium-term corrective phase appears to be in play. Today’s market dynamics suggest we may be in the midst of this corrective leg rather than witnessing the final downturn.
As prices have recently entered a significant demand zone, a bounce lasting one to three sessions—or a period of sideways consolidation—seems likely before any potential further decline.
In summary, while current conditions favor a move towards lower prices in the days ahead, the market likely anticipates a "lower after a bounce" scenario rather than an immediate and steep decline.
Key resistance zones
Resistance is written as bands, not single ticks.
R1: 6,589–6,600
This band sits around the current Asia-session high and the underside of today’s New York low. It is the first lid above price. If rallies stall here, the tape stays heavy and favors another test of the lows.
R2: 6,634–6,658
This is the main breakdown zone from today, centered around the New York afternoon high and the upper edge of the late-session range. As long as ES trades below this shelf, the short-term downtrend remains intact and every bounce is suspect.
R3: 6,760.5–6,791.25
This band covers the New York morning low-to-high range and the origin of the big sell leg. If price ever retests this area and fails, it is a prime region for larger swing shorts. Only sustained trade and closes above this pocket would suggest the current corrective leg is ending.
---
Key support zones
S1: 6,575–6,552
This is the immediate floor combining the Asia-session low, New York afternoon low, and prior-day value low. It is where we are effectively trading now. Expect reactive bounces and stop-runs here, as both sides are active.
S2: 6,525–6,509
This is the next downside magnet if S1 breaks cleanly. It aligns with a fib extension and 4-hour demand. A decisive move into this region would represent the next step down in the correction.
S3: 6,430–6,418
Deeper extension and prior higher-timeframe demand. If the correction matures into a more serious pullback over several sessions, this pocket becomes a reasonable medium-term downside destination.
A++ Setup 1 – Short from R2 supply (continuation short)
Direction: Short
Entry zone: 6,638–6,648
SL (hard stop): 6,678
TP1: 6,588
TP2: 6,552
TP3: 6,515
Invalidation (structure):
If we get a 15m full-body close above 6,675, treat the short idea as invalid and stand aside; market is likely shifting into a squeeze toward 6,700+ instead of extending the down leg.
---
A++ Setup 2 – Quick-reclaim long from S1 demand (counter-trend bounce)
Direction: Long
Entry logic: need a flush then reclaim
Entry zone (after reclaim): 6,562–6,568
SL (hard stop): 6,538
TP1: 6,610
TP2: 6,638
TP3: 6,660
Invalidation (structure):
If price breaks below 6,552 and 15m closes stay below 6,545 without a fast reclaim, the bounce idea is invalid; then you wait for the deeper S2 zone instead of forcing longs here.
Good Luck !!!
GOLD rises amid uncertain signals from US economyOANDA:XAUUSD continued to rise in Wednesday's session, as investors increased their holdings of safe-haven assets amid the delay of US employment data due to the government shutdown and the market prepared for the minutes of the Federal Reserve's October meeting.
As of the morning of November 20, spot gold was trading around $4,078/ounce, up about $11, or 0.27%, from the previous day.
Gold's rise coincided with the stabilization of global stocks after a sell-off related to concerns about artificial intelligence valuations. However, investor sentiment remained cautious ahead of Nvidia's business results and a series of US economic data due this week.
Weakening labor market signals support OANDA:XAUUSD
Data released on Tuesday showed the number of Americans receiving unemployment benefits rose to a two-month high in mid-October, a sign that the labor market may be losing momentum.
Against this backdrop, any signs of labor market weakness would reinforce expectations that the Fed may have to ease policy more quickly, providing support for gold, a non-yielding asset that benefits from lower interest rates.
Market focus: Fed minutes and delayed jobs data
Investors are turning their attention to the minutes from the Fed’s October meeting, due at 2 p.m. ET. Despite the 25 basis point cut at its most recent meeting, Chairman Jerome Powell continued to maintain a cautious stance, leaving open the possibility of a pause in easing if inflation risks return.
Separately, the September jobs report, delayed by the government shutdown, is due out on Thursday. This is seen as an early indicator of economic growth strength, with Reuters forecasting non-farm payrolls to rise by around 50,000 jobs.
Any weaker-than-expected figure could boost haven demand and continue to support gold prices.
Rising interest rate cut expectations, a key driver of OANDA:XAUUSD
According to CME FedWatch, the market now rates a 51% chance of the Fed cutting rates again at its next meeting, up from 46% in the previous session.
This increase in expectations is the core factor triggering capital flows to gold, in the context of falling real yields and investors looking for value preservation as the growth outlook becomes more uncertain.
TECHNICAL ANALYSIS AND SUGGESTIONS OANDA:XAUUSD
After recovering from the bottom around $4,000, gold price hit the 0.236 Fibonacci retracement at $4,128 and was immediately rejected, showing that profit-taking pressure is still strong.
• The main trend is still up, as the price is still in the medium-term uptrend channel and above the important MA line.
• The 3,972 area (Fib 0.382) is acting as short-term support, accompanied by the MA line right below around 3,942.
• Since it has not been able to break the 0.382 Fib level, gold is currently not in the best condition for a new uptrend.
RSI has rebounded but has not yet exceeded 60, showing that the buyers have not fully returned, but there are no signs of strong weakness.
SELL XAUUSD PRICE 4108 - 4106⚡️
↠↠ Stop Loss 4112
→Take Profit 1 4100
↨
→Take Profit 2 4094
BUY XAUUSD PRICE 3982 - 3984⚡️
↠↠ Stop Loss 3978
→Take Profit 1 3990
↨
→Take Profit 2 3996

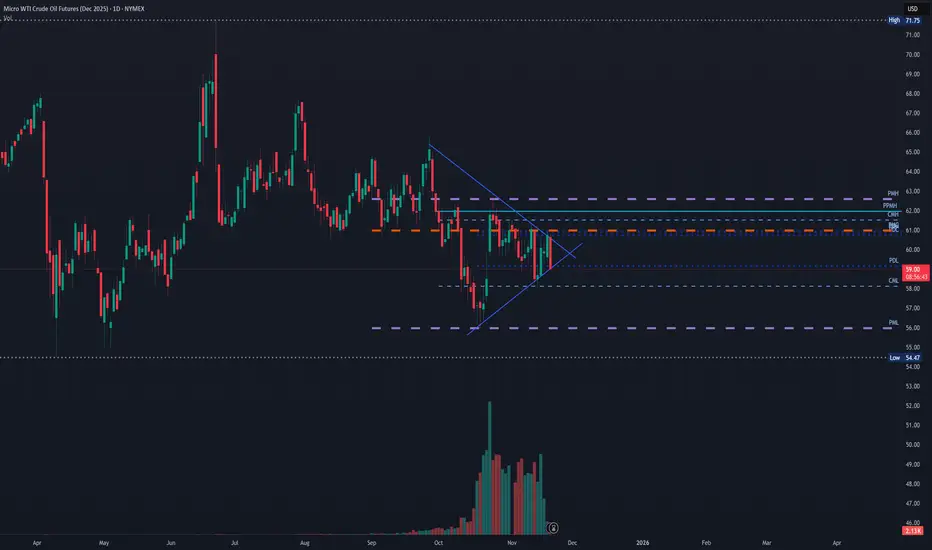
Triangle Pattern in Oil Futures
Does anyone else notice this short term triangle pattern on oil futures?
I will be watching for when it breaks one way or another but I am not that great at understanding oil movements.
If you have any insights, please share
Defensive money returns to GOLD as US labor data worsensOANDA:XAUUSD prices maintained a slight decline in the Asian session, trading around $4,075/ounce as the market turned its attention to the Fed meeting minutes. The upside momentum is weakening, but downside pressure remains limited as money flows continue to seek support from the prospect of easing policy.
New data from ADP reinforces the view that the US labor market is losing momentum. The private sector lost an average of 2,500 jobs a week in the four weeks to November 1, as a host of large companies from Amazon to Target announced plans to cut staff. A report from Challenger showed the number of planned layoffs in October was the highest in more than two decades. Jobless claims rose to 1.9 million, and data from the Cleveland Fed showed 39,000 layoff announcements last month.
These signals are emerging just as the market remains concerned about a weakening U.S. economy, even though expectations for rate cuts are not yet firmly established. Still, sentiment has shifted: the FedWatch tool now shows nearly a 50% probability of a rate cut at the Fed’s December meeting, up from below 40% earlier this week. This development has helped gold rebound after three consecutive losing sessions, especially since the precious metal typically benefits in a low-rate environment.
However, gold’s recovery remains relatively fragile. Prices fell more than 3% on Friday and dropped another 1% on Monday as expectations for Fed easing were revised. This has made the market more sensitive to signals from monetary policy and economic data.
The short-term focus is on the minutes of the late-October FOMC meeting and the upcoming nonfarm payrolls report, both to be released this week. Forecasts suggest U.S. job growth may slow to around 55,000 in September—a pace reflecting cooling hiring demand.
Several Fed officials have struck a more dovish tone. Governor Waller described the labor market as “weak” and noted that core inflation is moving closer to the 2% target. Richmond Fed President Thomas Barkin expects upcoming data to offer more clues on the direction of the economy. These comments, combined with the market’s interpretation of soft labor signals, are creating an environment in which each new data point has the potential to significantly impact gold pricing.
In my view, gold is likely to continue trading within a narrow range as the market awaits clearer confirmation from the Fed while simultaneously assessing the risks of a slowing U.S. economy. Rate-cut expectations remain the key factor supporting gold in the current phase.
Technical analysis and suggestions OANDA:XAUUSD
Recovery Trend and Conditions for a New Uptrend
This morning's developments show that gold prices are trying to recover after a long correction, with a bounce back to the $4,070/ounce area, corresponding to the lower border of the medium-term Ascending Channel.
The price structure has remained within the uptrend channel since August, but the momentum has weakened significantly after the price failed twice before the strong resistance zone of $4,216/ounce (Fib 0.236). The $3,972–$3,990/ounce (Fib 0.382) level continues to act as an important buffer zone, and the fact that the price did not break this zone in the recent decline is a positive signal.
RSI hit the oversold zone and is bouncing up, indicating that selling pressure is weakening and the market is entering a rebalancing phase.
For a new uptrend to form, it is necessary:
Necessary condition: price holds above 3,972 USD/ounce, remaining above the rising trend line of the price channel.
Sufficient condition: close above 4,128 USD/ounce and then confirm above 4,216 USD/ounce, the key resistance zone that determines the return to a strong uptrend.
Only when these two conditions are met, the medium-term uptrend structure will be fully restored.
SELL XAUUSD PRICE 4116 - 4114⚡️
↠↠ Stop Loss 4120
→Take Profit 1 4108
↨
→Take Profit 2 4102
BUY XAUUSD PRICE 4025 - 4027⚡️
↠↠ Stop Loss 4021
→Take Profit 1 4033
↨
→Take Profit 2 4039

GOLD MARKET ANALYSIS AND COMMENTARY - [Nov 17 - Nov 21]Last week, OANDA:XAUUSD prices rose from $3,999/oz to $4,245/oz, but then fell sharply to $4,032/oz and closed the week at $4,084/oz.
The reason gold prices rose sharply last week after news of the US government reopening was because White House press secretary Karoline Leavitt said the Bureau of Labor Statistics (BLS) may never release October employment and inflation data because the federal government was shut down during this period, not doing statistical work. These comments put the USD under selling pressure, pushing gold prices above $4,200/oz.
However, hawkish comments from Fed officials later pushed gold prices down sharply to $4,032/oz. Specifically, St. Louis Fed Governor Alberto Musalem said that the labor market is expected to remain at near full employment and the Fed needs to be cautious in operating monetary policy at this time. Meanwhile, Minneapolis Fed Governor Neel Kashkari emphasized that inflation is still too high, meaning the Fed should pause interest rate cuts.
The sharp decline in market expectations of a Fed rate cut in December may continue to have a negative impact on gold prices in the short term. However, gold prices will hardly fall sharply as macro risks and geopolitical conflicts persist and central banks’ demand for gold continues to increase.
📌According to technical analysis, the support level for gold prices next week is at 3,930 USD/oz. If it holds above this level, gold prices will continue to hover around 4,000 USD/oz in the short term. However, if gold prices fall below this level next week, they may fall to the 3,800 USD/oz area.
SELL XAUUSD PRICE 4176 - 4174⚡️
↠↠ Stop Loss 4180
BUY XAUUSD PRICE 3949 - 3951⚡️
↠↠ Stop Loss 3945

Price moves in a very specific way...In this short video I go through a bit of lower timeframe price action on the ETH futures chart.
Yeah, it is pretty straight forward and is just another example of price moving in terms of liquidity, efficiency, and fair value on a fractal nature.
R2F Trading

a QuickScalp on #USDJPY 📌 Market Insight: {#USDJPY }
⚠️ Risk Assessment: {High}
🚀 Approach:
Same as GJ , Don't Rush ... need valid momentum Structure and LTF entry ... need it !
#Ash_TheTrader #Forex #GBPJPY #MarketAnalysis #TradingSetup #RiskManagement #GOLD #Scalper #NQ #EURUSD

GOLD volatility, monetary policy and political riskThe global OANDA:XAUUSD went through a volatile trading session on Tuesday, as prices fell more than $50 in the North American session before recovering around $30, ending the day in the green. As of Wednesday morning, November 12, spot gold stood at around $4,128/ounce, up around $2 on the day.
The main drivers of this development came from two opposing factors: the prospect of the Federal Reserve (Fed) possibly cutting interest rates in December, and capital withdrawals from gold ETFs after a long rally.
Policy pressures and labor market signals
U.S. private payrolls data, according to preliminary estimates from ADP Research, showed a weekly average of 11,250 job cuts in the four weeks ended October 25. The weaker-than-expected figure sent the dollar to a low of 99.29, giving gold a chance to rebound.
The move comes just as Washington is about to end its longest government shutdown in history, which has stalled the release of economic data. Investors are hoping the reopening of the government will quickly bring a wave of pent-up data that will help better determine the true state of the U.S. economy.
“As the government reopens, we’re going to start seeing more cracks in the economy,” said Marc Chandler, chief strategist at Bannockburn Global Forex. This expectation reinforces the belief that the Fed will begin its easing cycle in December. According to the CME FedWatch tool, the probability of a rate cut has risen to 64%, while Fed Governor Milan hinted at the possibility of a 50 basis point cut due to a weak labor market and slowing inflation.
ETF Profit Taking, Gold Temporarily Adjusts
However, gold’s rally was capped by profit-taking in the ETF market. Bloomberg data shows gold ETFs have seen four straight weeks of outflows, after eight weeks of net buying. “Every 1% move in the gold price translates into about 10 tonnes of ETF outflows,” said Michael Haigh, head of FIC research at Société Générale.
The reversal reflects investors’ defensive sentiment after gold peaked at $4,380 an ounce in mid-October, a new record high amid political uncertainty and expectations of lower interest rates. Still, safe-haven demand was strong enough to help prices recover to $4,126.77 by the end of Tuesday’s session, up 0.3%.
US Politics: A lull ahead of data
The US Senate has passed a deal to reopen the government, while the Republican-controlled House is expected to approve it this week, before it goes to the White House for President Trump to sign into law. The reopening of the government not only ends the government shutdown but also sets the stage for a new cycle of data releases, including official jobs and inflation reports.
Medium-term outlook: Gold demand remains strong
Despite short-term volatility, fundamentals remain supportive of gold. The precious metal has risen more than 55% year-to-date, on track for its biggest gain since 1979. “The medium-term support from global easing to central bank demand remains intact,” said Christopher Wong, a strategist at OCBC.
Summary
The gold market is operating in a cycle of monetary policy expectations and geopolitical safe-haven sentiment. As the Fed moves closer to easing and delayed data looms, price volatility is likely to remain high.
However, with sustained central bank buying and global risks remaining intact, gold remains a strategic asset in a reshaping global financial landscape.
Technical analysis OANDA:XAUUSD
Gold prices are maintaining a short-term uptrend channel formed from the October bottom. After a deep correction around $3,970 – $3,850/ounce (corresponding to the Fibonacci levels of 0.382 and 0.5), the price has bounced back and is currently trading around $4,123, close to the technical resistance zone of Fib 0.236 at $4,128.
The moving average (MA21) is currently at $4,055, acting as a dynamic support zone in the short term. The recent candlestick structure shows that the bullish momentum is being consolidated with a series of higher lows, while the RSI has recovered towards 55, confirming that the bullish momentum is regaining the upper hand.
If gold holds above the $4,055 zone, the next upside targets are:
• Near resistance: $4,216 – $4,220 (psychological level and 0.236 Fibonacci resistance zone).
• Extended resistance: $4,308 – $4,380 (historic old peak zone).
On the contrary, if the price loses $4,055, the $3,972 – $3,846 zone will become the main support zone to watch, corresponding to the lower boundary of the current uptrend channel.
The overall trend remains bullish, provided the $4,055 support zone holds. The current phase is a recovery accumulation phase, which could open up a further rally towards $4,300 if US economic data continues to be weak and the Fed reinforces easing expectations.
SELL XAUUSD PRICE 4201 - 4199⚡️
↠↠ Stop Loss 4205
→Take Profit 1 4193
↨
→Take Profit 2 4187
BUY XAUUSD PRICE 4090 - 4092⚡️
↠↠ Stop Loss 4086
→Take Profit 1 4098
↨
→Take Profit 2 4105
Good zones o work with, nasdaq 11-11-25Low volume nodes and gaps, usually are good zones to work with.

$YM | "Resistance" Zone, or low key breakout area? Let's analyzeToday, we discuss some nuance, so put on your analyst hats and let's dive in!

GOLD surpasses $4,140/ounce, signaling a new cycleOANDA:XAUUSD continued to climb in the Asian session on November 11, trading around $4,148/ounce, up $32 in the morning alone, after rising nearly 3% in the previous session. The two-day rally, the strongest since May, reflects the defensive sentiment of global investors in the face of a weakening US economic outlook and the possibility of the Federal Reserve (Fed) soon shifting monetary policy.
Bloomberg said gold maintained its gains after the US Senate approved a bipartisan deal to end the longest government shutdown in history, supported by President Donald Trump. The bill is expected to pass the House of Representatives this week by a 60-40 vote, paving the way for the resumption of work for hundreds of thousands of federal workers and stalled food aid.
The political situation has eased somewhat, but investors remain cautious. The reopening of the government means that a slew of delayed economic data will soon be released, which could shed more light on the growth picture. Bloomberg analysts said the upcoming data “are likely to show a worsening economic outlook,” reinforcing expectations for a Fed rate cut sooner than expected.
The probability of a 25 basis point cut in December is now above 65%, according to CME's FedWatch tool. Falling bond yields and a weak dollar have pushed money back into gold, the traditional safe haven, especially as the global rate-hike cycle ends and US fiscal risks emerge.
In the international market, gold is still up more than 50% since the beginning of the year, despite a short-term correction last month. Net buying from central banks, especially in Asia and the Middle East, and increased physical gold investment in the private sector, continue to be the core drivers for the prolonged bull cycle.
Commentary: Gold’s Return as a Barometer of US Economic Confidence
Gold’s November rally was more than a short-term political response. It reflected a deeper shift in global market sentiment: that the US dollar is losing its primacy amid rising debt, fiscal spending and domestic political divisions.
While U.S. stock markets hover around historic highs, institutional investors are beginning to rebalance their portfolios in a defensive direction, increasing their exposure to precious metals and government bonds. At the same time, central banks in China, India and Turkey continue to accumulate gold, a move that makes both financial and geopolitical sense, as they seek to reduce their dependence on the dollar payment system.
If the Fed does ease later in the year, gold could consolidate above $4,000 an ounce as a new price level, while risk assets face correction pressure. In an era where U.S. financial stability is no longer a given, the precious metal is returning to its old role as a gauge of confidence in the U.S. currency and government.
Technical analysis OANDA:XAUUSD
Gold prices are consolidating above the $3,970–$3,850/oz support zone, after bouncing back from the 0.382 Fibonacci line ($3,972) and remaining within the rising price channel (channel a) formed since July. The price structure suggests that a correction has been completed, as the recovery in buying pressure pushed the price above the short-term MA around $4,055, towards the 0.236 Fibonacci level at $4,128, which is currently a key short-term resistance zone.
The RSI has recovered from the 40 zone to near 60, indicating a return of bullish momentum, while recent daily candles have all closed above the medium-term uptrend line. A firm close above $4,130 could confirm the bullish trend, opening a new bullish cycle with the next target at $4,216, and further to the $4,380/oz zone, the upper end of the current price channel. Conversely, a loss of $3,940 would weaken the bullish structure and send gold back to the $3,850–$3,870 accumulation zone.
• Observation:
Gold is showing signs of forming a new base above the $4,000 area, reinforcing the scenario of a medium-term bullish cycle if it breaks the $4,130 resistance. Short-term profit-taking pressure may appear, but the main trend is currently leaning positive in the second half of November.
SELL XAUUSD PRICE 4180 - 4178⚡️
↠↠ Stop Loss 4184
→Take Profit 1 4172
↨
→Take Profit 2 4166
BUY XAUUSD PRICE 4088 - 4090⚡️
↠↠ Stop Loss 4084
→Take Profit 1 4096
↨
→Take Profit 2 4102
