Key support at 1.3330, bulls eye 1.3570-1.3630The British pound is trading at a turning point, with futures consolidating after rebounding from late-September lows. The Fed’s shift toward potential rate cuts contrasts with the Bank of England’s reluctance to ease, giving sterling short-term support while leaving medium-term risks intact. Technically, the market is confined within a clear corridor, while sentiment signals remain mixed: retail traders are largely short, a contrarian bullish sign, whereas institutional flows are split between asset managers and leveraged funds. Options activity adds another dimension, with heavier open interest in puts but greater premium flows into calls, creating an area of attraction around 1.3450–1.3550. Taken together, these factors suggest a market in balance, with the next decisive move likely to come from a break outside this range.
Fundamental Analysis
The current GBP/USD dynamics are largely driven by the policy divergence between the Federal Reserve and the Bank of England, against a backdrop of U.S. political uncertainty and the UK’s fiscal constraints.
On the U.S. side, the Fed has maintained a restrictive stance, but market expectations are shifting toward two rate cuts by the end of 2025, supported by cooling inflation and signs of slower activity. The looming U.S. government shutdown has added volatility, but overall it tends to weigh on the dollar in the near term.
In contrast, the Bank of England remains constrained by persistent inflation, particularly in services and food, leaving little room to consider rate cuts in the short run. Recent BoE commentary indicates that rates are likely to stay elevated for longer, even as UK growth shows signs of weakness.
In essence, the Fed appears to be moving toward a more accommodative path while the BoE maintains a hawkish bias to contain inflation. This divergence supports sterling in the short term. However, the UK still faces structural headwinds such as a large current account deficit and fiscal pressures, which could cap medium-term upside for the pound.
Technical Analysis
On the December contract, the technical structure remains dominated by a wide congestion area around 1.3440, identified as a key volume control point. As long as prices hold above this level, the bias remains moderately positive, supported by visible buying volume on recent rebounds. Immediate resistance stands at 1.3490–1.3525, which corresponds to the 100-DMA on spot and the 50% retracement of the 1.3726–1.3324 move. Beyond that, the 1.3570–1.3630 area (61.8% Fib and upper Bollinger band) marks the next critical barrier. On the downside, 1.3425 and especially 1.3330 (September 25 low) act as major supports: a break would reopen a bearish bias toward 1.3260. In summary, the immediate trend remains fragile but constructive, with direction hinging on a decisive breakout above 1.3525.
Sentiment Analysis
Sentiment on GBP/USD remains mixed across market participants. Among FX/CFD brokers, around two-thirds of retail traders are short, which sends a contrarian signal leaning bullish in the short term. However, COT data shows the opposite picture: asset managers hold a significant net short position (-44,909), reflecting structural caution toward the UK’s economic and fiscal outlook, while leveraged funds maintain a net long position (+27,662), betting more on tactical rebounds. This divergence between retail, speculative, and institutional flows creates a polarized market, prone to volatility spikes.
Options Activity
On the current expiry, option activity shows an interesting contrast. Open interest is heavier on the put side, highlighting demand for downside protection. However, in terms of premiums paid, calls clearly dominate, suggesting traders are willing to spend more to capture potential upside. The densest clusters of open interest are found around 1.3350–1.3400 for puts and 1.3450–1.3550 for calls, creating a key technical corridor. In short, the market keeps safety nets in place against a drop, but the premium flows reveal a moderate bullish bias, with expectations leaning toward further gains if spot holds above 1.3450.
Trade Idea
Direction: Long GBP futures (6BZ5) while above 1.3450
Entry Zone: 1.3460–1.3480, just above the key support cluster
Take Profit (TP1): 1.3570, aligning with 61.8% Fib retracement and option OI cluster
Take Profit (TP2): 1.3630, upper Bollinger band and stronger resistance zone
Stop Loss (SL): Close below 1.3330, which invalidates the support and reopens the 1.3260 risk
Final Thoughts
Sterling futures are at an important crossroads, caught between supportive short-term dynamics and persistent structural headwinds. On the fundamental side, the dollar’s softer tone, driven by expectations of Fed rate cuts, has provided the pound with breathing space, while the Bank of England’s reluctance to ease keeps policy divergence working in sterling’s favor. Technically, however, the market remains capped by heavy resistance around 1.3570–1.3630, a zone reinforced by Fibonacci levels, moving averages, and historical supply. Sentiment adds to the mixed picture: retail traders leaning short point to contrarian upside risk, but institutional positioning highlights lingering caution. Meanwhile, options activity reveals a market hedged against downside but increasingly willing to pay for upside exposure, anchoring prices in a corridor between 1.3450 and 1.3550.
In this environment, sterling’s path will likely be shaped by which side of this corridor breaks first. Until then, buying dips above 1.3450 with disciplined stops offers the cleaner tactical play.
---
When charting futures, the data provided could be delayed. Traders working with the ticker symbols discussed in this idea may prefer to use CME Group real-time data plan on TradingView: tradingview.com/cme/ .
This consideration is particularly important for shorter-term traders, whereas it may be less critical for those focused on longer-term trading strategies.
General Disclaimer:
The trade ideas presented herein are solely for illustrative purposes forming a part of a case study intended to demonstrate key principles in risk management within the context of the specific market scenarios discussed. These ideas are not to be interpreted as investment recommendations or financial advice. They do not endorse or promote any specific trading strategies, financial products, or services. The information provided is based on data believed to be reliable; however, its accuracy or completeness cannot be guaranteed. Trading in financial markets involves risks, including the potential loss of principal. Each individual should conduct their own research and consult with professional financial advisors before making any investment decisions. The author or publisher of this content bears no responsibility for any actions taken based on the information provided or for any resultant financial or other losses.
Futuresleap

Money on the table ahead of the FedEUR/USD is once again in the spotlight as the Federal Reserve prepares to meet this week. The backdrop is a perceived convergence between Fed and ECB rate paths, narrowing a differential that had long favored the dollar. The euro has regained lost ground after the summer, trading around strategic levels supported by a more balanced macro environment and relative eurozone resilience. A combined reading of fundamentals, technicals, sentiment, and options flows helps refine potential scenarios for the weeks ahead.
Fundamental Analysis
Two main narratives drive EUR/USD. On the U.S. side, inflation has remained stickier than expected. The August CPI rose +0.4% m/m, pushing headline inflation to 2.9% and the core to 3.1%. This persistence reflects tariff- and food-driven pressures, leaving the Fed juggling inflation control with signs of weakening in the labor market. Job creation has slowed, and unemployment claims have edged higher, complicating the policy mix.
Markets expect a 25bp rate cut in September, which would mark the start of a cautious easing cycle. Beyond that, uncertainty dominates: some see another move before year-end, others expect a pause as the Fed reassesses inflation and growth dynamics.
In Europe, the ECB has held its deposit rate steady at 2%, underscoring that disinflation is in progress while acknowledging inflation will remain slightly above target in 2025 (2.1% forecast). President Christine Lagarde described the economy as “in a good place,” lowering the likelihood of aggressive cuts. As a result, the policy spread between the Fed and ECB is shrinking, undermining the dollar’s yield advantage and lending structural support to the euro.
Technical Analysis
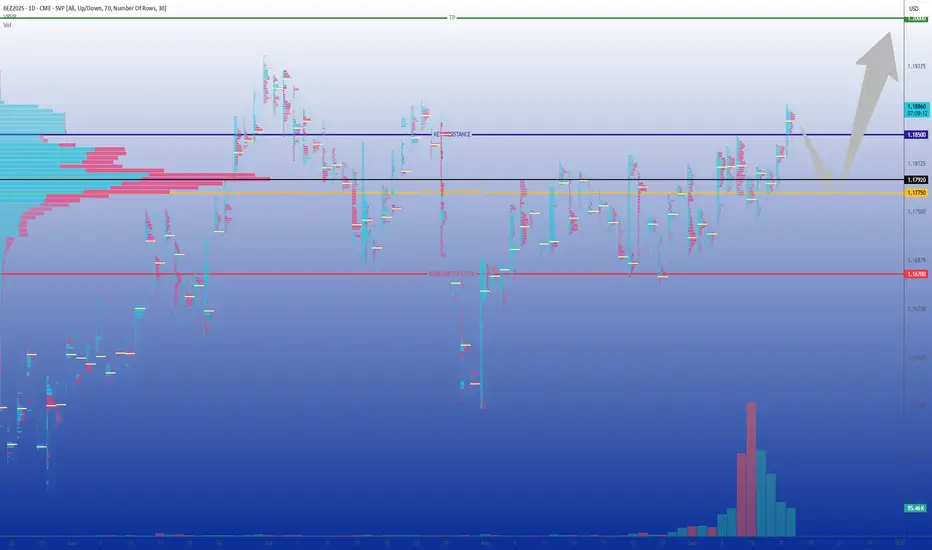
The December 2025 Euro FX futures contract (6EZ5) is currently challenging resistance at the upper boundary of a tight 1.1650–1.1850 range. The volume profile highlights a dense cluster between 1.1775 and 1.1800, forming key short-term support. As long as this zone holds, the technical bias leans higher.
A clean break above 1.1850 would likely accelerate momentum toward the psychological 1.20–1.2050 zone, already cited by technical analysts as the next upside target.
On the downside, 1.1670 is the pivot for validation. A sustained move below would undermine the bullish scenario and risk a return toward sub-1.1600 levels. For now, however, support continues to attract buyers, keeping the uptrend intact.
Sentiment Analysis
Broker positioning data shows retail traders remain heavily short EUR/USD, a contrarian indicator favoring further gains. Importantly, the rally is not built on a fragile short squeeze but on steady accumulation, which makes it more sustainable.
Commitments of Traders (COT) reports reinforce this: asset managers remain long euro, dealers are short for hedging, and leveraged funds sit closer to neutral. Institutional flows, in other words, lean supportive.
Low implied volatility further highlights the lack of market conviction in a sharp downside break. Investors appear more concerned with missing an upside move than with protecting against euro weakness, which strengthens the bullish tilt.
Options Activity
In the OTC market, risk reversals are slightly skewed in favor of euro calls, suggesting more demand for upside protection. This fits neatly with both fundamentals and positioning.
At the CME, open interest paints a similar picture:
A Put/Call ratio tilted toward calls
Heavy concentrations at 1.1800 and 1.1850 strikes, creating upward magnetism
Limited put interest between 1.1650–1.1700, only relevant if spot weakens sharply
Low implied volatility, signaling no expectation of outsized moves before the Fed meeting
Altogether, this suggests that 1.1850 is the immediate gravitational level, with room for extension toward 1.20 if momentum persists.
Trade Idea: Long 6EZ5
Directional setup:
Entry: Buy on dips toward 1.1775
Invalidation: Close below 1.1670
Take Profit: 1.1975–1.2000 (psychological milestone and measured target)
This strategy combines institutional support visible in COT reports, option flows skewed toward the upside, strong technical zones, and narrowing Fed–ECB spreads that erode the dollar’s advantage.
Final Thoughts
The Fed’s September decision is more than a routine policy update. It could mark a turning point for global FX dynamics. U.S. inflation remains uncomfortably sticky, but weakening jobs data points toward gradual easing. In contrast, the ECB is signaling stability and relative confidence. This policy convergence narrows the rate gap, historically a pillar of dollar strength, and bolsters the medium-term case for euro appreciation.
Technically, the market is consolidating above robust support levels, while sentiment indicators and option positioning both lean bullish. The December 2025 contract captures this balance: a market with strong foundations, low volatility expectations, and option flows pointing toward a breakout higher.
The key tactical question is whether the Fed provides enough dovish tone to unlock the upside. If EUR/USD breaks decisively above 1.1850, momentum toward 1.20 could unfold quickly. In the short term, caution is warranted heading into the FOMC, but unless an external shock emerges, the combined weight of fundamentals, technicals, and sentiment continues to argue for a stronger euro in the weeks ahead.
---
When charting futures, the data provided could be delayed. Traders working with the ticker symbols discussed in this idea may prefer to use CME Group real-time data plan on TradingView: tradingview.com/cme/ .
This consideration is particularly important for shorter-term traders, whereas it may be less critical for those focused on longer-term trading strategies.
General Disclaimer:
The trade ideas presented herein are solely for illustrative purposes forming a part of a case study intended to demonstrate key principles in risk management within the context of the specific market scenarios discussed. These ideas are not to be interpreted as investment recommendations or financial advice. They do not endorse or promote any specific trading strategies, financial products, or services. The information provided is based on data believed to be reliable; however, its accuracy or completeness cannot be guaranteed. Trading in financial markets involves risks, including the potential loss of principal. Each individual should conduct their own research and consult with professional financial advisors before making any investment decisions. The author or publisher of this content bears no responsibility for any actions taken based on the information provided or for any resultant financial or other losses.
Volatility at rock bottom: is a straddle the right move?Markets often fall into a familiar seasonal pattern. As summer advances, trading volumes thin out, implied volatility fades, and investors drift into a sense of calm. Yet history shows that this period of tranquility rarely lasts. September and October have traditionally been months of renewed turbulence, often catching complacent investors off guard.
With implied volatility currently trading at depressed levels, option premiums are effectively “on sale.” This creates an attractive window for strategies that do not rely on predicting direction but instead position for the return of volatility. Chief among them is the straddle.
What exactly is a straddle?
A straddle is one of the simplest volatility strategies in options markets. It involves buying both a call and a put option with the same strike price and expiration date. The payoff structure is straightforward:
If the underlying asset rises sharply, the call option gains.
If the underlying falls, the put option benefits.
If the market stagnates, the loss is limited to the combined premium.
This makes the straddle an efficient way of “buying volatility.” The key appeal is that it does not require choosing a direction, only anticipating that the market will eventually move.
The calm before the storm
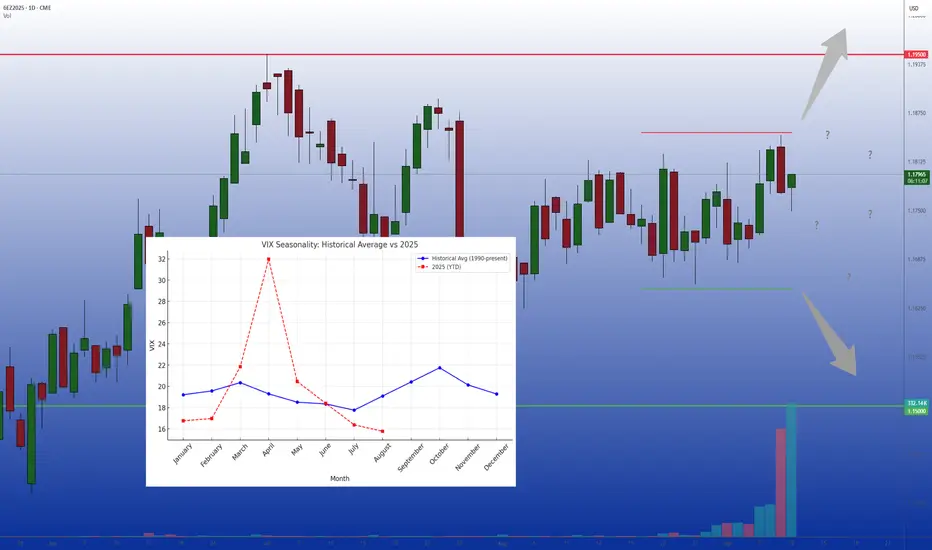
History provides a strong case for seasonality in volatility. Since 1990, the VIX has tended to bottom in June and July before rebounding in September and peaking in October.
The year 2025 has so far mirrored this cycle. After a turbulent spring, summer brought an unusually long stretch of calm. By July, implied volatility had retreated to some of the lowest comfort levels in years. But if history is any guide, such stability is more a pause than a new equilibrium.
Foreign exchange markets show a similar pattern. The CVOL G5 FX index, tracking implied volatility on Euro, Pound, Yen, Australian Dollar, and Canadian Dollar futures, often displays sharp bursts of activity around macro or geopolitical shocks, followed by prolonged lulls. The current quiet looks very much like another such lull.
Why low IV matters
Implied volatility is the primary input in option pricing. When IV is low, option premiums fall; when IV rises, those same contracts become far more expensive. This makes timing important.
An August straddle is usually cheaper than one initiated in September. Buying optional exposure now means paying a “discounted” premium while retaining the potential to benefit from a rebound in volatility during the fall.
No need for directional bets
One of the main attractions of the straddle is that it removes the need to guess direction.
For example, an investor might think: “I am unsure whether the euro will rise or fall against the dollar, but I doubt that the summer calm will last.” In such a scenario, a straddle is more appropriate than a directional trade. It captures volatility regardless of the outcome and provides insurance against unexpected moves.
FX as a natural playground
Equity markets tend to see volatility spikes alongside price declines, but in FX, volatility is far more symmetric. Currency pairs often experience sharp swings in either direction, sometimes triggered by small catalysts such as a central banker’s remark or a surprise data print.
Let’s take the Euro FX contract, December expiry. The price has remained close to 1.175 throughout the summer, but several catalysts could easily break the range in the fall: diverging central bank policies, U.S. protectionist measures, or geopolitical events. Any of these could quickly shift the balance between currencies and force institutional rebalancing.
Because FX markets often move from extended ranges to sudden breakouts, they provide fertile ground for straddle strategies. The investor is not required to predict the breakout direction, only to position for its likelihood.
Another important consideration: listed FX options, such as those traded on CME, generally offer more transparency, standardization, and often lower costs compared with over-the-counter (OTC) FX options. Exchange-traded contracts provide clearer pricing and robust clearing, which makes them particularly well-suited for volatility strategies where premium efficiency matters.
Lessons from seasonality
Volatility is cyclical. Calm phases almost always give way to periods of agitation, sometimes even panic. Over the past 35 years, September has consistently marked a turning point, as investors return from summer breaks and refocus on economic data, central bank policy, and geopolitical events.
The summer of 2025 is no exception. Option premiums are unusually cheap, reflecting a market that assumes the calm will last. But history suggests otherwise. For those who believe turbulence will return, strategies like the straddle offer a simple and cost-efficient way to prepare.
Final thoughts
Complacency is one of the market’s most dangerous traps. While quiet markets encourage investors to lower their guard, volatility rarely stays low for long. With option premiums currently discounted, the coming weeks present an attractive window to position for a return of market movement.
By emphasizing magnitude over direction and by favoring listed options for their transparency and efficiency, the straddle remains one of the most compelling ways to approach the seasonal shift.
---
When charting futures, the data provided could be delayed. Traders working with the ticker symbols discussed in this idea may prefer to use CME Group real-time data plan on TradingView: tradingview.com/cme/ .
This consideration is particularly important for shorter-term traders, whereas it may be less critical for those focused on longer-term trading strategies.
General Disclaimer:
The trade ideas presented herein are solely for illustrative purposes forming a part of a case study intended to demonstrate key principles in risk management within the context of the specific market scenarios discussed. These ideas are not to be interpreted as investment recommendations or financial advice. They do not endorse or promote any specific trading strategies, financial products, or services. The information provided is based on data believed to be reliable; however, its accuracy or completeness cannot be guaranteed. Trading in financial markets involves risks, including the potential loss of principal. Each individual should conduct their own research and consult with professional financial advisors before making any investment decisions. The author or publisher of this content bears no responsibility for any actions taken based on the information provided or for any resultant financial or other losses.
BoJ firmness and Fed pivot set stage for yen recoveryThe Japanese yen is currently trading in a strategically important zone. It remains historically weak but is closely monitored by Japanese authorities as USD/JPY hovers just below the symbolic 150 level. For swing traders, the challenge is to determine whether the currency can mount a lasting rebound, as fundamentals and sentiment have become less one-sided than in recent years.
Fundamental analysis
The yen’s path remains primarily shaped by monetary policy divergence. In the U.S., recent data point to slowing momentum: the latest jobs report revealed weaker hiring and downward revisions, while inflation signals remain mixed. Chair Jerome Powell confirmed at Jackson Hole that the central bank is preparing to lower interest rates in September, with a strong likelihood of a 25 basis point cut (probability > 85% according to CME FedWatch Tool).
Japan presents a contrasting stance. The Bank of Japan has adopted a firmer tone than in the past decade. Governor Kazuo Ueda stresses the importance of wages and employment in sustaining inflation, suggesting that another hike could occur before year-end. With Tokyo CPI still above the central bank target, the BoJ’s hawkish bias is becoming more credible. This change narrows the policy gap with the U.S.
The yen’s traditional role as a funding currency is also under pressure. Narrowing rate differentials and a less accommodative BoJ reduce the appeal of the carry trade. More importantly, the threat of intervention lingers. In 2022, Tokyo intervened when USD/JPY crossed 150. With spot near 148, a break of that threshold could once again invite official action. This risk serves as both a psychological and practical ceiling for dollar strength against the yen.
Taken together, fundamentals are no longer uniformly bearish.
Technical analysis
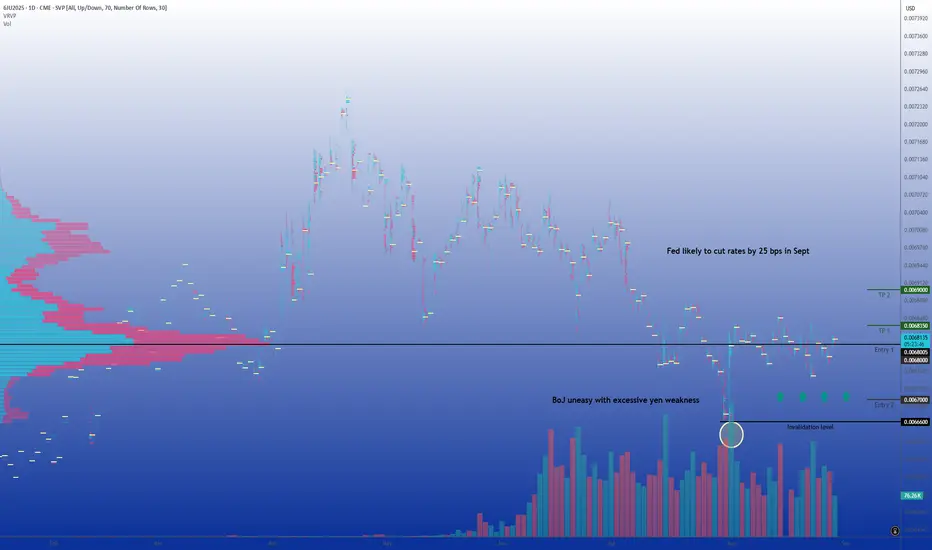
On the J6U5 daily chart, the broader trend remains bearish for the yen, but since early August the contract has shifted into consolidation.
The volume profile highlights a value area concentrated between 0.00678 and 0.00680, confirming this range as the market’s equilibrium. Below 0.00676, liquidity is thin, leaving the market vulnerable to a swift drop toward 0.00670 if support gives way. Conversely, a sustained break above 0.00684 would validate renewed yen strength, with an upside projection toward 0.00690.
Resistance lies clearly between 0.00683 and 0.00685, zones of congestion that make gains difficult without a trigger. This structure offers swing traders clear markers and the narrow corridor suggests that the next breakout could be meaningful.
Market sentiment
Retail positioning data shows a clear consensus against the yen, with a majority of individual traders long USD/JPY (therefore short yen). This consensus is exposed to a squeeze, particularly since most of these long USD/JPY positions are losing money, weakening traders and increasing the risk of forced unwinds.
According to the CFTC COT report, asset managers are on the opposite side, tending to be net buyers of yen.
CME and OTC options
Options data underline the gravity of 0.00680. On CME, open interest is concentrated at this strike, with additional clusters between 0.00675–0.00677 and 0.00683–0.00685. This reinforces the current corridor structure.
The spot market provides similar signals. Large expiries are clustered between 147.50 and 148.00 USD/JPY, amounting to nearly 3.3 billion dollars in contracts this week. These expiries act as magnets for spot price action and serve as a cap on near-term upside. Until they roll off, traders should expect range-bound behavior around current levels.
Trade idea
In this context, a swing strategy favoring yen strength is justified. The plan would be to buy J6U5 on dips: half the position near 0.00680 and the other half closer to 0.00670 if retested.
Invalidation comes on a daily close below 0.00666, which would negate the bullish scenario and reopen the path toward further yen weakness. On the upside, the first objective is 0.00683–0.00684, the upper bound of the current range. With a catalyst such as dovish Fed guidance, hawkish BoJ comments, or verbal intervention from Tokyo, the move could extend toward 0.00690.
The setup provides a clear risk/reward structure: limited downside defined by support, while upside benefits from the vulnerability of consensus short positions.
Final thoughts
The J6U5 contract sits at a delicate equilibrium. Fundamentals are slowly turning less unfavorable to the yen as the Fed prepares to ease, the BoJ strikes a firmer tone, and intervention risk limits dollar upside. Technically, the contract trades in a well-defined range, with 0.00680 as pivot. Sentiment shows retail consensus against the yen, while institutional positioning and options data point to potential cracks in that view.
Combining these factors, a swing-long yen strategy on dips is justified. The base case is for a rebound toward 0.00684 and possibly 0.00690 if catalysts materialize. The potential for recovery is real, though discipline is essential: the broader bearish trend will not be reversed until resistance levels are broken. For swing traders, the opportunity lies in anticipating this tactical rebound, positioning ahead of a possible market rebalancing in favor of the yen.
---
When charting futures, the data provided could be delayed. Traders working with the ticker symbols discussed in this idea may prefer to use CME Group real-time data plan on TradingView: tradingview.com/cme/ .
This consideration is particularly important for shorter-term traders, whereas it may be less critical for those focused on longer-term trading strategies.
General Disclaimer:
The trade ideas presented herein are solely for illustrative purposes forming a part of a case study intended to demonstrate key principles in risk management within the context of the specific market scenarios discussed. These ideas are not to be interpreted as investment recommendations or financial advice. They do not endorse or promote any specific trading strategies, financial products, or services. The information provided is based on data believed to be reliable; however, its accuracy or completeness cannot be guaranteed. Trading in financial markets involves risks, including the potential loss of principal. Each individual should conduct their own research and consult with professional financial advisors before making any investment decisions. The author or publisher of this content bears no responsibility for any actions taken based on the information provided or for any resultant financial or other losses.
Tactical Short Setup on EURThe September 2025 Euro FX futures contract (E6U25) is currently trading around 1.1440 after topping out near 1.19 the 1st of July. This decline reflects a broader market repricing, driven by evolving expectations around monetary policy from the Federal Reserve and the European Central Bank, softening Eurozone growth prospects, and a technical backdrop that has turned decisively bearish. Coupled with shifts in sentiment and options market positioning, the current setup presents an opportunity to initiate a tactical short with an attractive risk-reward profile.
Fundamental Analysis – Central banks and diverging momentums
Monetary policies on either side of the Atlantic appear to diverge. The Federal Reserve has kept its federal funds rate steady in the 4.25%–4.50% range since December 2024, resisting political pressure to ease. In contrast, the European Central Bank has gradually lowered its deposit rate from 4% to 2.00% since mid-2024 and maintained that level in July, considering inflation is now back to its 2% target. This has widened the yield differential in favor of the U.S. dollar.
Forward guidance from both central banks suggests a cautious stance. The Fed’s June 2025 dot plot anticipates a modest rate cut by year-end, though FOMC members remain divided. Meanwhile, the ECB projects subdued inflation and modest growth, implying no urgency for further easing.
On the macro front, U.S. GDP rebounded sharply in Q2 (+3.0% annualized), though driven largely by a collapse in imports. Domestic demand and job creation have slowed, and tariffs may push core inflation above 3% again. In the eurozone, Q2 GDP barely expanded (+0.1%), with uneven performance across member states. Inflation is stable at 2%, with core pressures easing. Altogether, the dollar retains a slight edge amid firmer data and a more hawkish Fed.
Technical Outlook – Bearish shift with volume confirmation
From a technical standpoint, the E6U25 contract has clearly broken down from its prior range. The area around 1.1775, which previously served as a high-volume node and resistance, was breached with strong downside momentum. The price action has since carved out a clean pattern of lower highs and lower lows, and volume has notably increased on bearish sessions, confirming the shift in control.
The current structure suggests a vacuum between 1.1775 and 1.1500, with only minor resistance expected around 1.1545, where some residual volume lies. There is little to no support before the 1.1280–1.1300 area, which aligns with a lower volume shelf on the visible range volume profile (VRVP). If price retraces to retest the 1.1525–1.1575 zone, that area is likely to act as a tactical selling opportunity before potentially resuming the downtrend.
Sentiment Analysis
CFTC data as of late July shows asset managers holding a substantial long position in EUR/USD, though these are beginning to unwind. The positioning profile leaves the euro vulnerable to further long liquidation if the selloff deepens.
Retail sentiment reinforces this view, as most retail traders are caught on the wrong side of the move. Open interest is stable but elevated, and trading activity has begun to rise slightly, hinting at retail dip-buying that may lack conviction. No major retail capitulation has occurred yet.
Broad market volatility remains subdued, and EUR/USD-specific indicators show a similar picture. The CME CVOL Index for EUR/USD remains around 8, a level considered moderately low by historical standards, reflecting a calm, non-disruptive market environment that favors technical trading, including respect for resistance levels and trend-following strategies.
Options Analysis
According to the CME FX Options Vol Converter, the landscape for EUR/USD still exhibits a modest downside bias. Risk reversals across one to three months tenors remain slightly negative, reflecting moderate demand for euro puts.
In listed markets, CME data for August expiries shows notable open interest concentration in puts at the 1.1450 and 1.1500 strikes, with deltas indicating directional positioning rather than purely hedging activity. On the call side, interest is more dispersed but visible above 1.1650, particularly at 1.1700 and 1.1750, suggesting some appetite for upside. However, the deltas are lower.
Trade Idea
A tactical short trade is favored in the 1.1525–1.1575 zone, which coincides with a potential pullback level within a well-established downtrend. This level also aligns with a minor volume shelf, providing a natural resistance area where sellers are likely to re-enter the market.
The suggested stop level is 1.1650, just above the recent short-term swing highs, which would invalidate the current bearish structure. The target lies around 1.1290, near the next major support zone and volume cluster.
Final thoughts
The EUR/USD rally in May/June was primarily fueled by expectations of synchronized easing and softer U.S. data. However, the Fed’s reluctance to commit to a cut, combined with a relatively more aggressive ECB stance, has shifted the narrative back in favor of the dollar. With asset managers showing signs of willingness to further unwind their exposure, combined with sentiment indicators pointing to complacency, a deeper retracement remains plausible.
The technical breakdown, lack of implied vol support for a rebound, and fresh open interest on euro puts collectively argue for tactical downside continuation. The proposed trade seeks to capture that move with a controlled stop and a realistic price target. Unless EUR/USD can reclaim the 1.1650–1.1700 zone decisively, the path of least resistance remains downward.
---
When charting futures, the data provided could be delayed. Traders working with the ticker symbols discussed in this idea may prefer to use CME Group real-time data plan on TradingView: tradingview.com/cme/ .
This consideration is particularly important for shorter-term traders, whereas it may be less critical for those focused on longer-term trading strategies.
General Disclaimer:
The trade ideas presented herein are solely for illustrative purposes forming a part of a case study intended to demonstrate key principles in risk management within the context of the specific market scenarios discussed. These ideas are not to be interpreted as investment recommendations or financial advice. They do not endorse or promote any specific trading strategies, financial products, or services. The information provided is based on data believed to be reliable; however, its accuracy or completeness cannot be guaranteed. Trading in financial markets involves risks, including the potential loss of principal. Each individual should conduct their own research and consult with professional financial advisors before making any investment decisions. The author or publisher of this content bears no responsibility for any actions taken based on the information provided or for any resultant financial or other losses.

Implied volatility, one more tool in our arsenalWHAT IS IMPLIED VOLATILITY?
Implied volatility (IV) refers to the market’s expectations of future volatility for a given asset, derived from option prices. Unlike historical volatility, which measures past price fluctuations, IV is forward-looking and reflects what traders believe will happen in the near future, typically over a 1 to 3 month horizon. IV is not directly observable; it is inferred from option prices using models like Black-Scholes. When option premiums rise even though the underlying asset remains flat, this often signals a rise in implied volatility: investors are preparing for more pronounced future price moves.
IMPLIED VOLATILITY IN FX
In FX markets, as in equities or commodities, implied volatility serves as a risk gauge and a proxy for uncertainty. It plays a critical role in portfolio management, hedging, and strategy timing.
High implied volatility on a currency pair indicates market expectations for increased future movement. This can stem from upcoming economic data, central bank decisions, geopolitical risk, or broader market instability. For example, rising IV on EUR/USD ahead of a major Fed or ECB meeting may signal increased demand for options as market participants hedge against potential surprises. Conversely, sustained low IV often reflects calm market conditions or, at times, a strong directional trend.
Implied volatility can act as a market condition filter for trading strategies. To simplify, we can, for example, divide the CVOL level into four distinct categories.
Abnormally low IV (well below average): Reflects extreme complacency or post-event calm.
Moderately low IV (below average): Indicates orderly, technical markets.
Moderately high IV (above average): Suggests elevated uncertainty.
Abnormally high IV (well above average): Signals market stress or panic.
In spot FX, where retail traders rarely engage in options directly, implied volatility serves best as a macro signal, helping inform position sizing, stop placement, or overall risk exposure based on the current volatility regime.
One advanced use of IV is to compare it against realized (historical) volatility. When implied volatility is much higher than realized volatility, it often means options are expensive, and vice versa. This comparison proves especially valuable in FX markets, as it helps traders identify situations where risk premia may be overpriced, revealing potential misalignments between implied and realized volatility. It also offers a forward-looking perspective by highlighting upcoming catalysts that are not yet fully priced into the spot market.
INTRODUCING THE CME CVOL INDEX
To make volatility data more accessible and comparable across asset classes, CME Group introduced the CVOL index family in 2023, a set of standardized implied volatility indexes derived from listed futures options.
How CVOL is calculated?
CVOL indexes are built using vanilla options on futures. They estimate 30-day forward implied volatility, using a basket of out-of-the-money options across various strikes and near-term expirations. The methodology is comparable to that of the VIX in equities, but adapted for the structure of futures markets. Each CVOL index is expressed as an annualized percentage, which can be interpreted as the expected one-standard-deviation move over the next 30 days.
CVOL indexes in FX
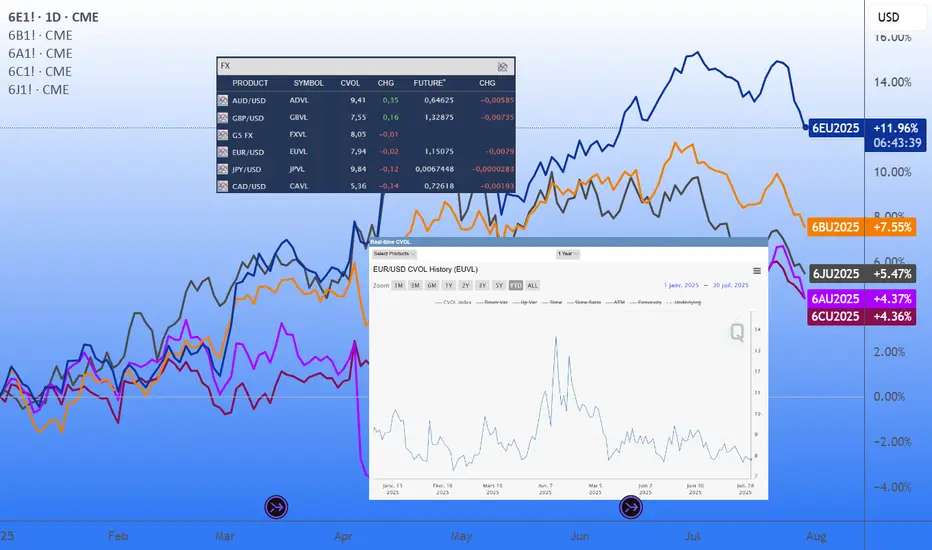
Several major currency pairs now have their own dedicated CVOL indexes, offering a real-time measure of implied volatility based on options pricing from CME Group futures contracts. Each index reflects the market’s expectations of future volatility for a given pair:
EUVL for EUR/USD (based on 6E futures)
JPVL for USD/JPY (6J futures)
GBPVL for GBP/USD (6B futures)
CAVL for USD/CAD (6C futures)
ADVL for AUD/USD (6A futures)
In addition to individual pair indexes, the G5 CVOL Index provides a broader view by aggregating the implied volatility of the five major currency pairs, offering a high-level snapshot of volatility across the G5 FX complex. This makes it a valuable tool for macro-focused traders monitoring global risk appetite, cross-asset volatility regimes, or portfolio-level currency exposure.
HOW TO USE CVOL IN PRACTICE
Detecting shifts in risk perception
A sudden spike in CVOL, without a move in the underlying, suggests that institutional players are actively hedging. This can act as an early warning signal for market-moving events or shifts in sentiment. Example: before an ECB decision, a jump in EUVL from 7% to 10% annualized while EUR/USD remains flat may suggest that traders are bracing for a policy surprise.
Adjusting position sizing
When CVOL moves beyond predefined thresholds, traders often respond by reducing leverage, widening stop-loss and take-profit levels, and avoiding overly aggressive directional exposure, in contrast with periods where CVOL fluctuates near its historical average and market conditions appear more stable.
Quant strategy filters
CVOL can also act as a regime filter within systematic trading strategies. For example, when implied volatility on EUR/USD, as measured by EUVL, reaches extreme levels, certain algorithms may shift into breakout mode, anticipating strong directional moves in a high-volatility environment. Conversely, when the index shows no abnormal reading, it may reflect a well-balanced market backdrop, offering more orderly conditions where structured strategies such as range trading tend to perform better.
As historical data on CVOL indexes are available, quant traders can easily backtest and validate ideas that incorporate volatility-based signals or regime filters. More experienced participants often go further, combining FX implied volatility with other volatility indicators, such as CVOL indexes on interest rate futures, to build multi-asset strategies and monitor cross-asset shifts in risk appetite with greater precision.
FINAL THOUGHTS
Implied volatility is a powerful lens into market expectations and potential price swings. In FX, although not always directly accessible to retail traders via options, IV data provides essential context for positioning, timing, and risk management.
With the advent of CME’s CVOL indexes, traders now have a standardized and transparent way to track and compare implied volatility across currencies. Whether you are a macro trader, hedge fund manager, or informed retail participant, monitoring CVOL brings a distinct informational edge, especially when used to anticipate shifts in sentiment and volatility regimes.
And perhaps most importantly: IV doesn’t tell you what happened, but what might happen next, making it an invaluable tool for anyone navigating fast-moving global FX markets.
---
When charting futures, the data provided could be delayed. Traders working with the ticker symbols discussed in this idea may prefer to use CME Group real-time data plan on TradingView: tradingview.com/cme/ .
This consideration is particularly important for shorter-term traders, whereas it may be less critical for those focused on longer-term trading strategies.
General Disclaimer:
The trade ideas presented herein are solely for illustrative purposes forming a part of a case study intended to demonstrate key principles in risk management within the context of the specific market scenarios discussed. These ideas are not to be interpreted as investment recommendations or financial advice. They do not endorse or promote any specific trading strategies, financial products, or services. The information provided is based on data believed to be reliable; however, its accuracy or completeness cannot be guaranteed. Trading in financial markets involves risks, including the potential loss of principal. Each individual should conduct their own research and consult with professional financial advisors before making any investment decisions. The author or publisher of this content bears no responsibility for any actions taken based on the information provided or for any resultant financial or other losses.
Short the Slip Above 1.3500Fundamental Outlook: A stagflation trap
The UK economy continues to emit worrying signs of stagflation: inflation remains uncomfortably high, growth is weak, and the once-tight labor market is starting to soften. Consumer confidence has deteriorated, and house prices are experiencing record declines, a trend that underscores the fragility of household wealth and future consumption.
In this challenging context, any rally in the pound should be treated with caution. The broader macro backdrop still favors the US dollar, especially if incoming US data continues to support a "soft landing" narrative. In contrast, the UK's trajectory appears more constrained.
On monetary policy, the Bank of England is expected to maintain a predictable, yet clearly dovish, easing cycle through the second half of 2025. Market consensus leans toward a 25 bps cut in August, followed by a pause in September, then another cut in November. This gradual pace of easing may keep the pound under persistent pressure, especially if the Federal Reserve maintains a more stable or data-driven stance.
On the political front, Trump’s critical remarks toward Powell and evolving UK-US relations represent potential flashpoints. Any surprises here could further erode confidence in the pound.
Technical Analysis: Signs of breakdown below 1.34
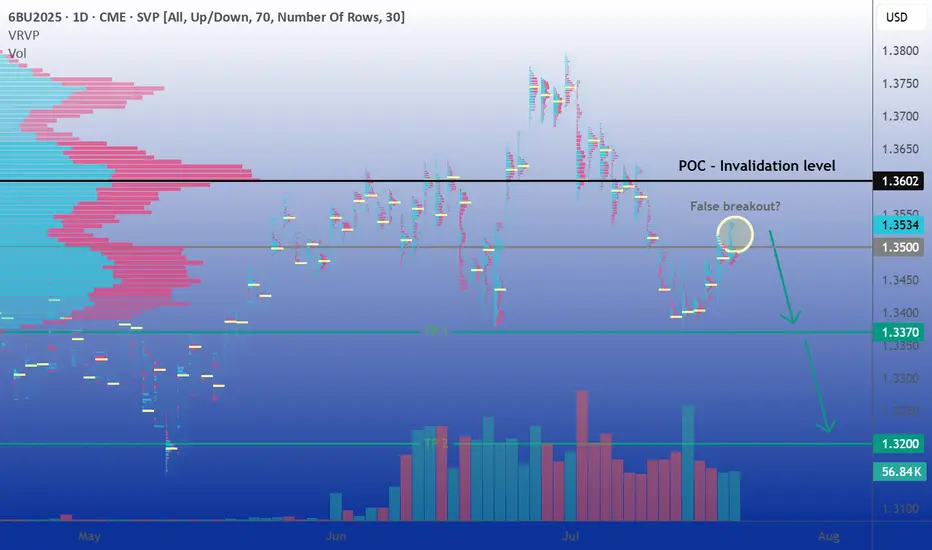
The September futures contract (6BU2025) has dropped over 2.5% in a straight line during the first two weeks of July, pressuring the 1.34 USD support zone before rebounding in recent sessions. So far, each rebound attempt has been met with consistent selling, and the brief move above 1.3500 appears fragile, offering a potential short opportunity to re-enter the previous range.
A sustained daily close below 1.3370 would likely pave the way for further downside toward the 1.32 level, which hasn’t been visited since May 13th. Notably, the volume profile reveals a liquidity vacuum in that region, potentially acting as a price magnet.
Overall, the technical setup favors another leg lower, barring the emergence of a strong bullish catalyst capable of reversing the prevailing trend.
Sentiment Analysis: Mixed but fragile
From a positioning standpoint, the CFTC's latest Commitment of Traders (COT) report shows asset managers increasing their bearish exposure. Net short positions grew from 13,154 to 27,611 contracts, hinting at rising institutional pessimism toward the pound.
In the FX/CFD retail segment, positioning remains relatively balanced. However, we notice a pattern: retail traders tend to increase long exposure on dips, profiting from short-term rebounds, a classic contrarian signal that the market may still have room to move lower.
Volatility remains muted, with the VIX trading below 17, close to its annual lows. This low-volatility environment tends to reinforce technical trading patterns and increases the likelihood that price respects key support/resistance zones, unless jolted by surprise macro events.
Options Market: Downside risk priced in
In the listed options market, we see a clear asymmetry in favor of downside protection. Out-of-the-money (OTM) puts trade at higher premiums than equivalent calls, confirming a market pricing greater fear of a GBP decline.
Open interest (OI) is notably concentrated in the 1.34–1.35 strike zone. This suggests potential pinning around these levels near expiry, but also highlights the risk of increased volatility if the spot price deviates sharply. A move away from this cluster could spark rapid adjustments in hedging flows, adding fuel to the next directional move.
Trade Ideas: Two ways to play the bearish bias
1. Classic directional strategy
Entry: Short at current price (around 1.3535)
Stop Loss: Daily close above 1.3602 (Volume Profile Point of Control)
Take Profit 1: 1.3370 (recent support)
Take Profit 2: 1.3200 (liquidity void)
This strategy targets a clean technical setup with clearly defined risk. A break below 1.3370 would confirm downside momentum and offer a high-reward second leg toward the 1.32 region.
2. Alternative strategy: Replace your stop loss with an OTM call option
Rather than exiting prematurely via a hard stop loss in case of a false breakout, consider purchasing an OTM call option as a form of insurance. This allows you to stay in the trade while limiting your maximum loss.
For instance, buying the August 1.355 call, currently trading around 0.0059 on CME (59 ticks), caps your loss in the event of an unexpected breakout above resistance. If the cable squeezes sharply higher, the call option will compensate part or all of the loss on the short position beyond the strike price.
This hybrid approach works particularly well in setups like this one, where fundamentals and sentiment support a bearish outlook, but positioning and low volatility leave room for abrupt technical counter-moves.
Final thoughts
The pound faces an increasingly precarious setup. Fundamental conditions in the UK remain soft, monetary policy is turning more accommodative, and political uncertainty looms large. Meanwhile, technical and sentiment indicators tilt bearish, and the options market reflects elevated downside risk premiums.
In short, while the market may already be pricing in some of this pessimism, the risks of a deeper GBP correction remain high. Traders should watch upcoming catalysts, BoE and Fed meetings, US/UK economic data, and geopolitical signals, and adjust positions accordingly.
Until we see a clear shift in macro data or a breakdown in technical patterns, fading rallies remains a strategy with attractive risk/reward potential.
---
When charting futures, the data provided could be delayed. Traders working with the ticker symbols discussed in this idea may prefer to use CME Group real-time data plan on TradingView: tradingview.com/cme/ .
This consideration is particularly important for shorter-term traders, whereas it may be less critical for those focused on longer-term trading strategies.
General Disclaimer:
The trade ideas presented herein are solely for illustrative purposes forming a part of a case study intended to demonstrate key principles in risk management within the context of the specific market scenarios discussed. These ideas are not to be interpreted as investment recommendations or financial advice. They do not endorse or promote any specific trading strategies, financial products, or services. The information provided is based on data believed to be reliable; however, its accuracy or completeness cannot be guaranteed. Trading in financial markets involves risks, including the potential loss of principal. Each individual should conduct their own research and consult with professional financial advisors before making any investment decisions. The author or publisher of this content bears no responsibility for any actions taken based on the information provided or for any resultant financial or other losses.
Kiwi on the Edge: Sell the Bounce Below 0.6080Among major currencies, the New Zealand Dollar (NZD) is often viewed as peripheral in global capital flows. Yet it consistently ranks among the world’s top 10 most traded currencies. Its relevance stems from New Zealand’s strong exposure to international trade, especially with China and Australia, and an economy heavily reliant on commodity exports. As a result, the NZD is classified as a "pro-risk" currency, highly sensitive to global cyclical dynamics, interest rate differentials, and Asian demand. It also maintains a strong correlation with the Australian Dollar (AUD), due to similar macroeconomic drivers and trade linkages.
In the FX community, the NZD is often affectionately referred to as the "Kiwi," a nod to the iconic flightless bird native to New Zealand and depicted on the country’s coins. Despite being a smaller player on the geopolitical scene, New Zealand’s currency frequently presents appealing opportunities for FX traders, particularly in times of shifting risk sentiment or commodity market volatility.
With the Reserve Bank of New Zealand (RBNZ) having just announced its latest policy decision, it’s time to reassess the Kiwi’s fundamental landscape, technical backdrop, and market sentiment to refine our directional trading outlook.
Fundamental Outlook: RBNZ holds rates, but easing bias remains
As widely expected, the RBNZ held its Official Cash Rate (OCR) steady at 3.25% during its July 9 policy meeting. This pause comes after an aggressive easing cycle that saw the OCR lowered by 225 basis points since August 2024. The move reflects the central bank’s aim to stabilize inflation without undermining the fragile recovery.
The tone of the accompanying statement remains dovish. Policymakers clearly left the door open for further rate cuts later in the year, conditional on continued disinflation and signs of weaker demand. For now, however, inflation is running at a comfortable 2.5% year-over-year, right in the middle of the RBNZ’s 1–3% target band. Meanwhile, the economy has shown some resilience: Q1 2025 GDP posted a quarterly gain of +0.8%, confirming a technical exit from the recession experienced in 2024.
Nonetheless, external headwinds remain a concern. Sluggish data from China (New Zealand’s largest trading partner) continue to cast a shadow over the medium-term outlook. Slower Chinese demand for dairy and meat exports, as well as raw materials, could limit the momentum of New Zealand’s recovery, thereby reinforcing the need for accommodative policy.
Technical Analysis: Key resistance near 0.6080
Technically, the picture has deteriorated significantly on the 6NU2025 contract since Monday, with a sharp downside acceleration toward the psychological 0.60 level. Price is still hovering around this threshold.
Volume profile analysis reveals a clear liquidity gap between 0.6040 and 0.6065, a zone that could be filled before any new directional move unfolds. Just above, a major congestion area emerges around 0.6080, where the point of control (POC) is located. This area represents a key short-term pivot and a potential resistance level, especially as it also sits just above the 10- and 20-day simple moving averages.
As long as price remains capped beneath 0.6080, the bias remains moderately bearish. A rejection in the 0.6060–0.6080 area would confirm resistance and suggest renewed downside risk. However, a decisive daily close above 0.6100 would invalidate the bearish scenario and open the door toward 0.6150 and possibly above. In the near term, the setup favors a cautious bearish stance, but timing remains critical.
Sentiment and Positioning: Retail crowded longs raise red flags
Commitment of Traders (COT) data provides additional context. As of the latest report, non-commercial speculators hold a net long position of approximately +4,150 contracts in the 6N futures. This moderately bullish stance likely reflects the unwinding of prior bearish bets in response to the sustained weakness of the US dollar over the past quarter. Meanwhile, commercial hedgers, typically exporters and importers, remain net short, which is structurally consistent with hedging flows rather than directional speculation.
From a retail perspective, the sentiment skew is more concerning. Aggregated positioning data across FX/CFD brokers shows that nearly 60% of retail traders are long NZD/USD. Some platforms report even more extreme figures, with bullish retail exposure above 80%. Historically, such one-sided positioning often foreshadows downside risk, especially if stop losses are triggered en masse below recent support levels.
Volatility conditions also merit attention. The VIX, Wall Street’s fear index, remains near its annual lows, suggesting a market backdrop of complacency. While this environment typically supports pro-risk currencies like the NZD, the fact that the S&P 500 just notched fresh all-time highs raises the possibility of profit-taking or corrective flows, potentially weighing on risk-correlated assets in the short term.
Trade Idea: Sell the rally toward 0.6060–0.6080
Given the current macro setup, sentiment profile, and technical resistance overhead, a sell-the-bounce approach appears tactically appropriate. We propose the following directional futures trade on the September contract (6NU2025):
Entry Point: Short at 0.6060, to take advantage of a potential fill of the low-volume gap
Stop Loss: 0.6100 on a daily close basis, just above the POC and confluence resistance
Target 1: 0.5985, below the recent swing low
Target 2 (extended): 0.5890, just under the June 23 bottom
This setup aims to capture a continuation of the downtrend that began in early July. It relies on disciplined risk management and realistic target zones, while respecting key technical structures and the crowded long positioning among retail traders. The strategy will be invalidated if prices manage to close above 0.6100 on a daily basis, signaling a shift in near-term momentum.
---
When charting futures, the data provided could be delayed. Traders working with the ticker symbols discussed in this idea may prefer to use CME Group real-time data plan on TradingView: tradingview.com/cme/.
This consideration is particularly important for shorter-term traders, whereas it may be less critical for those focused on longer-term trading strategies.
General Disclaimer:
The trade ideas presented herein are solely for illustrative purposes forming a part of a case study intended to demonstrate key principles in risk management within the context of the specific market scenarios discussed. These ideas are not to be interpreted as investment recommendations or financial advice. They do not endorse or promote any specific trading strategies, financial products, or services. The information provided is based on data believed to be reliable; however, its accuracy or completeness cannot be guaranteed. Trading in financial markets involves risks, including the potential loss of principal. Each individual should conduct their own research and consult with professional financial advisors before making any investment decisions. The author or publisher of this content bears no responsibility for any actions taken based on the information provided or for any resultant financial or other losses.

FX quarter end : a high-probability recurring patternAs we approach the end of June, a well-known phenomenon among FX traders is once again coming into focus: when currencies have diverged significantly over the course of a month or quarter, we often see a technical correction into the final trading session, with partial pullbacks in the pairs that had previously moved the most.
This end-of-month or quarter pattern is not random. It is the predictable result of recurring institutional flows. Recently, the US dollar has notably weakened against most major currencies. As a result, we could anticipate a modest bounce in the dollar to close out the month and start the new week, as various participants are likely to adjust their positions accordingly.
Performance of FX futures contracts from Sunday, June 1 to Friday, June 27:
Swiss Franc +3.71%
Euro +3.61%
British Pound +1.95%
New Zealand Dollar +1.58%
Australian Dollar +1.50%
Canadian Dollar +0.67%
Japanese Yen +0.16%
Performance of FX futures contracts from Tuesday, April 1 to Friday, June 27:
Swiss Franc +10.73%
Euro +8.40%
New Zealand Dollar +6.90%
British Pound +6.26%
Canadian Dollar +5.23%
Australian Dollar +4.80%
Japanese Yen +3.68%
These figures illustrate a broad-based decline in the dollar during June and over the entire second quarter. Historically, such imbalances open the door to late-stage adjustments, with currencies that have risen sharply often seeing modest technical pullbacks. This is a setup closely monitored by FX traders, who view it as a high-probability opportunity based on a pattern that is rare, but remarkably consistent.
FX rebalancing: mechanics and market players
At the heart of these adjustments lies one key concept: rebalancing. This is the process by which institutional players, pension funds, insurers, central banks, passive managers, bond funds, corporates adjust their FX exposures to stay in line with the targets defined in their mandates.
Every month, the value of their assets (equities, bonds, alternatives) and currency holdings fluctuate. If a currency appreciates sharply, its weight in the portfolio may become too high. Conversely, if a currency weakens, exposure might fall below target. Rebalancing involves buying or selling FX to return to those target allocations.
This process is recurring, predictable, and usually concentrated in a narrow window, the final hours of the trading month, just before the London 4pm fix. Quarter-ends tend to be even more pronounced, as many investors revisit long-term strategic allocations at that time.
Many of these adjustments are driven by systematic models using fixed thresholds, which adds to the consistency and timing of these flows.
Ideal setup: low volatility, high impact
June 2025 ends in a particularly calm environment: equity markets are stable or even rising, and the VIX is trading near its yearly lows, signs of a quiet and balanced market that favors more technical trading. This context is favorable for strategies aiming to take advantage of rebalancing effects, as in the absence of new announcements or unexpected events, these adjustments are likely to have a tangible impact on prices.
Conversely, in a more volatile market environment, such adjustments could be drowned out by larger flows (such as a flight to quality), thus having a reduced or even negligible impact.
FX options: another layer of flows
Another important factor on Monday, June 30: a large number of FX options expire at 10am New York (3pm London). These expiries cover several major pairs, with significant notional amounts concentrated near current spot levels.
According to what is currently being whispered on trading desk chat rooms, we expect the following large expiries:
EUR/USD: €3.0bn at 1.1650 (below spot)
USD/JPY: $1.6bn at 145.50 (above spot)
USD/CHF: $1.8bn at 0.8000 (above spot)
GBP/USD: £1.0bn at 1.3600 (below spot)
AUD/USD: A$1.1bn at 0.6425 (below spot)
When spot approaches these strikes, option holders or sellers may intervene to "pin" prices, based on their delta exposure. This behavior can amplify technical price movements in the hours before expiration.
When these heavy expirations align with month/quarter end rebalancing flows in a quiet, low-volatility market, it creates a strong potential cocktail for tactical moves, conducive to a dollar rebound into the fix.
How to trade the pattern effectively
Here’s a simplified roadmap to navigate this recurring pattern:
Identify monthly or quarterly extremes: look for the currencies that gained or lost the most over the period;
Assess the market environment: a low VIX, no major data or central bank events, meaningful trends, and significant options expiries are ideal conditions;
Use liquid and transparent instruments: Sep 2025 FX futures (standard, e-mini or micro) are currently the most suitable products for active positioning
Set realistic expectations: aim for a 0.5% to 1.0% pullback, not a full-blown trend reversal
Manage risk properly: as with any strategy, always use a stop-loss. This is quantitative trading, not fortune-telling. If the USD continues to weaken despite the setup, be ready to exit swiftly.
In short...
Quarter/month end FX rebalancing is one of the few market events where anticipated institutional flows can create repeatable, high-probability trading opportunities. These flows stem from real portfolio needs and systematic re-hedging, and are often amplified by option expiries and technical positioning.
This setup provides a great educational case study for any trader seeking to better understand hidden FX dynamics. There’s no secret indicator or crystal ball here, just a solid grasp of structural flows and timing.
From a personal standpoint, after over 20 years trading currencies, this strategy remains one of my favorites: simple, effective, and highly instructive. I encourage you to study it closely, and observe its behavior during upcoming month-end windows.
---
When charting futures, the data provided could be delayed. Traders working with the ticker symbols discussed in this idea may prefer to use CME Group real-time data plan on TradingView: tradingview.com/cme/ .
This consideration is particularly important for shorter-term traders, whereas it may be less critical for those focused on longer-term trading strategies.
General Disclaimer:
The trade ideas presented herein are solely for illustrative purposes forming a part of a case study intended to demonstrate key principles in risk management within the context of the specific market scenarios discussed. These ideas are not to be interpreted as investment recommendations or financial advice. They do not endorse or promote any specific trading strategies, financial products, or services. The information provided is based on data believed to be reliable; however, its accuracy or completeness cannot be guaranteed. Trading in financial markets involves risks, including the potential loss of principal. Each individual should conduct their own research and consult with professional financial advisors before making any investment decisions. The author or publisher of this content bears no responsibility for any actions taken based on the information provided or for any resultant financial or other losses.
