How to Trade Options on Futures in TradingViewLearn to find and analyze options on futures using TradingView's dedicated options platform in this comprehensive tutorial from Optimus Futures.
Options on futures combine the leverage of futures contracts with the flexibility of options strategies. TradingView provides powerful tools to research these instruments, view options chains, and build custom strategies.
What You'll Learn:
How to access TradingView's options platform from the Products dropdown menu
Understanding the difference between equity and futures option contracts
Using the right toolbar to view options alongside any futures chart
Analyzing options by futures contract settlment date
Navigating the options chain to view all available strikes and expirations
Reading key data including volume, bid/ask prices, implied volatility, and Greeks
Using the expiration selector to navigate between different expiration dates
How the Strategy Builder lets you create and visualize options strategies
Filtering pre-built strategies by market outlook: bullish, bearish, or neutral
Using the Volatility tab to analyze implied volatility across strikes
This tutorial will benefit futures traders and technical analysts who want to incorporate options strategies into their trading process.
The tools covered may help you research hedging opportunities, analyze market expectations through implied volatility, and build defined-risk positions on futures products.
Learn more about futures trading with TradingView: optimusfutures.com
Disclaimer
There is a substantial risk of loss in futures and options trading. Past performance is not indicative of future results. Please trade only with risk capital. We are not responsible for any third-party links, comments, or content shared on TradingView. Any opinions, links, or messages posted by users on TradingView do not represent our views or recommendations. Please exercise your own judgment and due diligence when engaging with any external content or user commentary.
This video represents the opinion of Optimus Futures and is intended for educational purposes only. Chart interpretations are presented solely to illustrate objective technical concepts and should not be viewed as predictive of future market behavior. In our opinion, charts are analytical tools - not forecasting instruments. Market conditions are constantly evolving, and all trading decisions should be made independently, with careful consideration of individual risk tolerance and financial objectives.
Futuresmarket

RECALLUSDT plan13-02-26RECALLUSDT plan 13-02-26
The price has touched fresh supply and there has been rejection.
On the 1H timeframe, a break of the nearest low is visible.
Move down to the 30m timeframe to place a pending sell order.

Naorisusdt Plan 13-02-26Naorisusdt Plan 02-13-26
The price has pumped into fresh supply, and a rejection has occurred.
Although there is no bearish engulfing yet, we'll try to find a setup on the M30 timeframe.
This isn't a good setup, so try it.

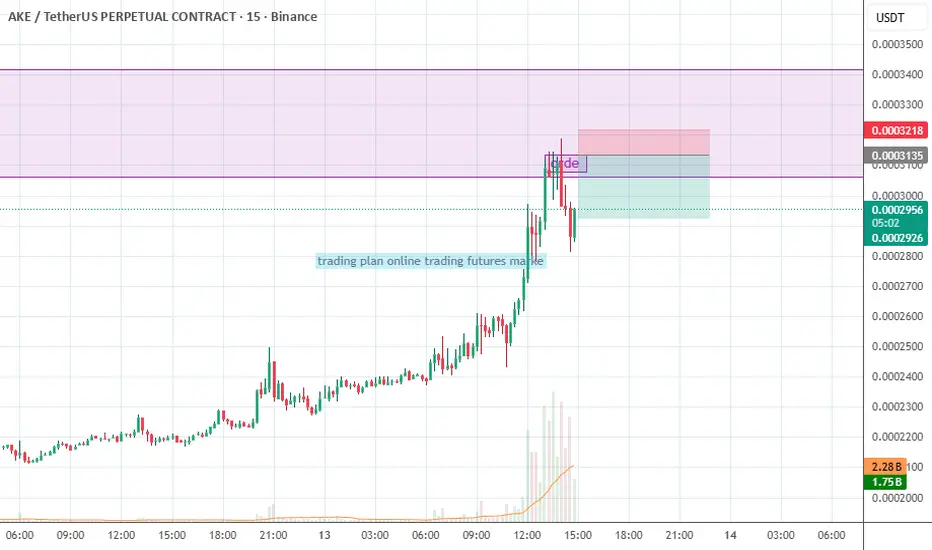
AKEUSDT plan 13-02-26AKEUSDT plan 13-02-26
The price has touched fresh supply and was rejected.
When we moved down to the 1-hour timeframe, we didn't see a good bearish engulfing pattern.
We tried the 15-meter timeframe and saw a choch. We tried setting a pending position on the left shoulder.
With a Quasimodo setup.
Gold Futures: A Sharp Drop in Open Interest After Extreme MovesGold futures have seen very violent price action recently. After an exceptional 2025 — with prices nearly doubling — gold is now trading roughly 10% below its all-time high.
While price alone looks dramatic, the more important signal right now comes from Open Interest.
Open Interest is collapsing — and that matters
As shown in the chart, open interest has dropped sharply, reaching some of the lowest levels seen in the last few years. This decline happened during a period of elevated volatility and fast price moves.
A falling open interest tells us that:
Existing positions are being closed, not replaced
Leverage is being reduced
The move is driven more by liquidation than by new directional conviction
This is a key distinction. When price moves lower with rising open interest, it usually signals growing bearish positioning. Here, we see the opposite: participation is shrinking, not expanding.
What this usually implies
Historically, strong price moves combined with falling open interest tend to mark:
The end of an impulsive phase
A transition into consolidation or re-pricing
Reduced trend-following edge in the short term
In other words, the market is clearing positions and searching for a new equilibrium, rather than committing to a new directional trend.
Bottom line
The recent move in gold looks less like a structural trend reversal and more like a deleveraging event.
Until open interest stabilizes and volatility cools, gold futures are more likely in a transition regime than in a clean trending environment.
This analysis is for educational purposes only. It does not constitute investment or trading advice.

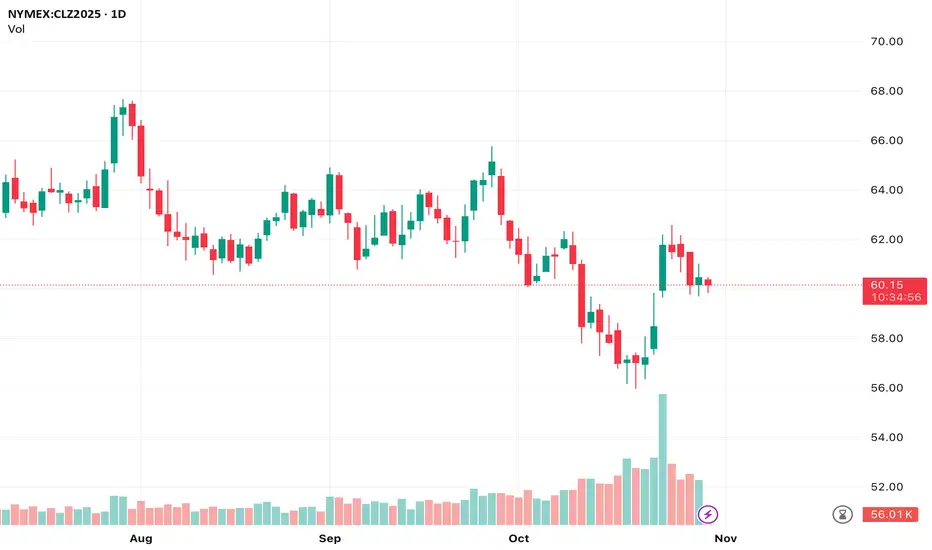
Crude Oil Futures (Dec 2025) Daily Chart Analysis
Crude Oil Futures (Dec 2025) Daily Chart Analysis
Price is trading around 60.15 after a bounce from the 56 area. The recent move up has slowed, shown by smaller candles and reduced volume. Structure shows a lower-high pattern overall, but the market is currently holding above a short-term higher low. This suggests consolidation, not a confirmed trend continuation yet.
Key Levels:
Resistance at 62. Price has rejected this zone twice.
Support at 60. Market is sitting just above this level.
Major support at 56. Strong reaction level where price last bounced.
What I See:
Volume increased on the push up, then faded.
Recent candles show hesitation, indicating indecision.
Price is ranging between 60 support and 62 resistance.
Bullish Scenario:
A break and daily close above 62 would signal upside momentum.
Targets: 64 then 67.
Bearish Scenario:
A break and close below 60 sets up a move toward 58 and potentially a retest of 56.
Current Bias:
Neutral. Price is consolidating. Waiting for a clear breakout or breakdown is prudent.
Range trades are possible between 60 and 62 with tight risk management.
Catalysts to Watch:
Crude reacts strongly to fundamentals including geopolitical events, US inventory data, and OPEC communication. Manage risk accordingly.
Follow for more. Happy Trading.
The Professor
"Aha!" Moments Are Dangerous — Here’s Why You Shouldn’t Panic Just because a big options trade appears — doesn’t mean it’s a signal.
Options move every day.
Some trades are:
-Speculative
-Hedging plays
-Pure lottery tickets
Only a few carry real directional sentiment.
And learning to separate noise from signal?
That’s one of the most powerful skills a trader can develop — even if you never trade options yourself.
Let’s Look at JPY (See Chart)
On September 5, two large put portfolios appeared:
1. 0.0064 Put
2. 0.00635 Put
Both new, both with no prior open interest — so not a roll.
And yes — they’re larger than average.
To a beginner, this screams:
“JPY is going to crash — time to short everything!”
But let’s pause.
An experienced flow analyst would ask:
Is this really a bearish signal?
🔍 Here’s What the Data Says:
❗️Size ≠ Significance
Yes, the portfolios are big — but each costs ~$90K.
In institutional terms? Not massive.
❗️Delta is ~2%
That means less than 2% chance of expiring in the money.
❗️This Happens Often in JPY
Same strike (0.0064), same structure — appeared in the previous series.
Price never went near it.
No crash. No panic.
Just… nothing.
🧠 So Why Buy It?
I don’t know.
And I don’t need to.
Could be:
1️⃣A hedge for a larger book
2️⃣A counterparty agreement
3️⃣A some extra aggressive logic
But here’s what I do know:
Based on years of CME data and personal tracking —
Trades like this don’t cause market crashes.
They don’t move the needle.
They don’t change the trend.
✅ Final Takeaway:
Don’t react to the data headline.
Ask:
How likely is this to matter?
Is it priced in?
Has this happened before? Price reaction after big OTM options?
Because real edge isn’t in the "Aha!" moment —
It’s in the "Wait, let me check…" moment.

Classic tug-of-war NASDAQBias: Still broadly bullish on the daily—no true downside displacement, and price hasn’t closed below the last impulse up. But… we failed to close above recent 2-month highs and are sitting right at weekly equilibrium.
Where we are: Price is coiling around the 4H BISI low ≈ 23,790.50, which also aligns with ~50% of the weekly range. Nested inside is a 1H BISI with a bullish 1H OB just beneath. Classic tug-of-war spot.
Areas of Interest:
Above: 23,929 → PDH 23,962.75 → 24,000 BRN → 24,040–24,080 (upper imbalance).
Below: 23,713.50 (50% of 1H OB) → 23,596 → 23,501 → swing magnet 22,684.75 (D1 SIBI high).
Tell: The last “new low” on 1H needed two candles to actually close below and did so weakly. That shows sell-side lacks displacement unless we break structure decisively.
What flips the switch (clear invalidation logic)
Bullish reclaim: 15–60m close back above 23,790–23,804 (ETH close 23,796.5 / RTH close 23,804) and hold on a retest → long side favored.
Bearish break: Clean 1H close below 23,713 (and acceptance under it) → short side favored; you’re below the 1H OB and the nested BISI.
Two actionable trade plans
(Use your 5m/1m execution: wait for displacement through the trigger, then take the FVG or OB retrace inside the HTF level.)
A) Reclaim-and-go LONG (higher-probability if we hold above weekly EQ)
Trigger: 15–60m close above 23,790–23,804, then a controlled retest that holds (wick below, body close back above).
Entry zone: 23,790–23,804 (retest of 4H BISI low / prior close cluster).
Invalidation (stop): Below 23,713 (under the 1H OB mid) or tighter under the swing that forms your 5m/1m FVG entry (your call on risk).
Conservative SL: 23,690–23,705 (below the OB body).
Profit targets:
T1: 23,929 (first buy-side pools / inefficiency fill)
T2: 23,962.75 (PDH)
T3: 24,000 (round-number magnet)
T4 (runner): 24,040–24,080 (upper imbalance)
Trade management: Partial at T1, move stop to BE after M5 market structure shift in your favor or after T1 prints. Keep a runner if displacement expands.
B) Breakdown-and-acceptance SHORT
Trigger: Clean 1H close below 23,713 and a retest rejection (can use a 5m FVG inside 23,713–23,730).
Entry zone: 23,713–23,730 (failed reclaim of 1H OB mid / underside of the 1H BISI).
Invalidation (stop): Above 23,790–23,804 (back inside/above the 4H BISI low and prior closes).
Tighter intraday SL can sit above the 5m swing that breaks down.
Profit targets:
T1: 23,596
T2: 23,501
T3 (optional intraday): 23,440–23,460 (prior 1H demand base, if visible on your feed)
T4 (swing only): 22,684.75 (D1 SIBI high)
Trade management: Take partial at T1, trail above last M5 LHs. If New York lunch compresses, be quick to pay yourself.
Why these are the right spots
23,790–23,804 is a decision box: 4H BISI low + ETH/RTH prior close cluster + weekly EQ. Acceptance above = trend continuation likely; rejection = continuation of the rotation lower.
23,713.50 is the line in the sand intraday: it’s the 50% of your 1H OB and sits just beneath the 1H BISI. Lose it and you’ve removed the nearby bullish sponsor, opening the path to 23,596/23,501.
The lack of downside displacement on the last “new low” keeps a bullish continuation on the table—until we get that decisive 1H break/acceptance below 23,713.
Execution tips
Time-of-day: favor NY AM session for your displacement signal; Monday often ranges → reduce size until one side wins (as you noted).
Trigger discipline: do not anticipate the reclaim/break. Wait for the 15–60m close, then execute on 5m/1m FVG back into the level.
Risk: if trading the same idea across multiple accounts, stagger entries (one at level, one at 50% of the M5 FVG).
Quick reference (levels)
Bullish above: 23,804 → 23,929 → 23,962.75 → 24,000 → 24,040–24,080
Neutral box: 23,790.5 (4H BISI low / weekly EQ) ± a few ticks
Bearish below: 23,713.5 → 23,596 → 23,501 → 22,684.75

SKLUSDT – Possible Reversal in PlaySKL shows a change of character (ChoCH) after long consolidation and now trying to push upward. Price already retested the zone, giving a chance for continuation if momentum holds.
Entry: 0.0310 - 0.0307
Stoploss: 0.0297
Targets:
0.0326
0.0339
0.0360
Let’s see if SKL can maintain strength and push into higher targets.

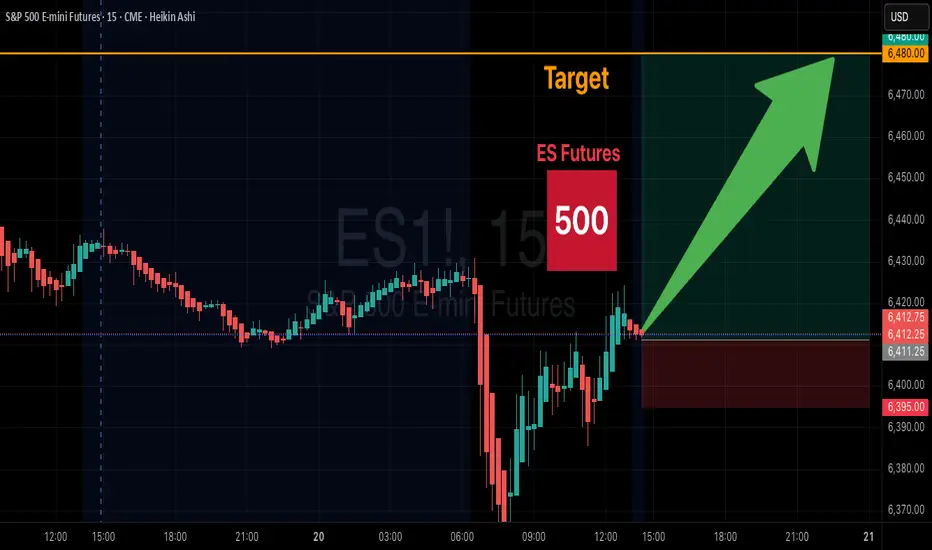
ES Futures Trade Setup – Long Opportunity
🎯 **ES Futures Trade Setup – Long Opportunity**
📌 **Instrument:** ES
📈 **Direction:** LONG
💰 **Entry Price:** 6415.50
🛑 **Stop Loss:** 6353.98 (1 ATR below entry)
🏹 **Take Profit:** 6480.00 (\~64.5 points)
📏 **Position Size:** 3 contracts
💪 **Confidence:** 65%
⏰ **Timing:** Enter at market open
⚠️ **Key Risks:** Mixed short-term signals may cause volatility. Move below 6400 could invalidate trade.
✅ **Rationale:** Long-term bullish trend remains intact; favorable risk-reward despite short-term bearish momentum.
Trading Gold? Know the Difference Between XAU/USD and Futures🔎 Let’s address a question I get very often:
“Should I trade spot gold (XAU/USD) or Gold futures?”
It might sound like a technical decision, but it’s actually about how you approach the market, your risk profile, and your experience level.
So let’s break it down 👇
________________________________________
🟡 Two ways to trade the same asset
Both spot and futures allow you to speculate on the price of Gold. But they’re two very different beasts when it comes to execution, capital, and strategy.
________________________________________
1️⃣ Spot gold (XAU/USD)
• Traded mostly via Forex brokers or CFD platforms
• No expiration — you can hold the position as long as you want
• Often used by retail traders for day trading or swing setups
• You can open small trades (even 0.01 lots)
• Costs include spread, swap fees if you hold overnight
• Leverage is usually high — up to 1:100 or more
• Margin is required, but typically lower than in futures
💡 Spot is flexible and accessible, but you pay the price through overnight holding costs, wider spreads during volatility, and slippage. On some brokers, especially during high-impact news, your platform might even freeze or delay execution — and that’s a serious risk if you’re not prepared.
________________________________________
2️⃣ Gold futures (GC)
• Traded on major futures exchanges like CME
• Contracts have a fixed size (usually 100 oz)
• They expire monthly, so you need to manage rollovers
• Common among hedge funds and experienced traders
• You pay commissions and exchange fees, but no swaps
• Margin is required here too — but it's much higher
💡 Futures are structured and professional — but they demand more capital, stricter execution discipline, and higher margin requirements. Just like in spot trading, margin is a collateral deposit, not a cost — but with futures, the bar is set higher.
________________________________________
⚖️ So, which one is for you?
If you're using MetaTrader or any platform offered by a Forex/CFD broker, and you're a scalper, intraday, or swing trader working with flexible position sizes...
→ You're probably better off with spot gold (XAU/USD).
If you're trading big volume, managing diversified portfolios, or involved in hedging large exposure...
→ You should consider futures — but expect to level up your game, capital requirements, and discipline.
________________________________________
🧠 Mindset:
Don’t confuse accessibility with simplicity.
Just because spot Gold is easier to open doesn’t mean it’s always the best choice.
Just because futures look “pro-level” doesn’t mean they’re always worth it for a retail trader.
Understand your tools. Pick the one that aligns with your structure. That’s how you stay in the game. 🎯
________________________________________
📚 Hope this cleared it up. If you want me to cover execution setups for each one, let me know in the comments.

The Golden Grain: Trading Corn in Global Markets🟡 1. Introduction
Corn isn’t just something you eat off the cob at a summer barbecue — it’s one of the most widely traded agricultural commodities in the world. Behind every kernel lies a powerful story of food security, global trade, biofuels, and speculative capital.
Whether you’re a farmer managing risk, a trader chasing macro trends, or simply curious about how weather affects global prices, corn futures sit at the crossroads of agriculture and finance. In this article, we’ll explore what makes corn a global economic driver, how it behaves as a futures product, and what traders need to know to approach the corn market intelligently.
🌎 2. Where Corn Grows: Global Powerhouses
Corn is cultivated on every continent except Antarctica, but a handful of countries dominate production and exports.
United States – By far the largest producer and exporter. The “Corn Belt” — spanning Iowa, Illinois, Indiana, Nebraska, and parts of Ohio and Missouri — produces the majority of U.S. corn. U.S. exports also set global benchmarks for pricing.
Brazil & Argentina – These two South American powerhouses are crucial to the global corn supply, especially during the Northern Hemisphere’s off-season.
China – Though a top producer, China consumes most of its own supply and has become a key importer during deficit years.
Corn is typically planted in the U.S. between late April and early June and harvested from September through November. In Brazil, two crops per year are common — including the important safrinha (second crop), harvested mid-year.
Understanding where and when corn is grown is vital. Weather disruptions in any of these regions can ripple through the futures market within hours — or even minutes.
💹 3. Corn as a Futures Market Power Player
Corn is one of the most liquid agricultural futures markets in the world, traded primarily on the CME Group’s CBOT (Chicago Board of Trade). It attracts a diverse set of participants:
Producers and Commercials: Farmers, ethanol refiners, and food manufacturers use corn futures to hedge price risk.
Speculators and Funds: Hedge funds and retail traders speculate on corn price direction, volatility, and seasonal patterns.
Arbitrageurs and Spreads: Traders bet on relative price differences between contracts (e.g., old crop vs. new crop spreads).
The deep liquidity and relatively low tick size make corn accessible, but its price is highly sensitive to weather, government reports (like WASDE), and international trade policies.
🏗️ 4. CME Group Corn Futures: What You Can Trade
The CME Group offers both standard and micro-sized contracts for corn. Here’s a quick overview:
o Standard Corn
Ticker: ZC
Size = 5,000 bushels
Tick = 0.0025 = $12.50
Margin = ~$1,050
o Micro Corn
Ticker: XC
Size = 1,000 bushels
Tick = 0.0050 = $2.50
Margin = ~$105
⚠️ Always confirm margin requirements with your broker. They change with market volatility and exchange updates.
The availability of micro corn contracts has opened the door for smaller traders to manage risk or test strategies without over-leveraging.
📊 5. Historical Price Behavior & Seasonality
Corn is deeply seasonal — and so is its price action.
During planting season (April–May), traders watch weekly USDA crop progress reports and early weather forecasts like hawks. A wet spring can delay planting, leading to tighter supply expectations and early price spikes.
Then comes pollination (July) — the most critical stage. This is when heatwaves or drought can do serious damage to yield potential. If temperatures are unusually high or rainfall is scarce during this window, markets often react with urgency, bidding up futures prices in anticipation of reduced output.
By harvest (September–November), prices often stabilize — especially if production matches expectations. But early frost, wind storms, or excessive rain during harvest can still trigger sharp volatility.
Many experienced traders overlay weather models, soil moisture maps, and historical USDA data to anticipate season-driven price shifts.
Even international factors play a role. For example, when Brazil’s safrinha crop suffers a drought, global corn supply tightens — impacting CME prices even though the crop is thousands of miles away.
🧠 6. What Every New Trader Should Know
If you’re new to corn trading, here are some key principles:
Watch the Weather: It’s not optional. Daily forecasts, drought monitors, and precipitation anomalies can move markets. NOAA, Open-Meteo, and private ag weather services are your friends.
Know the Reports: The WASDE report (World Agricultural Supply and Demand Estimates), USDA Crop Progress, and Prospective Plantings reports can shake up pricing more than you might expect — even if changes seem small.
Mind the Time of Year: Seasonality affects liquidity, volatility, and trader behavior. March–August tends to be the most active period.
Understand Global Demand: The U.S. exports a huge portion of its crop — with China, Mexico, and Japan as major buyers. A tariff tweak or surprise Chinese cancellation can cause wild price swings.
🛠️ Good corn trading is 50% strategy, 50% meteorology.
🧭 This article is part of a broader educational series exploring the relationship between agricultural commodities and weather patterns. In the upcoming pieces, we’ll dive deeper into how temperature and precipitation affect corn, wheat, and soybeans — with real data, charts, and trading insights.
📅 Watch for the next release: “Breadbasket Basics: Trading Wheat Futures.”
When charting futures, the data provided could be delayed. Traders working with the ticker symbols discussed in this idea may prefer to use CME Group real-time data plan on TradingView: www.tradingview.com - This consideration is particularly important for shorter-term traders, whereas it may be less critical for those focused on longer-term trading strategies.
General Disclaimer:
The trade ideas presented herein are solely for illustrative purposes forming a part of a case study intended to demonstrate key principles in risk management within the context of the specific market scenarios discussed. These ideas are not to be interpreted as investment recommendations or financial advice. They do not endorse or promote any specific trading strategies, financial products, or services. The information provided is based on data believed to be reliable; however, its accuracy or completeness cannot be guaranteed. Trading in financial markets involves risks, including the potential loss of principal. Each individual should conduct their own research and consult with professional financial advisors before making any investment decisions. The author or publisher of this content bears no responsibility for any actions taken based on the information provided or for any resultant financial or other losses.

SOYBEAN, Weekly Supply/Demand+fundamentals we are kicking of the year with a clear technical rejection from $1050 to $1112 weekly supply zone. Price pushed agressively into this area and has now printed multiple rejection candles on the daily, confirming the zones strength.
fundamentals are showing bearish positioning aligned with the technical setup.
entry wil be at market open. first target is at break of recent support and if fundamentals stil support the bias by then we wil also aim for target two.
simple structure, clean confirmation. lets see if price delivers.

Wheat- In a Clean Resistance Zone, can it reach 542.00?Wheat is already within a critical resistance zone that has times before led to bearish reversals. In any case this area, marked by previous price rejections, could once again attract selling pressure.
If bearish confirmation occurs—through rejection wicks, bearish engulfing candles, or a decrease in buying volume—we could see a decline toward the 542,00 level. However, a breakout above this resistance would invalidate the bearish outlook and suggest potential for further upward movement. So keep an eye on that.
Wait for clear signs of rejection before considering short positions.

SELL NASDAQAs you can see on the chart, we have our MS stll going bearish and the market gave us a confirmation of the reversal after the correction.
You can sell and take the same level I set on the chart.
Follow for more!

SELL NASDAQYou can SELL on NASDAQ | NQ1! | NAS100 with the same SL and TP wich is in the highest point of the LQ Pool.
Follow for more!

SELL NASDAQYou can sell on NASDAQ/NAS100/NQ with the same levels I set on the chart.
Follow for more daily trades!

Optimism setup long and short for future trade As shown below, since three months ago, the ETHBTC reaction has been occurring and slowly taking control. This can be used on coins that are tied to ETH. Fundamentally excellent price for DCA, but I would like to show the chance to those who deal with future trade.
With the setup, it is great to find where our analyzes are no longer valid and we need to admit that we are not right. Optimism is one of the coins that correctly did 1,2,3 according to Elliot. Now the question is whether the 4th wave will manage to reach our order, but we must be disciplined because this analysis is canceled if the fourth wave reaches deep enough to the first, where the setup is no longer valid.
Why this setup gives us the possibility of long - here is daily fvg, 4h fvg, 2h fvg, fibonacci for retest as well as theoretical knowledge about Elliott waves

Bitcoin Failing To PumpHey guys,
It looks like Bitcoin had its little pump from $60K to GETTEX:64K but now it appears that it can't hold up the price. It keep making lower highs in the short term and the signals look pretty bearish right now.
The MACD has a green dot on the daily but all other smaller time frames are rather bearish. Things can get volatile so we might see some pumps and dumps while the price consolidates. This could go on for another month or two yet before we see the price making a clear direction in the upward trajectory in October.
I'm looking at Bitcoin falling to $58,500 before we do a bit of sideways action with a positive twist.
If you agree with my thoughts please boost and subscribe!
When you need to decide. Let your heart be the guide.

TFEX S50 Swing ShortTFEX S50 Swing Short
Still keeping perspective in all my Trend
Primary, Secondary, Minor : Down Trend
This swing cycle saw another short position order at the Island Gap Reversals and Follow Sell when the price jumped down the next day.
Short only strategy with a price target of 770 along the Standard Deviation of the Volume Profile that forms a Normal Distribution shape.

NASDAQ-Feb 2024 3 Days remaining!Nasdaq seems on a fast track to close Feb 2024
And still a lot can happen in 3 days, which is the remaining time left to close the month.
One key point to make:
While Price continues to deliver within Bullish structure.
Weekly Price has been unable to close above 18071.
Current momentum is expected to continue to push price higher, but noting price's inability to close a weekly candle above this price area will open the possibility of repricing down.
It is what it is till its not
Price is expected to continue its up-close trend until it shows clear indication of weakness.
Looking for a possible Bearish Mon-Tues structure, setting the stage for Bullish continuation Wed-Thu.

dydxusdt.p Hello my friends
This is my analysis and thinking about this chart and I hope it gives you a trading idea
Follow me and give me a comment so that I can share more analysis for you

Are we rushing into the possible next Big Short?Is S&P 500 about to “CRASH”?
Are we rushing into the possible next Big Short?
So the S&P 500 futures contracts are depreciating in value, yes. Yet we foresaw this series of events. Has it been a rapid decline?
No.
The Price Action and structure continues sound.
There is no sign yet of panic or rapid selling signaling the Risk Off scenario all are predicting.
Do I expect further downside? Yes
I will go into my reasoning
1. DXY following a Bullish structure. Currently consolidating in a Bullish Flag pattern that could give us a break out of this pattern with a Higher High soon.
1. With a Bullish Dollar we can expect Bearish Equities.
Lets break ES pice action from top down.
- Monthly
- ES offered a Lower Low from June 23 Lows. But I am looking at the Monthly with caution since the month of October is not over yet.
- Weekly
- ES made its third down leg and yet it was unable to create a Lower Low in comparison to the week of October 2nd 23.
- The down closed weekly candle of last week looks strong enough to take out this low on momentum alone.
- So it is possible we will see 4235.5 before any other move.
-
- Daily
- On the Daily we see the last 4 Bearish days in a row, it can be assumed that the Bearish momentum along could carry price further down to establish a new Lower Low on this Bearish trend which will be at 4235.50
- I also like the potential of 4218.75
In conclusion. I do expect to see further downside but I would like to remind all that this will be the last week of October and to top that we are getting very close to establishing a new Lower Low on this Trend.
What does that mean?
Well we have had and extended leg down on this trend throughout the month of October. I would expect a retracement after a new Low is stablished with a subsequent bounce to settle a possible Lower High on this trend.
To accompany this thought it is the end of the Month and expecting a bit of retracemnt from the Monthly direction is healthy.
If you look at the Daily chart you will notice a gap between Thursday Oct 19,23
And Friday oct 20, 23. I am expecting price to target this Gap once the lows are stablished.
Still always follow price it will never steer you wrong.
