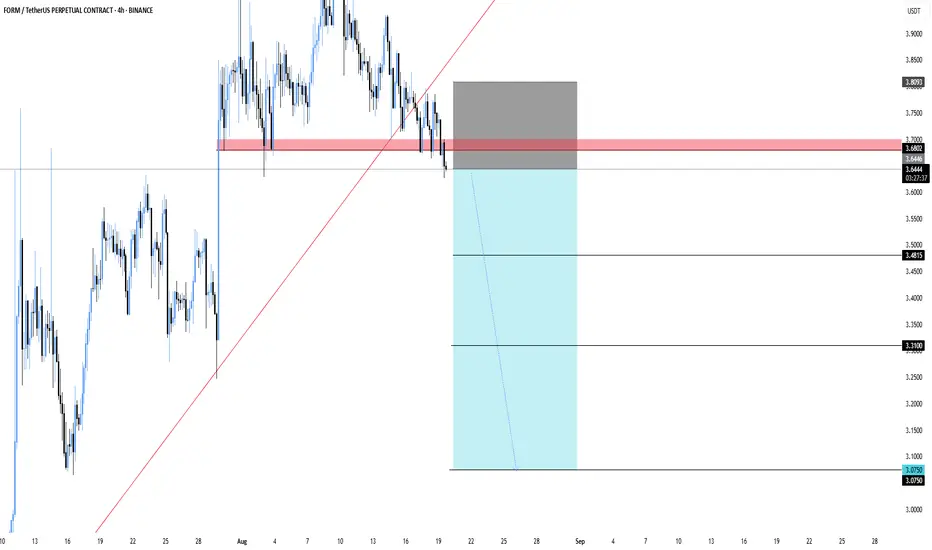
FORMUSDT.P – Break Below SupportFORMUSDT – Break Below Support
FORM has broken its trendline and slipped under the support zone. As long as it stays below this area, the momentum looks bearish with more room to the downside.
Entry: 3.64
Stoploss: 3.8093
Targets:
3.48
3.31
3.075
Let’s see if the breakdown continues or if buyers step back in.
Futurestrading
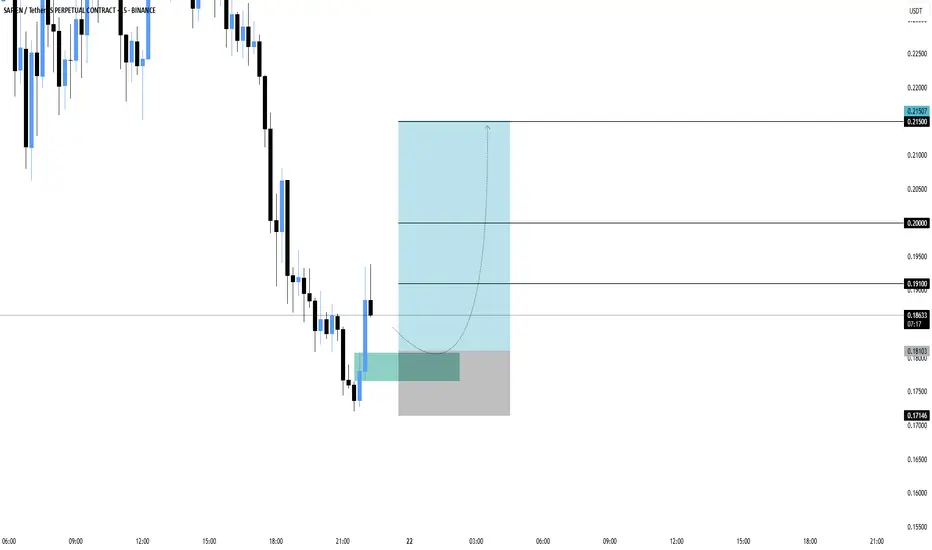
SAPIENUSDT – Bounce OpportunitySAPIEN is showing a potential reversal after tapping into the demand zone. If buyers hold this level, price could push higher toward key resistance levels.
Entry: 0.1810
Stoploss: 0.1715
Targets:
0.1910
0.2000
0.2150
Now the focus is whether momentum can sustain the bounce and drive toward the upper targets.
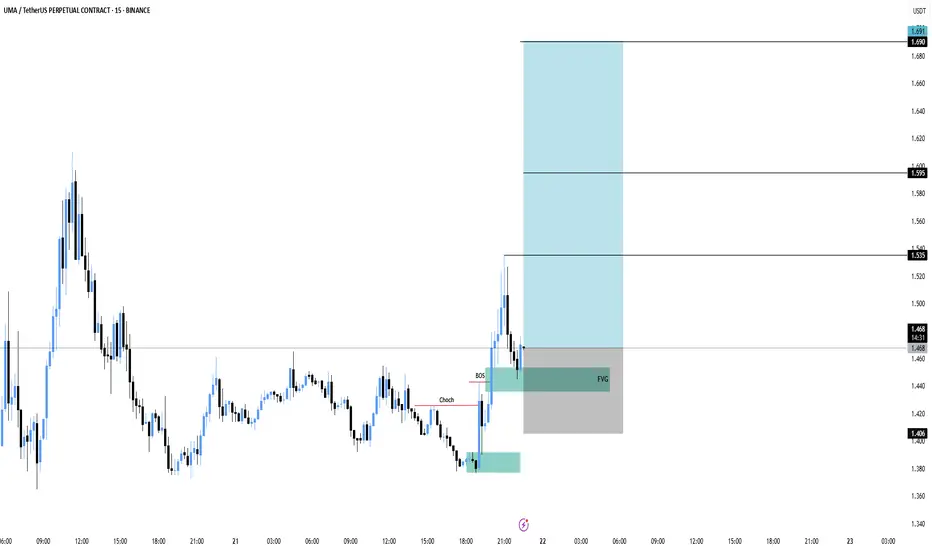
UMA Loading a Big Move – Don’t Miss This Setup!UMA has shown a clear change of character with a bullish break of structure. Price is now retesting the fair value gap (FVG) area, setting up for a possible continuation move upward.
Entry: 1.47
Stoploss: 1.406
Targets:
1.535
1.595
1.691
If buyers defend the FVG zone, UMA could rally toward higher targets with strong momentum.
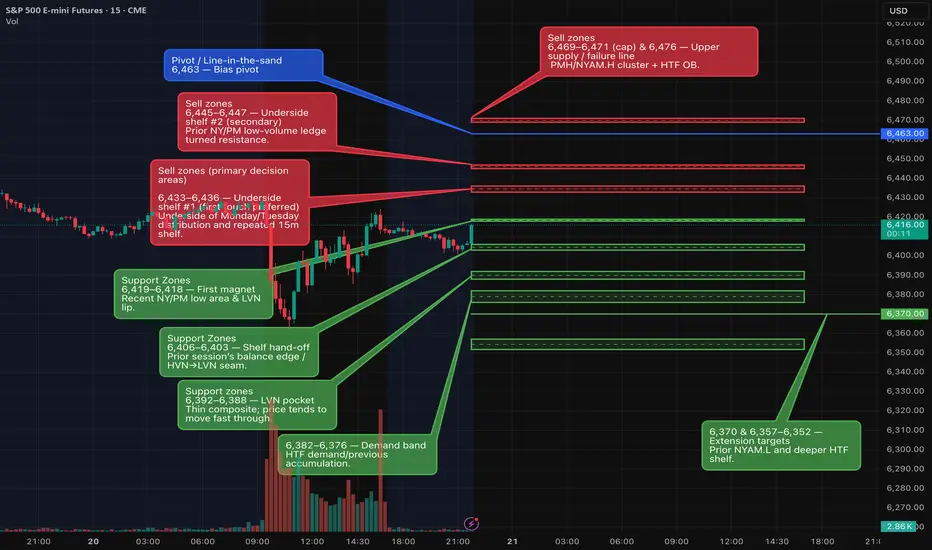
ES 08/21 — Key Levels - Short Bias - Setups - Fundamental Setups (A++ first)
1) SHORT — Retest-and-fail of supply (preferred)
• Zones: 6,433–36 or 6,445–47 (upper band 6,469–71).
• Trigger: 5-minute bearish close back below the shelf (no retest required); size to full only if a 15-minute bearish prints within the next 3×5m bars.
• Risk: entry +6–8 pts.
• TPs: +15 / +27 / +42 pts from entry (e.g., 6,445 → 6,430 / 6,418 / 6,403).
• Continuation guard: within 2×5m price must extend the low or print a lower high while failing to reclaim the shelf; otherwise cut ½ or scratch to BE.
2) SHORT — Breakdown & acceptance
• Trigger: 5m close < 6,418 and no immediate reclaim next bar.
• Risk: entry +6–8 pts.
• TPs: toward 6,406 → 6,392 → 6,382–76.
3) LONG — Only if promoted
• Trigger: 5m close & hold ≥ 6,436 (offers pull/flip; next bar holds).
• Risk: 6–8 pts (around 6,430).
• TPs: 6,451 → 6,459–60 → 6,471–72.
• Stand-down: lose 6,436 on a 5m close or see offers reload overhead.
Execution windows: 9:45–10:45 ET and 13:50–15:30 ET; avoid new risk 11:30–13:30 without momentum/confirmation.
Key levels (from HTF → LTF)
• Pivot / line-in-sand: 6,463 (short bias while ≤ this).
• Supply / sell zones: 6,433–36, 6,445–47, 6,469–71 (cap), 6,476.
• Supports / magnets: 6,419–18, 6,406–03, 6,392–88, 6,382–76, 6,370, 6,357–52.
Fundamentals — Thu, Aug 21, 2025 (ET)
• 08:30 — Weekly Initial Jobless Claims (DOL). Weekly claims are published Thursdays at 8:30 a.m. ET. 
• 08:30 — Philadelphia Fed Manufacturing Index (Aug). Next release Aug 21, 8:30 a.m. ET. 
• 10:00 — Existing Home Sales (July, NAR). NAR schedules the Jul report for Thu, Aug 21 at 10:00 a.m. ET. 
• 10:00 — Conference Board LEI (July). Thu, Aug 21, 10:00 a.m. ET.  
• 10:30 — EIA Weekly Natural Gas Storage. Standard release Thursdays 10:30 a.m. ET; next release Aug 21.  
• S&P Global Flash US PMI (Aug). Scheduled for Thursday (check S&P calendar; release times shown in UTC on their site). 
• Jackson Hole Economic Policy Symposium begins (Aug 21–23). 2025 theme: “Labor Markets in Transition.” 
How I’ll adapt intraday
• A stronger-than-expected Claims/PMI/Philly Fed that lifts yields and the USD into 6,433–36 / 6,445–47 favors setup #1 (fade the pop).
• EHS/LEI at 10:00 can whipsaw a breakdown—prefer acceptance before pressing setup #2.
• If Jackson Hole headlines skew risk-on and we accept ≥ 6,436, switch to setup #3 toward 6,451/60/71–72.
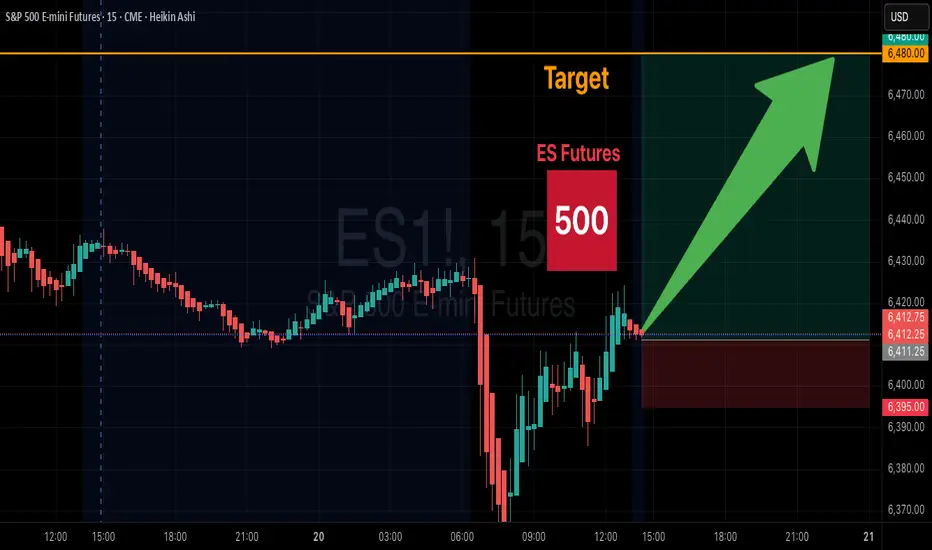
ES Futures Trade Setup – Long Opportunity
🎯 **ES Futures Trade Setup – Long Opportunity**
📌 **Instrument:** ES
📈 **Direction:** LONG
💰 **Entry Price:** 6415.50
🛑 **Stop Loss:** 6353.98 (1 ATR below entry)
🏹 **Take Profit:** 6480.00 (\~64.5 points)
📏 **Position Size:** 3 contracts
💪 **Confidence:** 65%
⏰ **Timing:** Enter at market open
⚠️ **Key Risks:** Mixed short-term signals may cause volatility. Move below 6400 could invalidate trade.
✅ **Rationale:** Long-term bullish trend remains intact; favorable risk-reward despite short-term bearish momentum.
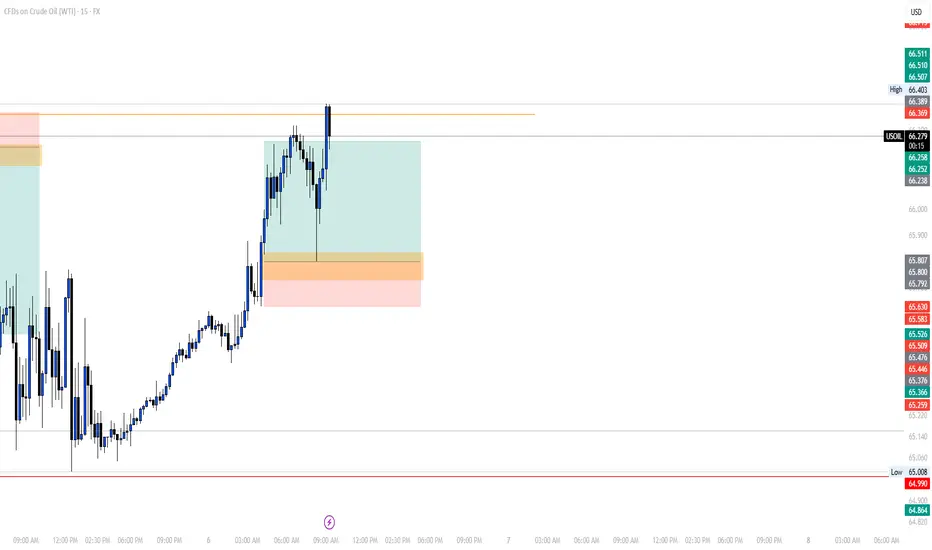
SELL USOILOur trade for today is on OIL as usual, in which we're going short after that the market grabbed the liquidity and gave us a clean entry to take.
Follow for more!

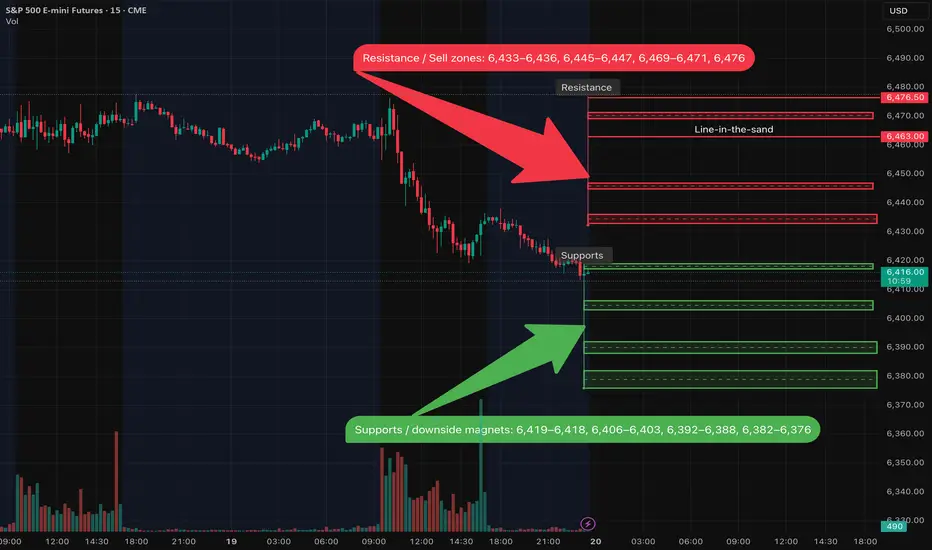
S 08/20 — Short bias below, Key Levels (watch FOMC minutes)Overview
Higher-timeframe trend has shifted lower. After failing at ~6,476, price broke the 6,446 shelf and printed a new low near 6,419 with expanding volume. As long as we remain below 6,463, I keep a short bias and will fade bounces into supply.
Key Levels
• Line-in-the-sand: 6,463
• Resistance / Sell zones: 6,433–6,436, 6,445–6,447, 6,469–6,471, 6,476
• Supports / downside magnets: 6,419–6,418, 6,406–6,403, 6,392–6,388, 6,382–6,376
Primary Plan — Bearish continuation
• Prefer selling failed retests into 6,433–6,436 or 6,445–6,447.
• Targets: first back to 6,419–6,418, then 6,406–6,403, and if momentum persists 6,392–6,388 / 6,382–6,376.
• Confirmation I want to see: intraday rejection wicks at the zone, momentum rolling over, and sellers stepping back in.
Alternative — Breakdown
• If price accepts below 6,418, I’ll look for continuation toward 6,403, then 6,392 / 6,376.
Invalidation / Neutralization
• Reclaiming 6,463 neutralizes the immediate short bias.
• Acceptance ≥ 6,471–6,476 opens squeeze risk toward 6,491 / 6,500; I’d stand aside on shorts until structure turns back down.
Event Risk (ET) — Wed 08/20
• 07:00 MBA Mortgage Applications
• 10:30 EIA Weekly Petroleum Status Report
• 13:00 U.S. 20-Year Treasury Auction
• 14:00 FOMC Minutes (Jul meeting)
Note: Expect headline-driven volatility around 14:00—I avoid initiating new positions into the release.
Posting Notes
This idea reflects levels visible on 1D/4H/1H (with 30m/15m for execution). I’ll update intraday if acceptance/rejection flips at the zones.
Day 11 — Trading Only S&P Futures — Mixed Signals, +$199Welcome to Day 11 of Trading Only S&P Futures!
Today was all about adapting and not forcing trades. I’ve noticed I usually perform best later in the day, so I’ve been starting with smaller contracts to warm up. Profits started rolling in, but things felt different — market makers kept flipping structure and trying to trap traders.
I was expecting more downside, but once I saw the MM games, I decided to protect profits and lock in +$199.20 instead of being greedy.
📰 News Highlights
STOCKS END MOSTLY FLAT TO START THE WEEK AS INVESTORS LOOK AHEAD TO POWELL SPEECH, RETAIL EARNINGS
🔔 VX Algo Signals (9:30am – 2pm EST)
7:01 AM Market Structure flipped bullish on VX Algo X3!
9:58 AM Market Structure flipped bearish on VX Algo X3!
9:58 AM VXAlgo ES X3DD Sell Signal
11:30 AM VXAlgo NQ X1DD Sell Signal
12:30 PM Market Structure flipped bullish on VX Algo X3!
12:50 PM VXAlgo NQ X1DD Sell Signal
2:00 PM Market Structure flipped bullish on VX Algo X3!
🔑 Key Levels for Tomorrow
Above 6460 = Remain Bullish
Below 6450 = Bearish

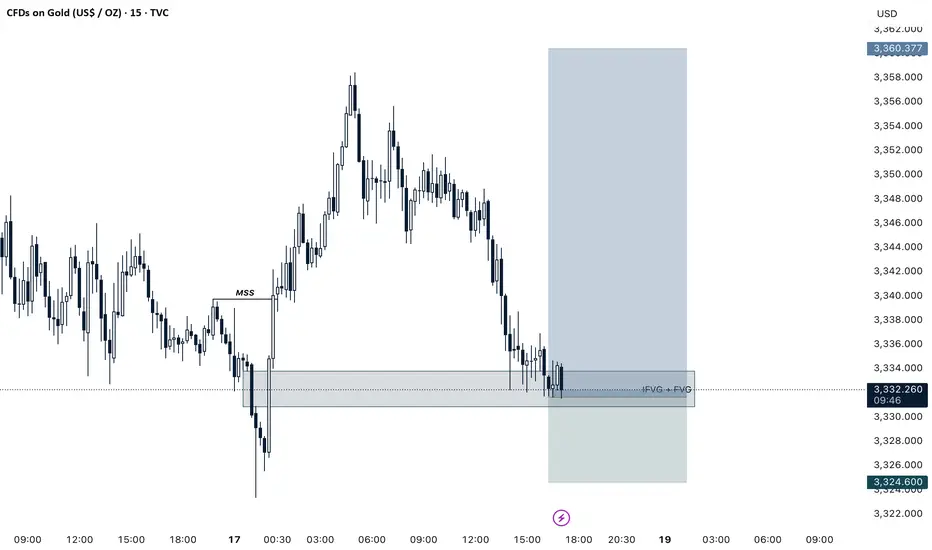
MSS + IFVG + FVG GOLD BUY SETUPGold Looking For Bullish With A Strong Setup
Strategy : MSS + IFVG + FVG
Lets Take Buy Trade Now Target 3360
Entry Price CMP
Manage Your Trades Properly And Follow Us For More Trades
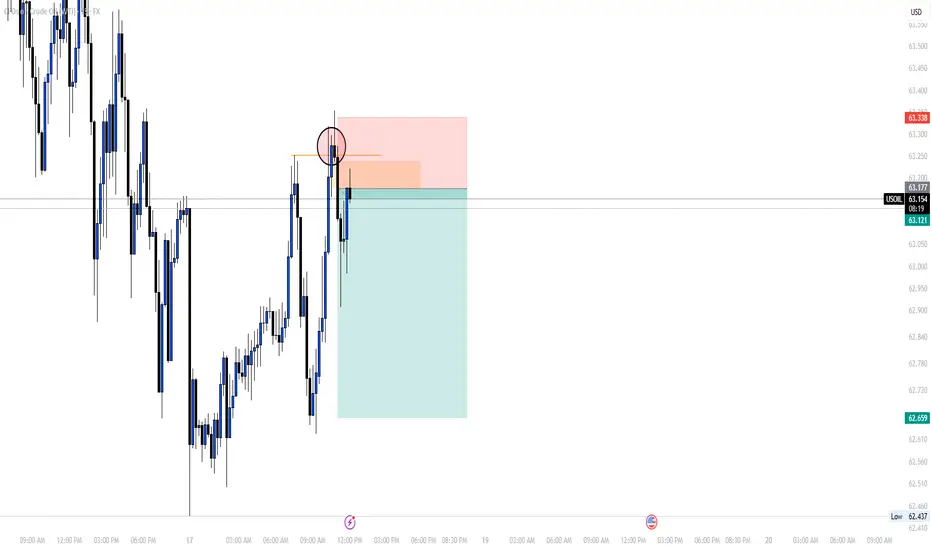
SELL USOILHere we are again with a new trade on USOIL, in which u=you can sell following the same levels as mine.
We sold after that the price did grab the liquidity and gave us a FVG to enter based on.
Follow for more!
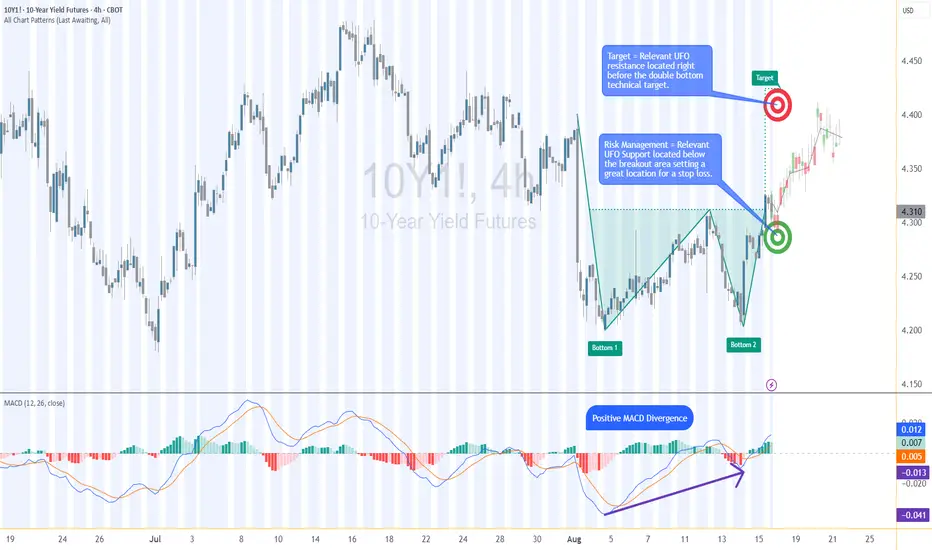
10Y Futures Case Study: Trading the Breakout with Defined Risk1. Introduction
The 10-Year Yield Futures market has recently drawn attention as it builds a constructive base and attempts to shift momentum higher. After weeks of choppy movement, price action on the 4-hour chart has resolved into a breakout scenario that could define the next leg for yields. At the heart of this case study is a double bottom formation, a classical reversal structure, confirmed at 4.321. What makes this setup more compelling is the presence of nearby support and resistance zones, providing a precise technical framework to define entries, targets, and stop placement with discipline.
2. Double Bottom Pattern
The double bottom is one of the most reliable chart patterns signaling the potential exhaustion of selling pressure. It typically forms after a downtrend, with two consecutive troughs creating a strong support base before buyers regain control. In the current 10-Year Yield Futures chart, the first bottom occurred near 4.20, followed by a retest close to the same level. The neckline breakout emerged at 4.312, marking the confirmation point. Applying classical pattern analysis, the measured move points toward a target near 4.396. This alignment of structure and projection provides traders with a clear and objective technical roadmap.
3. MACD Confirmation
Momentum indicators often add depth to price action analysis, and the MACD (Moving Average Convergence Divergence) is one of the most widely followed. Built from the relationship of short- and long-term moving averages, it helps reveal underlying shifts in strength. In the current 10-Year Yield Futures chart, the MACD displayed a positive divergence: while price carved lower lows during the second bottom, the MACD lines began to slope higher. This divergence often signals weakening bearish momentum and the early stages of accumulation. In this case, it reinforces the validity of the double bottom breakout and its bullish potential.
4. UFO Support & Resistance
UnFilled Orders, or UFOs, represent areas where pending buy or sell orders may remain active, providing powerful zones of support or resistance. On the 10-Year Yield Futures chart, a key UFO support sits just below the breakout at 4.278, making it a logical stop-loss placement to protect the trade. Meanwhile, the upside target of the double bottom at 4.396 coincides with a UFO resistance zone. This overlap creates a clear exit area where supply may re-emerge. By combining classical charting techniques with order-flow–based zones, traders gain a structured plan that balances opportunity with risk control.
5. Trade Idea (Illustrative Case Study)
In this case study, the trade idea develops around the breakout point of 4.312 with the current price at the time of writing this article of 4.321. A trader could consider going long if the market sustains above this neckline level. The projected target is the resistance zone at 4.396, while the protective stop loss can be placed just below the UFO support at 4.278. This creates a defined risk profile with a reward-to-risk ratio of roughly 2:1. Alternatively, more conservative traders might consider a wider stop beneath the second bottom, offering more tolerance against volatility but at the expense of risk-reward efficiency. Both options maintain risk clarity and structure.
6. Contract Specifications & Margin Overview
The 10-Year Yield Futures (ticker: 10Y or 10Y1! on TradingView) is a cash-settled futures contract that tracks the 10-year U.S. Treasury yield directly. The gain or loss per tick per contract is as follows: 1 tick = 0.001 Index points (1/10th basis point per annum) = $1.00.
According to CME’s margin schedule (which changes as market conditions change through time), the current margin requirement is approximately $300 per contract. These relatively modest requirements make the product accessible while still providing meaningful exposure to U.S. interest rate markets.
7. Importance of Risk Management
Even with technically strong setups, the defining factor between consistent traders and inconsistent ones is risk management. Futures are leveraged products, meaning a small price move can translate into significant profit or loss. Using stop-loss orders helps enforce discipline, ensuring that one trade does not spiral into uncontrolled exposure. In this case, the support at 4.278 provides a logical technical area for a stop. Regardless of market outlook, avoiding undefined risk is key to long-term survival and consistency.
8. Closing Remarks
The alignment of a double bottom breakout, positive MACD divergence, and key support and resistance zones creates a textbook technical case study in the 10-Year Yield Futures market. With a clearly defined entry, target, and stop-loss, this setup demonstrates how combining price patterns with momentum and order-flow levels can help build structured trade plans. Yet, no analysis guarantees outcomes, and discipline remains at the core of every approach.
When charting futures, the data provided could be delayed. Traders working with the ticker symbols discussed in this idea may prefer to use CME Group real-time data plan on TradingView: www.tradingview.com - This consideration is particularly important for shorter-term traders, whereas it may be less critical for those focused on longer-term trading strategies.
General Disclaimer:
The trade ideas presented herein are solely for illustrative purposes forming a part of a case study intended to demonstrate key principles in risk management within the context of the specific market scenarios discussed. These ideas are not to be interpreted as investment recommendations or financial advice. They do not endorse or promote any specific trading strategies, financial products, or services. The information provided is based on data believed to be reliable; however, its accuracy or completeness cannot be guaranteed. Trading in financial markets involves risks, including the potential loss of principal. Each individual should conduct their own research and consult with professional financial advisors before making any investment decisions. The author or publisher of this content bears no responsibility for any actions taken based on the information provided or for any resultant financial or other losses.
ES (S&P 500 Futures) - Week Plan Aug 18–22Context (W/D/4H/1H/30M): ES is consolidating just under 6,500. Price is boxed roughly 6,466 ↔ 6,504/12 with a cluster of highs above and recurring demand tests below.
Key Levels (zones, not single ticks):
Resistance: 6,504–6,512 (near-term lid). Above that: 6,520–6,550 (weekly supply/“weak high”).
Decision level: 6,492–6,495 (where control often flips intraday).
Supports: 6,464–6,466 (first support) → 6,436–6,440 → 6,380–6,395 (deeper support).
How to read it:
Bull path: A firm break and hold above 6,504 favors a push toward 6,520 → 6,535 → 6,550.
Bear path: Failure at 6,495 or a clean break below 6,464 opens 6,440 → 6,390.
If price stays between 6,466 and 6,504, expect range behavior until a catalyst pushes it out.
Scenarios (next week):
Range continues: Chop between 6,466–6,512 until mid-week events.
Upside break: Hold above 6,504 → test 6,520–6,550 (watch for reaction there).
Downside break: Lose 6,464 with momentum → 6,440, then 6,390 if pressure persists.
Key events (ET):
Wed: Federal Reserve meeting minutes (afternoon).
Thu: Weekly claims; flash PMIs; existing home sales (morning block).
Thu–Sat: Jackson Hole economic symposium (watch for policy remarks).
Notes: Levels are zones and may see initial reactions before acceptance or rejection. This post is for market commentary/education only.

Day 8 — Trading Only S&P Futures — From -400 to +155Welcome to Day 8 of Trading Only S&P Futures!
Today was a battle of patience and discipline. I started the day with a -400 loss from an overnight short order that got stopped out before the market even opened. It was tempting to close up shop, but I traded small, stayed disciplined, and waited for the right setup.
Once I saw the X7 Sell Signal align with X3 Bearish Structure, I sized up — turning the day from deep red to +155 before fees.
📈 What you’ll learn
How to manage a big overnight loss without spiraling
The importance of sizing down until confidence returns
Using structure + signal alignment for A+ setups
Patience in clawing back losses
⏰ Timestamps
0:00 — Intro & Day 8 Recap
0:40 — The Overnight Loss & Mindset Shift
1:40 — Clawing Back With Small Trades
2:20 — The X7 + X3 Bearish Alignment Trade
3:00 — Market News & Impact
3:30 — Key Levels for Tomorrow
📰 News Highlights
DOW jumps over 400 points, VIX falls as stocks end higher on rate cut bets.
🔔 VX Algo Signals (9:30am – 2pm EST)
3:00 AM Market Structure flipped bullish on VX Algo X3!
9:30 AM VXAlgo ES X1 Sell Signal
9:42 AM VXAlgo NQ X1 Sell Signal
10:00 AM VXAlgo ES X1 Sell Signal
10:26 AM VXAlgo ES X7 Sell signal
10:30 AM Market Structure flipped bearish on VX Algo X3!
11:20 AM VXAlgo ES X1 Buy signal (double buy)
1:25 PM VXAlgo NQ X3 Buy Signal
2:13 PM Market Structure flipped bullish on VX Algo X3!
🔑 Key Levels for Tomorrow
Above 6440 = Remain Bullish
Below 6410 = Bearish

Bullish Energy in Natural Gas: -DMI Extreme + Wedge BreakoutThe Spark in the Gas Market
Natural gas has been quietly simmering in recent weeks, building pressure beneath a surface of consolidation. Traders watching closely will have noticed a rare alignment — one that history shows can potentially precede outsized moves. We’re talking about the convergence of two powerful signals: a -DMI yearly extreme and a falling wedge breakout.
In the past, this combination has marked moments when bearish momentum had run its course, giving way to swift and decisive bullish reversals. Now, that same alignment is flashing again, inviting a closer look at the technical landscape and the potential opportunities it presents.
Why This Setup Matters
The -DMI (Directional Movement Index) measures the strength of downward price moves. When it pushes beyond two standard deviations above its yearly linear regression channel, it signals an overextended bearish phase. Historically, these extremes have often coincided with market bottoms in Natural Gas Futures.
Layer on top a falling wedge — a bullish reversal chart pattern — and the probability of an upside move gains weight. The wedge compresses price action into a narrowing range, reflecting reduced volatility and setting the stage for a potential explosive breakout once resistance gives way. The current breakout level sits near 3.18, with technical projections aligning closely to a well-defined UFO resistance (UnFilled Orders) zone around 3.90.
The Technical Story Unfolds
Looking at the daily chart in the present, the -DMI has recently breached the +2 standard deviation boundary of its 252-period regression channel — a rare occurrence that, as said, has preceded multiple major bullish reversals in the past year. When this condition appeared, downside momentum often faded, making room for buyers to take control.
This time, the current signal aligns with a falling wedge that has been developing for weeks. Price is about to break above the wedge’s upper boundary at approximately 3.18, suggesting a potential trend reversal.
The Trade Blueprint
Direction: Long
Entry: 3.18 (confirmed breakout above wedge resistance)
Target: 3.90 (wedge projection + UFO resistance)
Stop Loss: 2.858 (below wedge and technical support floor)
Reward-to-Risk Ratio: ~2+ to 1
This structure allows traders to define risk tightly while targeting a meaningful upside move. The setup applies equally to both Natural Gas Futures (NG) and Micro Natural Gas Futures (MNG), offering flexibility in capital allocation. For smaller accounts or those wanting to reduce margin exposure, the MNG contract delivers the same tick size precision with only one-quarter of the notional value.
The Contract Advantage
Natural Gas Futures (NG) represent 10,000 MMBtu per contract, with a minimum tick size of 0.00025 — equivalent to $2.50 per tick.
Micro Natural Gas Futures (MNG) are one-tenth the size at 1,000 MMBtu per contract, with the same 0.00025 tick size equaling $0.25 per tick.
Margin requirements vary with volatility and exchange adjustments, but at the time of writing, the CME lists initial margin for NG in the range of $3,500 per contract, while MNG margins are proportionally lower at $350 per contract. This creates flexibility for traders to scale positions or manage risk without altering the technical logic of the trade. Both contracts trade nearly 24 hours per day, Sunday through Friday, offering the ability to react to global energy market shifts in real time.
Risk Management as the Safety Valve
Defining risk is the cornerstone of any trade plan. The stop loss at 2.858 is not arbitrary — it sits below both the wedge’s lower boundary and a nearby technical support level. If price were to close below this level, it would undermine the bullish thesis and call for an exit.
Using smaller MNG contracts can help align risk with account size, allowing for partial position scaling and better drawdown control. Equally important is avoiding undefined risk scenarios, particularly in a commodity as volatile as natural gas. Precision in both entries and exits reduces exposure to intraday whipsaws while maintaining the trade’s structural integrity.
Closing the Loop
The natural gas market has aligned a rare set of conditions — a -DMI yearly extreme and a falling wedge breakout — each of which has historically preceded significant upside moves on their own. Together, they offer a compelling technical case for a defined, risk-managed long position targeting the 3.90 zone.
While no setup guarantees success, this one seems to offer clarity: a well-defined entry, stop, and target, supported by historical probability and pattern structure. In volatile markets, those moments of clarity are worth paying attention to — and acting on with discipline, and always depending on the trader’s trading plan.
When charting futures, the data provided could be delayed. Traders working with the ticker symbols discussed in this idea may prefer to use CME Group real-time data plan on TradingView: www.tradingview.com - This consideration is particularly important for shorter-term traders, whereas it may be less critical for those focused on longer-term trading strategies.
General Disclaimer:
The trade ideas presented herein are solely for illustrative purposes forming a part of a case study intended to demonstrate key principles in risk management within the context of the specific market scenarios discussed. These ideas are not to be interpreted as investment recommendations or financial advice. They do not endorse or promote any specific trading strategies, financial products, or services. The information provided is based on data believed to be reliable; however, its accuracy or completeness cannot be guaranteed. Trading in financial markets involves risks, including the potential loss of principal. Each individual should conduct their own research and consult with professional financial advisors before making any investment decisions. The author or publisher of this content bears no responsibility for any actions taken based on the information provided or for any resultant financial or other losses.

BTC - Short Trade / Crash Update and DetailsPer my previous post here are the details on my personal trade. Note this is NOT financial advice, and this is my own personal trading plan only. Please use your own judgement.
Entry - 116,300 to 116,600
Stop Loss - 121,800
Target 1 - 95,700
Target 2 - 61,500
Target 3 - 35,000
Target 4 - 8,000
Note that Bitcoin should move up from the 35,000 target to 88,000 making a corrective wave on HTF.
At this point I will post an update and advise my own strategy and if I long 35,000 to 88,000.
Happy trading

SELL USOILOur 2nd trade if the day on USOIL is a short one again since the price kept grabbing BSL to continue pushing lower and lower.
You can sell and follow the same levels as mine
Follow for more!
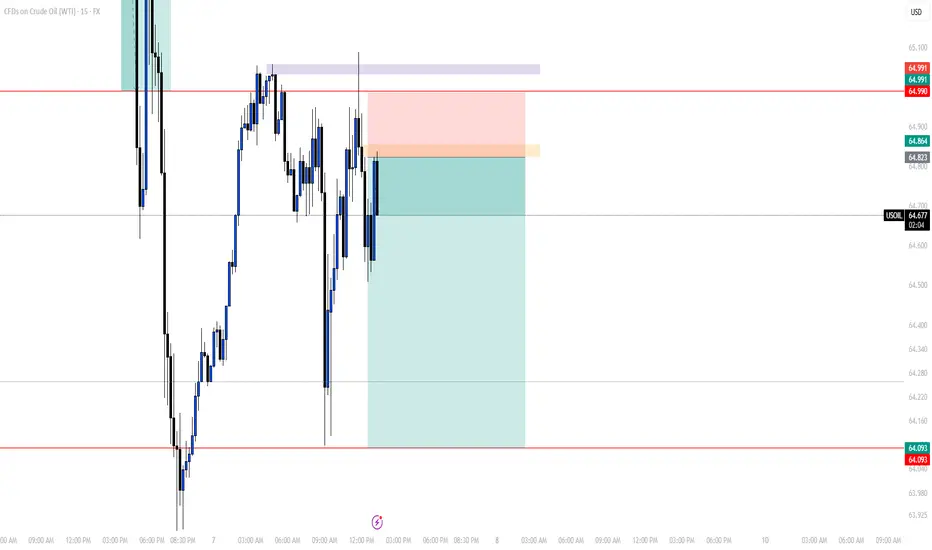
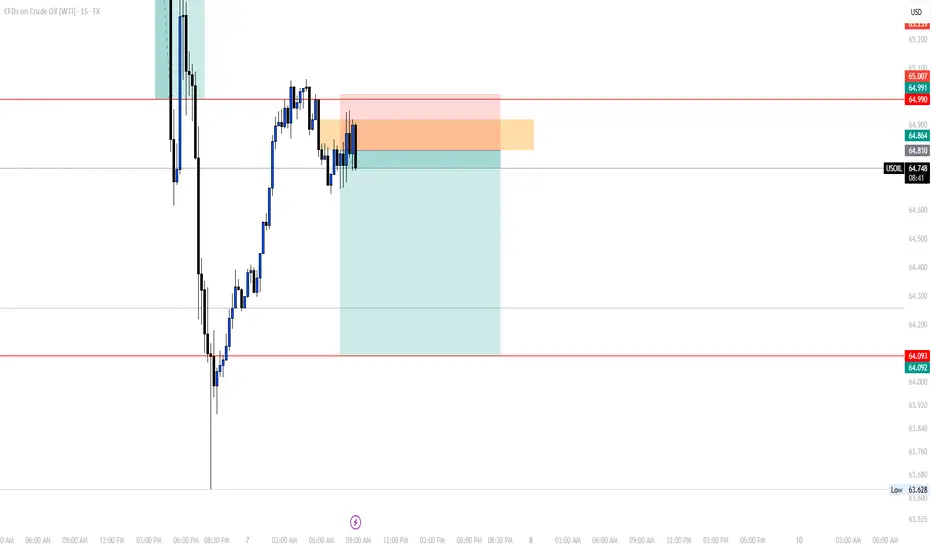
UPDATE ON THIS MORNING'S TRADEEarly in the morning, I posted a trade (Sell USOIL) in which we trargeted the LQ level which the market came closer to and didn't touch, which isn't a big deal.
As you can see on the chart, as I told my students during the LIVE TRADING SESSION they assisted, it's all about trade management.
On the screenshot on the left, we added another order at 50% lvl of the FVG, xhich the market respected at that moment before giving us a double bottom which is a sign to the change of the movement of the market.
For a safe closure of the trade, as you can see in the picture on the left, we waited for the market to break through the 5min LQ we have to close, and that's what exactly happened.
We'll wait for another trade to take later in the US session.
Follow for more!

SELL USOILThis morning we're going short again on OIL, since as you can see the price grabbed the LQ and gave us a proper rntry point we entered based on 1h ago.
Follow for more!
Day 3 — Trading Only S&P 500 FuturesDay 3 — Trading Only S&P Futures
Daily P/L: -142.87
Sleep: 7 hours
Emotions: Headache & stress from the morning
:thought_balloon: Today’s Trade thoughts:
I made a typo when i was putting some orders in from last night that triggered and started the day -300 so I spent most of today just grinding it back again.
I think going forward, I am going to make a rule to limit myself of only doing 2 MES MAX during night time if i plan to put orders in because it really sadden the mood when you start the day negative.
Overall, today's trading day wasn't that bad, we had bullish structure and AAPL event that carried the market up. I took some shorts at 6355 that didn't work out but eventually made money at the end of the day as i shorted 6375 zones. I have noticed that** max Gamma levels don't truly settle until 11am. **
:bell:News Highlights:
*TRUMP TO IMPOSE ADDITIONAL 25% TARIFF ON GOODS FROM INDIA
:bar_chart: VX Algo Signals (9:30am – 2pm EST):
9:30 AM Market Structure flipped bullish on VX Algo X3! @everyone*
10:20 AM VXAlgo NQ X1 Sell Signal
11:00 AM Market Structure flipped bullish on VX Algo X3!
11:40 AM VXAlgo ES X1 Sell Signal
12:20 PM VXAlgo ES X1 Sell Signal (double sell)
1:40 PM VXAlgo NQ X1DD Buy Signal (double buy)
:chart_with_upwards_trend: Key Levels for Tomorrow:
Above 6332 = Remain Bullish
Below 6315 = Bearish

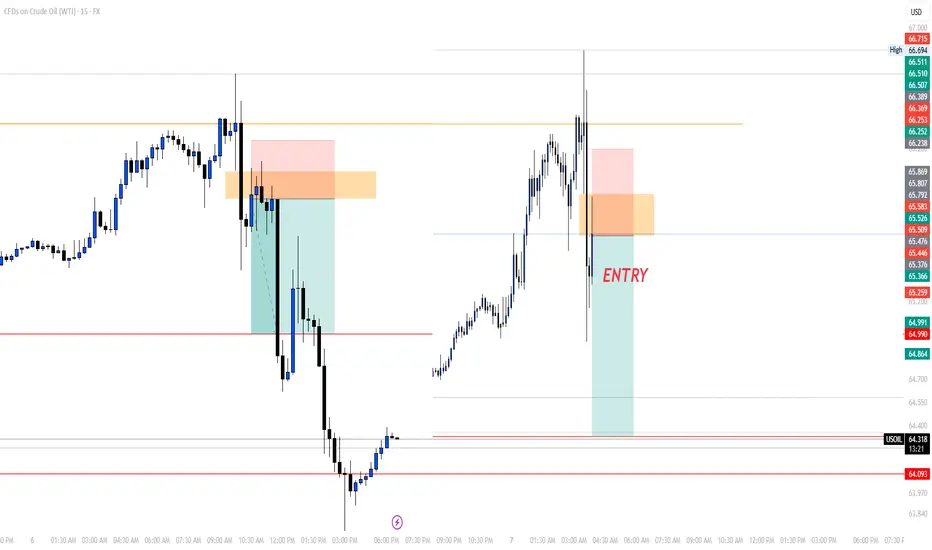
OUR TRADE FOR THE DAYEarly today, I posted that we'll be waiting for the market to give us an entry after grabbing the liquidity, we did have it and caught it.
I didn't share it since it was given to my students.
As you can see on the chart, the market gave us a FVG after that it did grab the liquidity which we entered based on to target again the LQ level to close with a good margin.
Follow for more!
TRADE CANCELEDThis morning I posted to take a long trade and we canceled it since the price didn't come to our entry point which is a normal thing to happen, now after that it took the daily LQ, we'll be waiting for the price to give us a sort entry to take.
Follow for more!
BUY USOILI'm sharing with you our trade today on OIL.
The reason we're buying is because yesterday the market grabbed the LQ now it is reversing to climb higher to fill all of the FVG we got in the previous movement.
For a safe entry, wait for the price to come back to our entry poin at 65.800 since I myself am waiting for the price to come to our entry point.
Follow for more!

Day 2 — Trading Only S&P Futures — -$100, Grinding Back from Los Day 2 — Trading Only S&P Futures
Daily P/L: -100
Sleep: 8 hours
Emotions: Good
:thought_balloon: Today’s Trade thoughts:
I rushed into a trade thinking 6330 was going to be a good area of support to buy and oversized my position going 5 mes deep in my first trade and adding 5 more at the 48 min MOB at 6325 and got stopped out at the bottom down -400 and pretty much spent the rest of the day grinding back up.
Overall market seem to have rejected the higher timeframe resistance and deciding which direction to go.
:bell:News Highlights:
U.S. STOCKS END LOWER, VIX JUMPS AFTER WEAK ISM SERVICES DATA
:bar_chart: VX Algo Signals (9:30am – 2pm EST):
— 9:30 AM VXAlgo ES X1 Buy signal
— 9:40 AM VXAlgo NQ X1 Buy Signal
— 9:48 AM Market Structure flipped bullish on VX Algo X3!
— 11:00 AM VXAlgo ES X1 Buy signal (triple buy signal)
— 12:50 PM VXAlgo NQ X1DD Sell Signal
— 1:00 PM Market Structure flipped bullish on VX Algo X3!
— 1:30 PM VXAlgo NQ X1DD Buy Signal**
:chart_with_upwards_trend: Key Levels for Tomorrow:
Above 6332 = Bullish
Below 6310 = Bearish
