FARTCOIN / USDT Daily Close Above Key Zone— Upside Targets AheadFARTCOIN / USDT can maintain its bullish continuation if the next daily candle closes firmly above the $0.2540–$0.2725 zone. A strong hold and positive reaction from this area would open the door for a clean move toward the $0.35–$0.37 range. Wait for confirmation and manage risk carefully before entering.
Fvg_strategy

BTC Short-Term Bullish Structure | Key Zone Reaction in FocusBitcoin is maintaining a strong bullish structure on the lower timeframes. Price is currently holding above key support, and the overall momentum remains in favor of buyers. A pullback into the lower key demand zone would be healthy. If BTC reacts strongly from this area and holds above support, it will confirm continuation strength and open the path for a bullish expansion toward the 91K level in the short term.

ZEREBRO Reset and Rebound opportunity | Target $0.0382After an unsuccessful breakout, the price is expected to reset and prepare for another strong push. If the price reacts from our entry zone, the target is set at $0.03280.
Follow the setup accordingly and manage risk wisely.

KITE / USDT Bullish Structure — Watching Retest for ContinuationKITE / USDT is holding bullish structure and consolidating above key support. A clean retest of the marked entry zone can offer a good long opportunity, while a direct continuation without retest will remain risky. As long as price stays above the invalidation level, the upside remains intact with targets toward the higher resistance zone. Manage risk wisely and follow price reaction.

HYPE Weak Structure — Watching 4H FVG for RejectionHYPE / USDT is showing clear weakness and price is moving upward to fill the 4H FVG. If we see a rejection from this zone, a decline toward $21.050 is likely. Follow the setup closely, wait for confirmation, and manage risk wisely.

ZRO Weakness Into 4H FVG — Watching for Reversal Toward $1.50ZRO / USDT is showing weakness and continues to decline toward the 4H FVG zone at $1.24–$1.21. This area will be important to watch for a potential reaction. If price shows strength from this FVG, a reversal toward $1.50 can follow. Manage risk wisely and wait for confirmation.

LTC Approaching Key 4H FVG Zone_Reversal Setup AheadLTC is showing clear weakness and continues to drift lower, likely heading toward the 4H FVG zone at $76.2–$77.3. This area will be key for a potential reversal. If price reacts strongly from this zone, a clean recovery move toward the EQH liquidity level at $87.5 is expected. Manage risk wisely and wait for confirmation.

PENDLE / USDT preparing for next bullish leg up After FVG tapPendle / USDT is looking strong, but I’m expecting price to first tap the 4H FVG zone before continuing its trend towards $3 – $3.5…
A clean reaction from that zone can trigger the next bullish wave, so waiting for confirmation is important here. Momentum is still in favor of buyers, but entries should always be planned with patience.
Manage risk wisely and only enter after a clear confirmation.

Bullish on eur/usdHello world i did my analysis in eur/usd and i see a potential bullish move toward the equal high at 1.16688.
the price is delivering from a Bullish D fvg then created a D ifvg that is getting respected till now and we have a low resistance liquidity run ( that's the parallel channel) that's pretty much why i expect a bullish move in eur/usd
drop comment i will answer all of them!
Thank you.

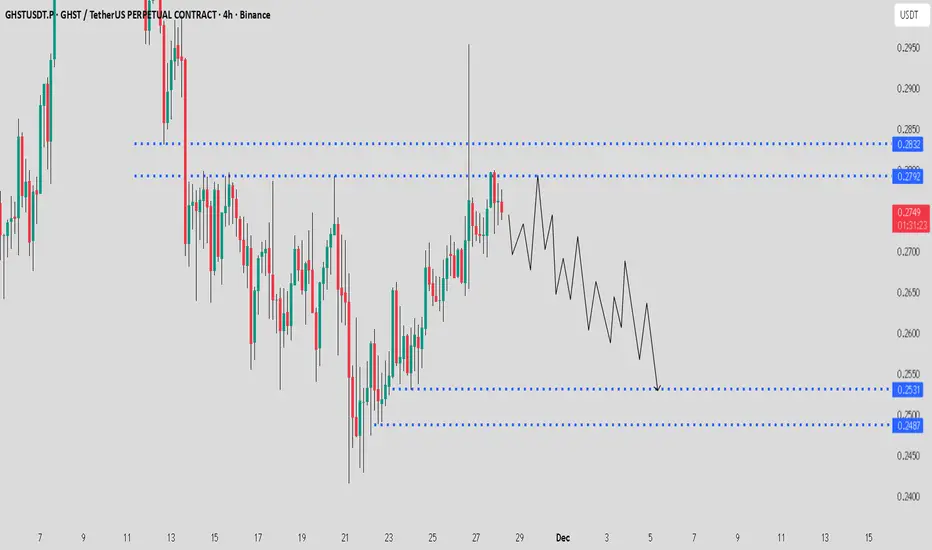
GHST / USDT Weak below FVG resistance_More downside expectedGHST / USDT is showing weakness after rejecting from the FVG resistance. Price is likely to move towards the $0.2530 – $0.2487 zone before any potential reaction. This area remains the safer zone for taking profit on shorts. More downside is still possible, so manage risk and keep stops above the upper marked level.
My Prediction for BTC 2025-2026 Bouncing between the Green lines !
I hope you understand my chart! What goes up must come down and vice versa! What goes down must go up! Also see the fair value gaps hitting 🫣🤩 I hope to validate! Let’s see if and when 🤓
Greetings and happy trading 🫡

EURNZD: sellers remain in control - upside still rejectedEURNZD confirmed weakness above resistance once again. Breakout attempt failed, price returned below supply and trend line. Every bullish push is absorbed, indicating sellers still dominate. H4 structure stays bearish: failed breakout followed by BOS down, weak buyer on retest.
FVG above and supply zone remain untouched, acting as liquidity cap. Lack of momentum up and return into range support continuation toward 2.0050 and then 1.9750, where previous accumulation and liquidity cluster sit.
Plan: look for shorts on pullback into FVG with weak orderflow, targets 2.0050 and 1.9750. Bullish scenario only above 2.0230 with strong momentum and follow-through — then buy pullback toward 2.0400.
When market teases breakout but every rally dies instantly — trend continuation is still in play. Confirmation first, assumptions later.

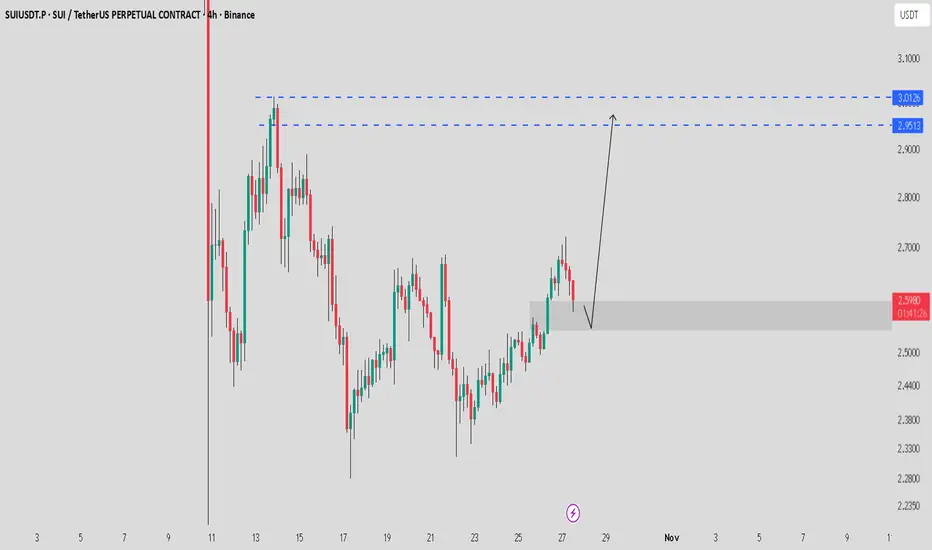
SUI / USDT Testing FVG zone_Watching for reversal towards $3SUI is showing strong momentum and currently testing the FVG zone on the 4H timeframe.
If price bounces from this support, we could see a move towards $2.95 – $3.01.
Note: Wait for a proper confirmation of reversal — a breakdown below this zone will invalidate the setup.
Liquidity Trap or Smart Money Play? SUI Price Poised for Big Liquidity Trap or Smart Money Play? SUI Price Poised for Big Move Ahead”\
👋 Hello Traders & Investors,
Looking at SUI, the price action is showing a very interesting structure between the support zone ($11B – $11.5B) and the resistance zone ($14.5B – $15.5B). We already saw a strong impulse leg earlier, followed by a deep pullback, which created a clear lower high formation. Since then, the market has been rejecting each rally attempt and moving inside a descending structure, proving that sellers are still trying to keep control.
What stands out is the fake break below support — a classic liquidity grab where weak hands were shaken out before price quickly bounced back. Since then, liquidity has been building along the descending line, suggesting that the market is preparing for a possible stronger move.
From my perspective, the support zone is the key. As long as $11B continues to hold, there’s a high probability of seeing a sharp bullish reaction targeting the $14B area and potentially higher if momentum follows through. But if this support breaks convincingly, we may first see a deeper correction before any meaningful reversal begins.
⚡ My Opinion: This setup is worth watching closely. I believe buyers are waiting at the support to trigger a strong move upward, and the next liquidity sweep could fuel the rally. For me, the plan is simple — watch the reaction at $11B and ride the momentum toward the $14B–$15B region if confirmation comes.

“XAUUSD – Strong Retracement From New All-Time High (ATH) 3650“XAUUSD – Strong Retracement From New All-Time High (ATH) 3650 📉”
Gold (XAUUSD) reached the all-time high resistance / PRZ zone (3645–3680) and immediately showed rejection signs, confirming this level as a high-probability reversal point.
📊 Technical Breakdown
PRZ Rejection: The move above 3650 failed to sustain, indicating a liquidity grab and false breakout structure.
Momentum Exhaustion: A parabolic advance from 3330 support into ATH left behind multiple imbalances (FVGs) that now attract price back down.
Liquidity Dynamics: The rejection suggests buy-side liquidity has been taken, and the market may now seek sell-side liquidity below recent swing lows.
Market Structure: Intraday structure shows early signs of a bearish shift, with lower highs forming under 3635–3625.
🎯 Downside Targets
3585–3578 → First corrective level (38.2% retracement).
3565 → Key midpoint of the rally.
3545–3516 → Liquidity + 61.8–78.6% retracement cluster.
3480–3460 → Previous consolidation base.
3330–3320 → Major high-timeframe support demand zone.
⚠️ Invalidation
If buyers reclaim 3660–3680 with strong daily closes, the bearish retracement scenario will be invalidated, opening the path toward new ATH extensions.
📌 Conclusion:
Gold’s rejection at 3650 ATH PRZ is a significant technical signal. Current order flow suggests a retracement phase toward 3580–3515, with potential extension to 3330–3320 key support if selling pressure persists.

(XAUUSD) 30-Min Chart – Liquidity Grab & Bullish SetupGold is currently trading around $3,594, after breaking out of a descending trendline (🔻➡️📈). This breakout suggests a potential shift in momentum, but price is still below a strong resistance zone around $3,595–$3,600 🧱, where sellers may still be active.
🔸 A liquidity sweep toward the $3,572.334 level (marked as "Main Sweep") is highly possible. This could be a classic move to grab stop-losses from early buyers before a bullish reversal.
🔸 There is also a Fair Value Gap (FVG) between $3,576 – $3,586, which may act as a magnet for price and a potential demand zone 📉📥.
Two bullish scenarios are likely:
1️⃣ A retest of the FVG or sweep of $3,572, followed by a bounce back up toward resistance.
2️⃣ A direct breakout above the resistance zone, confirming bullish strength and targeting higher highs 📈🚀.
📌 Summary:
Watch for a possible fakeout or liquidity sweep into the FVG/Main Sweep zone. If price holds and shows bullish intent, gold could rally toward or above the $3,600+ level. Patience and confirmation are key! 🔑📊

XAUUSD At Critical PRZ: Will Gold Reverse or Break to New Highs?Hello Traders And Investors
XAUUSD At Critical PRZ: Will Gold Reverse or Break to New Highs? 🔥”
The recent price action on Gold (XAUUSD) has reached a very critical level near $3,586 – $3,600, which aligns with a strong resistance zone. This area is marked as a Potential Reversal Zone (PRZ), where sellers may step back into the market.
🔍 Market Structure Breakdown:
Previous Liquidity Sweep
Price collected liquidity below the July lows before forming a Higher Low at the start of August.
This move gave the market strength to push higher, creating a clean bullish structure.
Strong Impulsive Rally
From mid-August onwards, gold showed a strong bullish impulse, breaking through minor resistance levels without much pullback.
However, such parabolic moves often lack sustainability, making them vulnerable to a healthy correction.
Resistance & PRZ Reaction
The current resistance zone has historically acted as a strong rejection level.
Price tapping into this zone suggests exhaustion in bullish momentum, increasing the probability of a short-term pullback.
🎯 Target Zones for Downside Move:
1st Target: $3,480 – $3,500
This area coincides with a previous demand block and will act as the first reaction point.
Final Target: $3,330 – $3,320 (Key Support)
If bearish momentum sustains, price could revisit this major support, completing the correction phase before potentially resuming the broader uptrend.

XAUUSD Alert | Liquidity Grab or Trend Reversal?”XAUUSD Alert 🚨 | Liquidity Grab or Trend Reversal?”
Gold has recently pushed into the 3525 – 3550 rejection zone, a level that has historically acted as strong supply. After this extended bullish rally, price is now showing early signs of exhaustion. This could be a liquidity grab above resistance before the market corrects lower.
My expectation here is a short-term pullback. The first key area I’ll be watching is around 3450, which lines up with a smaller demand zone and could act as a temporary support. If buyers fail to defend that level, then I expect continuation toward the 3330 – 3320 zone, which is my final target and also a major higher-timeframe support point.
This level is very important because it was previously a strong base for accumulation, and if tested again, it could provide a potential long opportunity. However, if price breaks below 3320 decisively, it would open the door for a much deeper correction.
Overall, my short-term outlook is bearish retracement, but I’ll be closely watching how price reacts once we reach the deeper support levels.

Bearish Momentum for Bitcoin!Looking at the Daily Time-frame, we can see that the market structure has been broken. The high formed in the 14th of July, where liquidity was resting, was taken out and immediately price began its down-ward spiral! Within a period of 9 days, the low formed on the 2nd of August was taken out, qualifying that level as a breaker, but a more decisive move took place on the 25th.
Thus we can see, by the unwillingness of price to go above the breaker level, that the market is bearish! Right now, I am waiting for price to reach the 111,855 level to see how price will react.
All the best with your trading.

“Layers of Liquidity: The Hidden Brushstrokes in XAUUSD”“Layers of Liquidity: The Hidden Brushstrokes in XAUUSD”
When I observe this chart, it feels much like studying a Renaissance painting—full of depth, contrast, and hidden meaning. Every candle tells a story, just like brushstrokes on a canvas.
The strong support zone at 3260–3300 acts like the foundation of the painting, the solid base on which the entire composition stands. Just as an artist relies on balance in structure, the market relies on this level for equilibrium.
The resistance zone near 3440–3460 resembles the sky in a painting—bright and tempting, yet out of reach for now. The fake breakout projected above this level can be compared to an illusion of light in art: it draws the eye upward, but the truth lies in the shadow beneath.
Every higher low crafted along the way mirrors the gradual layering technique used by master painters, building depth and strength in the image. It is not a random stroke—it’s deliberate, showing that buyers are stepping in consistently, giving the chart rhythm and structure.
The liquidity sweep resembles the hidden symbolism often placed in classical artworks. At first glance, it might look chaotic, but its purpose is intentional—to trap participants and prepare for the next phase of movement.
From an educational perspective, this chart demonstrates that markets, like art, are a mixture of illusion and reality. Breakouts may be false, supports may be tested, but the true skill lies in learning how to interpret these strokes. Just as art critics read the layers of paint, traders must read the layers of price action.

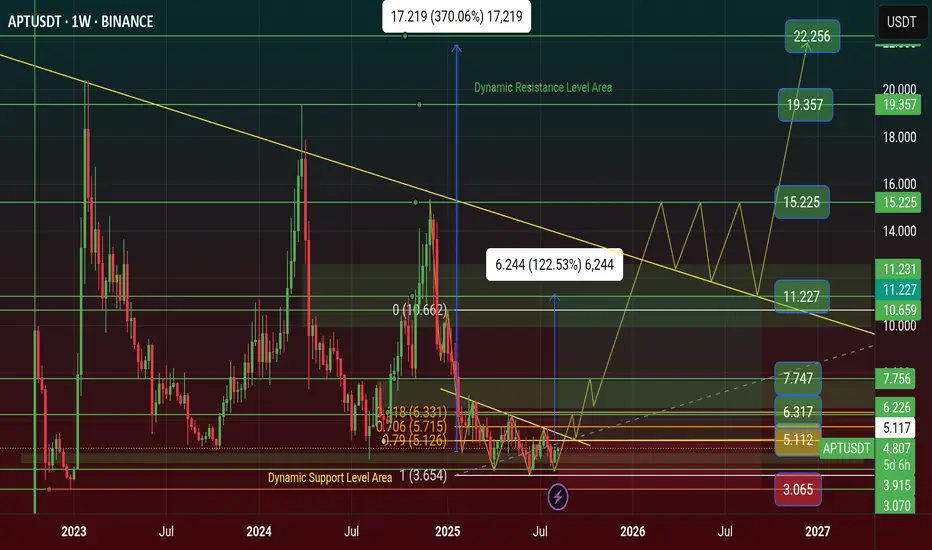
$APT Price Prediction will be reach $22 this Year 2025APT price is Showing Triple Bottom Pattern on Chart. it's a Reversal Pattern for APT price Manipulation. Time for Bull Run on APT and 12 aug unlocked 11.31M APT token and 2.20% of released supply $51.35M Dollar.
APT Price now Bottom area of Major Support Level area. At first the price will Hit $7 and if it's touch $11 price and if it's Breakout this Resistance it will be happened APT $22 Price.
🚦Aptos (APT) - 11.31M Token Unlocked worth of $51.35M - 12 Aug 2025
On 12 August 2025, Aptos will unlock 11.31 million new tokens. This event adds more APT tokens into the market supply at one time. Many traders watch token unlocks because more supply can bring price down if holders decide to sell quickly. Also, if most tokens go to teams or early backers, there might be more selling.
However, if unlocks are well planned and market demand is high, the price may not fall much. This event could be a catalyst for price change based on how the market reacts.
🚦 Aptos’ DEX trading volume reached $9 billion in the first half of the year, and the market value of stablecoins increased to $1.2 billion
PANews reported on August 12th that a Messari report showed that Aptos made significant progress in on-chain performance, DeFi ecosystem, and technological innovation in the first half of 2025. Transaction fees dropped to $0.00052, DEX trading volume reached $9 billion, and the stablecoin market capitalization increased to $1.2 billion.
On the technical side, projects such as Shelby and Decibel were launched to improve network performance. The Aptos Foundation invested $200 million to promote ecosystem development and consolidate its position as a global transaction engine.
🚦 UPCOMING EVENTS APT 11 SEPTEMBER
Total 11.31M APT Token Unlock worth of $54.51M and 2.15% of released supply
#Write2Earn #BinanceSquareFamily #BinanceAlphaAlert #APT #SUBROOFFICIAL
Disclaimer: This article is for informational purposes only and does not constitute financial advice. Always conduct your own research before making any investment decisions. Digital asset prices are subject to high market risk and price volatility. The value of your investment may go down or up, and you may not get back the amount invested. You are solely responsible for your investment decisions and Binance is not available for any losses you may incur. Past performance is not a reliable predictor of future performance. You should only invest in products you are familiar with and where you understand the risks.
EUR/USD at Critical Buying Zone | Liquidity Grab Before 1.1800?EUR/USD at Critical Buying Zone ⚡ | Liquidity Grab Before 1.1800?
Market Structure
BOS (Break of Structure):
Around late June, price broke to the upside, confirming bullish order flow.
In early August, another BOS occurred to the downside, showing a short-term bearish shift.
Current price action is consolidating within a range between 1.1600 – 1.1700, with liquidity resting on both sides.
Key Zones
Support Zone: 1.1350 – 1.1450
Strong demand area that previously initiated a bullish rally.
Buying Zone (1.1600 region):
Price is currently testing this level. Historically, this zone acted as a re-accumulation base before pushing higher.
Resistance Zone: 1.1750 – 1.1850
A supply area where sellers previously took control.
Liquidity & Fair Value Gap
FVG (Fair Value Gap): identified below resistance; this is an imbalance zone where price could revisit before any major continuation.
Liquidity (“$$$”): resting above the short-term highs near 1.1720; market may grab these buy-side stops before reversing lower.
Scenario Outlook
Bullish Case:
If price holds the Buying Zone (1.1600 support), expect liquidity sweep above 1.1720 and a push toward 1.1800–1.1850 resistance.
Bearish Case:
Failure to defend 1.1600 could trigger a deeper decline back toward 1.1400 support zone.
Bias
Currently, the chart suggests a liquidity grab and bullish continuation scenario. The drawn projection hints at a short-term sweep of lows (below 1.1600) followed by a strong rally toward resistance at 1.1800.

Link shows clear bearish divergenceIf we look closely at LINK/USDT right now, the charts are flashing a clear bearish divergence. This setup usually acts as a warning sign, and the price action is already hinting at a potential correction. The first important zone to watch is around 19.5 – it lines up with the golden pocket as well as a previous resistance that can now flip into support.
But if Bitcoin dominance continues climbing, there’s a risk of LINK moving deeper into correction territory. In that case, the 17.5 zone becomes a realistic target, and a move into that range would confirm a stronger bearish dump.
So the play here is simple: keep an eye on 19.5 as the first defense zone. If it holds, bulls might get some relief. If it breaks, prepare for the possibility of LINK sliding down toward 17.5.
