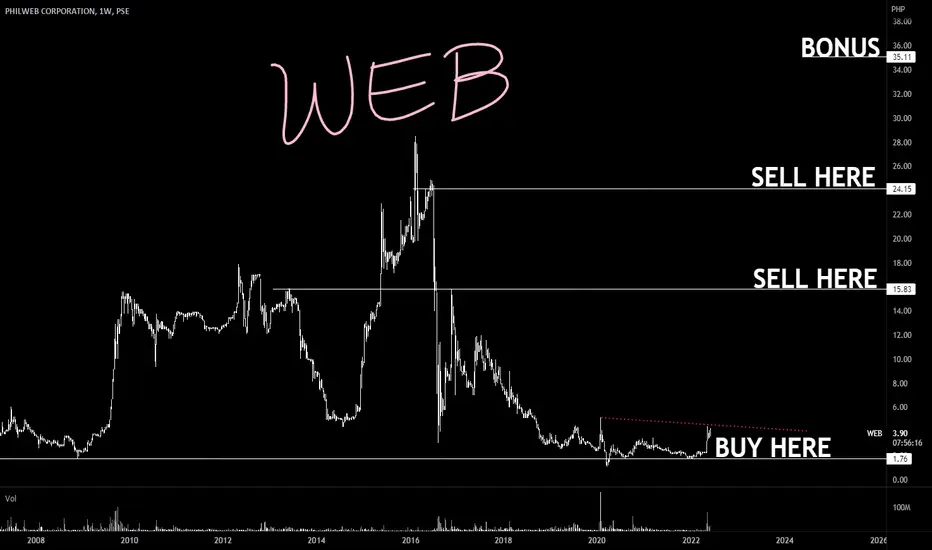
WEB: ₱P3.90 | a Future Unicorn in the Gaming Scene 20x++same handler of iSM a telco backdoored issue acquired by DAU (Dennis Ang Uy) ₱1.0 --> ₱20.0
WEB a favorite bread and butter of Balesin folks (owner of iSM Balesin) turned over to Araneta Group
for a 100 day recovery to fresh highs
entry: spot +- 25%
exit: when youre happy
Gaming
ALTURA longAltura - very promising low cap gaming infrastructure coin.
Weekly RSI at the bottom.
I think we have seen the bottom of Altura and from now it's just long steady walk into the bull market.
A daily close in the yellow box, above 0.0333, could be a good entry point for a long trade.
But I think the best play right now is just DCA, and wait - sooner or later will the gaming narrative run, and Altura will probably "explode" - non financial advice.

CAPCOM | Sreet Fighter6 & ATH 🔥Capcom stock prices have hit All Time High ahead of the launch for Street Fighter 6, following positive buzz around the anticipated title. looking at a chart, it’s easy to see what normally influences trends many previous spikes in share prices correlate around major Capcom releases, such as a March spike just two weeks before the release of Resident Evil 4 remake
It’s not just actual game releases that can have an affect on share prices a spike in November isn’t correlated with any major releases, though it does follow reports of Capcom making a mobile spinoff of Monster Hunter, as well as news about a potential release date for Street Fighter 6.
This week’s spike also follows a very optimistic forecast on Capcom’s investor relations page, which also predicts 140 billion yen in sales in the next fiscal year (April 2023 to March 2024).
It’s no surprise that Street Fighter 6 would have so much control over Capcom’s financial value- Street Fighter V is their 9th highest-selling title, with over 7 million units shipped. Combined with the announcement of a 2 million dollar prize pool for next year’s Capcom Pro Tour series and positive critical reception, it’s easy to be optimistic that Street Fighter 6’s launch will be huge for the company.
In its end-year financial results published on Wednesday, which cover the year ended March 31, 2023, the Resident Evil publisher said it had sold 41.7 million games during the 12-month period.
That’s up from 32.6 million games the previous fiscal year and breaks its record for the most games sold in a business year. The company said its game sales helped it achieve a sixth consecutive year of record-high profit “at all levels” and its tenth consecutive year of operating income growth.
The company achieved the record sales figure partly with the release of two new titles in its flagship series, Resident Evil 4 (which released a week before the end of the reporting period in March 2023) and Monster Hunter Rise: Sunbreak, which sold around 3.75 million and 5.45 million units.
The vast majority of its sales came from catalog titles, which Capcom defines as games released in the previous fiscal year or earlier.these sales, which it says were mostly made up of titles in the Monster Hunter, Resident Evil and Devil May Cry series, reached 29.3 million units – exceeding the 24 million units in the previous fiscal year.Capcom said 12.4 million in sales was made up of new titles. The company released 35 ‘new’ SKUs in FY23, including Mega Man: Battle Network Legacy Collection, Resident Evil Village: Gold Edition, Monster Hunter Rise Deluxe Edition, Capcom Arcade 2nd Stadium and Capcom Fighting Collection.
89.4% of its game sales during the 12 months were digital (37.3 million) and 19.7% were sold in its native Japan (8.2 million). Other than MH Rise: Sunbreak and RE4, the company’s top-selling titles during the FY were Monster Hunter Rise (3.7m), Resident Evil 2 (2.25m) and Resident Evil 3 (1.95m).
Capcom said it expects to break records for sales and profit again in its current fiscal year, ending March 31, 2024, which includes the release of Street Fighter 6 in June and new IP Exoprimal in July.Capcom‘s president recently said the company aims to sell 10 million copies of Street Fighter 6, which would break the series record of 7 million met by Street Fighter V
what an easy trade and profit 🥂

Sand usdt new low Sandbox looks like is going to new lows for the year. The next support from here is 0.1700. The last time this support was tested was in June 2021. Same the bitcoin dominance continues a lot of alt coins will make new yearly lows.

Falling Wedge will be done?Weekly Chart
Sandbox BINANCE:SANDUSDT is creating Falling Wedge
Both trend lines acts support and resistance
Daily Chart
Sandbox is below the resistance line and moving to apex zone between support and resistance. Just a breakout will create a massive move and chance to Long/Short depends on market that time.
If price goes up, it can break falling wedge and open a new bull run and otherwise, price goes down lower
Wait and see what happen

💾 NVIDIA Corporation | To The Moon!Where we have this "V Shaped" pattern but we can also draw a Cup & Handle, try it on the weekly timeframe and you will see.
I did an analysis for NVIDIA 9-Dec-2022 and it is still valid, I guess I was early but trading wise, nothing happened other than waiting.
Here is the chart:
As the previous analysis is still valid my view stays the same... NVDA to the Moon!
Namaste.

#BNX/BTC 1D (Binance) Falling wedge breakoutBinary X is about to regain 50MA and seems ready to leg up towards 100EMA resistance.
⚡️⚡️ #BNX/BTC ⚡️⚡️
Exchanges: Binance
Signal Type: Regular (Long)
Amount: 4.9%
Current Price:
0.00000856
Entry Targets:
1) 0.00000853
Take-Profit Targets:
1) 0.00001290
Stop Targets:
1) 0.00000678
Published By: @Zblaba
$BNX #BNXBTC #BinaryX #BSC #P2E
Risk/Reward= 1:2.5
Expected Profit= +51.2%
Possible Loss= -20.5%
Estimated Gaintime= 1 month
www.binaryx.pro

#CHR/USDT 12h (ByBit) Descending wedge on supportChromia just printed a dragonfly doji, bullish reversal towards 100EMA resistance seems around the corner.
⚡️⚡️ #CHR/USDT ⚡️⚡️
Exchanges: ByBit USDT
Signal Type: Regular (Long)
Leverage: Isolated (5.0X)
Amount: 4.6%
Current Price:
1) 0.1046
Entry Targets:
1) 0.1035
Take-Profit Targets:
1) 0.1215
Stop Targets:
1) 0.0945
Published By: @Zblaba
TSX:CHR #CHRUSDT #Chromia #NFT #DeFi
Risk/Reward= 1:2
Expected Profit= +87.0%
Possible Loss= -43.5%
Estimated Gaintime= 3 weeks
chromia.com

#APE/USDT 1D (ByBit) Small falling wedge near breakoutApeCoin just printed a morning star, reversal towards 100EMA seems around the corner, at least short-term.
⚡️⚡️ #APE/USDT ⚡️⚡️
Exchanges: ByBit USDT
Signal Type: Regular (Long)
Leverage: Isolated (2.6X)
Amount: 5.1%
Current Price:
1.888
Entry Targets:
1) 1.885
Take-Profit Targets:
1) 2.458
Stop Targets:
1) 1.598
Published By: @Zblaba
NYSE:APE #APEUSDT #ApeCoin #NFT
Risk/Reward= 1:2
Expected Profit= +79%
Possible Loss= -39.6%
Estimated Gaintime= 4-6 weeks
apecoin.com

PYR USDTBig weekly lower level been retested multiple times, forming a rounded bottom on weekly. Little retrace to the 4h support which is also in the poc zone of that left area.
Stops below that left OB. First tp around 5. Still first level to break. Then its 7.

$CING - LOW FLOAT + CAP - 1 Pill for ADHD/ANXIETY (ROCKETSHIP?)They announced positive top line results from their P3 trial. Adolescent and paediatric trials are happening both this month and next. Major competitors such as NYSE:JNJ , NYSE:PFE , NYSE:NVS that require multiple pills a day for the same effect. Extremely large TAM. Buyout candidate? We have popped off of the bottom channel and are looking for 1.10. A breakout above that sends it to 1.40-1.50 range. This is my own opinion and shouldn't be taken as financial advice. Own your trades.

RBLX Inverse Head & ShouldersRoblox has seen a move higher with gaming-related stocks this week on the heels of creating an inverted head and shoulders pattern. Price is trending above all MAs(8,21,34,50,100,200) wiht the short MAs rising and crossing above the long MAs indicating a short-term bullish trend.
The PPO indicator shows the green PPO line rising and above a rising purple signal line indicating short-term bullish momentum. Both lines above the 0 level and rising indicates intermediate to long-term bullish momentum.
The TDI indicator shows the green RSI line rising and crossing above the 60 level which indicates a short-term bullish trend behind price, as does the RSI line trending above the purple signal line and trending in the upper half of the Bollinger Bands. The RSI line trending between 40-60 levels indicates an intermediate to long-term bullish trend behind price.
Assuming that price continues to move higher and closes above the neckline in the $48 area, a measured move will put our price target at $69. Measurement is taken from the lowest point of the head to the neckline which is roughly $21. Add that to anticipated opening price around the $48 above the neckline and we get $69 as our target and take profit level.
Buy price for me was at $43.34.
Stop-Loss is currently at $37.05.
I tend to wait for a close above the neckline before entering a trade, this trade was initiated a little early and prior to pattern confirmation making it a little more risky. Stop-Loss orders help to reduce risk, and on any single trade my total risk can never be more than 1% of my total portfolio; if I lose on a trade, the dollar loss can never be more than 1% of my total portfolio value.

Electronic Arts: Take the Plunge! 💪As it has finished wave (B) in red, Electronic Arts should take the plunge and jump below the support at $108.53 to dive into the green zone between $119.33 and $113.17. There, the share should complete wave (C) in red as well as wave 2 in green before turning upwards again. However, Electronic Arts might also decide to develop a new top of wave alt.1 in green above the resistance at $132.87 first. We rate this alternative route with a probability of 37%.

#AGLD/USDT 4h (Bybit) Broadening channel on resistanceAdventure Gold (a.k.a. Loot) printed a shooting star and seems likely to retrace down to 100EMA support.
⚡️⚡️ #AGLD/USDT ⚡️⚡️
Exchanges: ByBit USDT
Signal Type: Regular (Short)
Leverage: Isolated (5.2X)
Amount: 5.0%
Current Price:
0.5250
Entry Targets:
1) 0.5483
Take-Profit Targets:
1) 0.4645
Stop Targets:
1) 0.5903
Published By: @Zblaba
TSXV:AGLD #AGLDUSDT #AdventureGold #Loot #NFT
Risk/Reward= 1:2
Expected Profit= +79.5%
Possible Loss= -39.8%
Estimated Gaintime= 1-2 weeks
www.lootproject.com

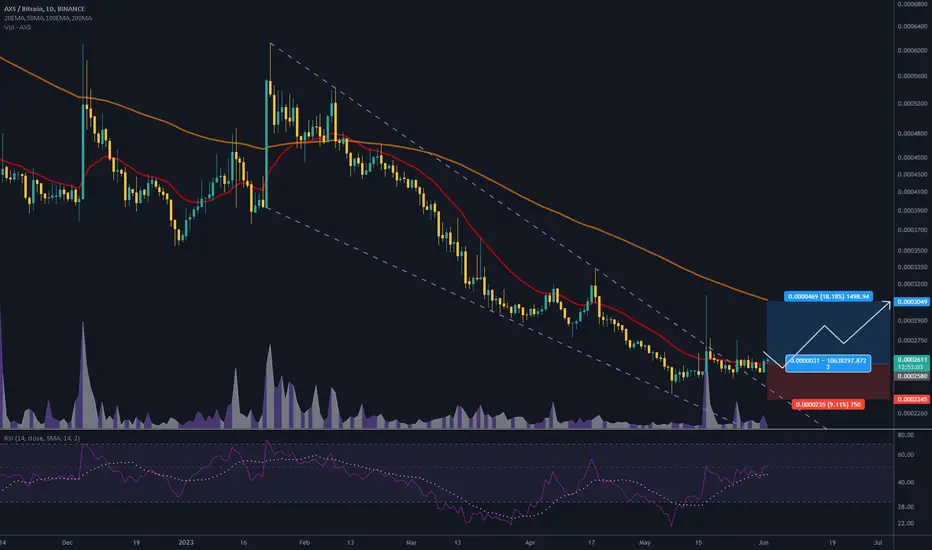
#AXS/BTC 1D (#Binance) Falling wedge breakoutAxie Infinity just regained 20EMA support in satoshi, looks ready for a small recovery towards 100EMA.
⚡️⚡️ #AXS/BTC ⚡️⚡️
Exchanges: Binance
Signal Type: Regular (Long)
Amount: 11.0%
Current Price:
0.0002580
Entry Targets:
1) 0.0002611
Take-Profit Targets:
1) 0.0003049
Stop Targets:
1) 0.0002345
Published By: @Zblaba
NYSE:AXS #AXSBTC #AxieInfinity #P2E #NTF #Ronin axieinfinity.com
Risk/Reward= 1:2
Expected Profit= +18.2%
Possible Loss= -9.1%
SpaceFalcon FCON SpaceFalcon FCON coin indicators are on point for gains - RSI just over 50 rising - MACD bullish - Volume is also good so lets see the gaming coin make some gains :)

Space Falcon $FCON went berserk :) This coin has taken off today 24 hr volume up 2082% and its price keeps rising so I couldn't help but put in a little and if it continues this bullish path great! If not then not that big of a loss ... MACD crossed signal line on daily chart looks good lets see how this plays out :) Trading above Moving Average as well.
About:
Falcon Mission Space Falcon has recreated the classic space shooter game in 3D to run in browser that incentives players by integrating blockchain reward system - Intergalactic #SOLANA metaverse featuring the classic space shooter game and premium Sci-Fi NFTs from cosmos and beyond.

Zill bullish web3 gamingzill has released the first web3 gaming console and has had bullish price action ever since as far as targets..... im watching for now any input on this or links to ideas appreciated ......

Gaming We have a great support.
UOS throwback on support.
App go out after tomorrow.
Maybe nice to get somes pieces of UOS.

GAMiUM: $0.005 | The Next Sandbox first of its kind with decent tokenomics where everyone gets a fair allocation
lock up is 3 months and 12 months
dressing up in play for Metaverse Theme . and June September Crypto Summits
could be mis priced or under valued intentionally just like GMT stepn
and we await listing in Binance and Coinbase for that massive adopotion
for now... only few are invested
soon they will come
many
and desperate to FOMO at Insande Levels with Volune
gamium.world

#DBI a thing of BEAUTYDegens will will this next cycle
Ride this with me
I'm going to keep posting on this incredible #crypto
#NFT's covered
#Ordinals covered
Exhibition of cult behaviour check
#LINK usage for fair gaming check
Front guy getting viral absolutely!
these are the parameters you need to win big and it's only just getting started

$APE/USDT 12h (#Bybit) Descending trendline breakout and retestApeCoin just regained 50MA support and seems to be heading towards 200MA resistance, probably after a last retest of demand zone.
⚡️⚡️ #APE/USDT ⚡️⚡️
Exchanges: Binance Futures, ByBit USDT
Signal Type: Regular (Long)
Leverage: Isolated (4.2X)
Amount: 5.0%
Current Price:
4.314
Entry Zone:
4.235 - 4.065
Take-Profit Targets:
1) 4.624
2) 4.980
3) 5.337
Stop Targets:
1) 3.754
Published By: @Zblaba
$APE #APEUSDT #ApeCoin #Web3 #NFT #DAO
Risk/Reward= 1:1.2 | 1:2.1 | 1:3.0
Expected Profit= +48.0% | +84.0% | +120.1%
Possible Loss= -40.1%
Estimated Gaintime= 3-4 weeks
apecoin.com

EA - UPDATE/ TARGET REACHEDHi guys, updating my TA Electronic Arts Series. I've followed EA since the $108 - 112 range, as i noticed it to be a solid swing opportunity. I will be exiting MAJORITY of my positions on this trade, as it exceeded my expectations.
This analysis is done on the DAILY timeframe.
PRICE ACTION:
As you can see we have filled most of the gap i mentioned in my previous charts. WE are now nearing the top of this down sloping Resistance Line (red line) that has been intact since June 2022.
In my opinion, this will act as resistance and be a major test area.
Price action has also exceeded my expectations as we have currently broke above this trend line titled in yellow that should of acted as resistance. So im being cautious here, as this could either be a downtrend fake out or our current price move up can also be a fakeout especially on higher timeframes perhaps.
I would also pay attention to the size of the upcoming candles especially today and tomorrow. If they small sized bodies, that could be an indicator of a short term trend change to downside.
My target for this move is between $126 and $130. $130 being less likely. A more likely scenario can also be the top of the green box at around $128.
There is always opportunities to trade, so in my opinion this area is good enough for me to sell.
Just hypothetically also, some potential setups in the future for EA could be:
1. If we break the red trend line and confirm above it and have it act as support. ( which is currently less likely in the short term)
2. If price comes back down to test some of the lines drawn below price action. ( maybe more probable)
ALso note that the recent price drop from $129 to $108, people would have centive to sell to cut losses and take profits now if you think in a psycology point of view.
INDICATORS:
All indicators shown are at overbought levels and showing such patterns.
RSI
Is at overbought levels not seen since December 2020. I always base my decisions to sell on this indicator. If i see it above the 70 level, my sell mode mind turns on and i get ready.
STOCH RSI
This indicator also is at overbought area which is indicated by being bove the dashed line or the 80 level. How i use this indicator is i look for a BEARISH cross, which is when its pointed down and the orange line is on top of the blue. Also when it moves below the 80 level, that confirms for me that the momentum is becoming bearish.
WAVETREND OSCILLATOR
The green line has crossed above the red lines indicating overbought area which supports the other 2 indicators, making me think about potentially shorting.
CONCLUSION:
For the short term i beleive we are reaching a critical area, where potentially would be a solid area to TAKE PROFITS in my opinion. Price action is reaching strong resistance and is close to filling a gap. Indicators are in overbought areas which further supports the probabilty of a short term pull back.
Ultimately, we also need to pay attention to the larger timeframes and the bigger picture to see if its possible for EA to break above this downward trend to continue its bullish-nessor if its a fakeout. Stay tuned for that analysis.
HOPE THIS HELPED> Please boost, follow and comment. Let me know if you agree or disagree and why you do so!
DISCLAIMER: The ideas expressed in this analysis are by no means financial advise. I am not a financial adviser. It is just my opinion and for educational purpose.
