EURUSD FRGNT Daily Forecast - Q4 | W48| D24 | Y25 |📅 Q4 | W48| D24 | Y25 |
📊 EURUSD FRGNT Daily Forecast
🔍 Analysis Approach:
I’m applying Smart Money Concepts, focusing on:
Identifying Points of Interest on the Higher Time Frames (HTFs) 🕰️
Using those POIs to define a clear trading range 📐
Refining those zones on Lower Time Frames (LTFs) 🔎
Waiting for a Break of Structure (BoS) for confirmation ✅
This method allows me to stay precise, disciplined, and aligned with the market narrative, rather than chasing price.
💡 My Motto:
"Capital management, discipline, and consistency in your trading edge."
A positive risk-to-reward ratio, paired with a high win rate, is the backbone of any solid trading plan 📈🔐
⚠️ Losses?
They’re part of the mathematical game of trading 🎲
They don’t define you — they’re necessary, they happen, and we move forward 📊➡️
🙏 I appreciate you taking the time to review my Daily Forecast.
Stay sharp, stay consistent, and protect your capital
— FRNGT 🚀
FX:EURUSD
Gann

AUDUSD FRGNT Daily Forecast -Q4 | W48| D24 | Y25 |📅 Q4 | W48| D24 | Y25 |
📊 AUDUSD FRGNT Daily Forecast
🔍 Analysis Approach:
I’m applying Smart Money Concepts, focusing on:
Identifying Points of Interest on the Higher Time Frames (HTFs) 🕰️
Using those POIs to define a clear trading range 📐
Refining those zones on Lower Time Frames (LTFs) 🔎
Waiting for a Break of Structure (BoS) for confirmation ✅
This method allows me to stay precise, disciplined, and aligned with the market narrative, rather than chasing price.
💡 My Motto:
"Capital management, discipline, and consistency in your trading edge."
A positive risk-to-reward ratio, paired with a high win rate, is the backbone of any solid trading plan 📈🔐
⚠️ Losses?
They’re part of the mathematical game of trading 🎲
They don’t define you — they’re necessary, they happen, and we move forward 📊➡️
🙏 I appreciate you taking the time to review my Daily Forecast.
Stay sharp, stay consistent, and protect your capital
— FRNGT 🚀
OANDA:AUDUSD

How to trade in a range-bound market?Gold remains in a wide-range trading pattern, with the daily chart closing with another doji candlestick. This pattern suggests continued range-bound trading. Today's strategy is to buy low and sell high, as there is still room and demand for further declines. The key resistance level to watch today is around $4098; sell on rallies near this level.
Gold maintains its wide-range trading structure. The daily/weekly charts show a tug-of-war between bulls and bears, with moving averages converging and the price hovering around the middle Bollinger Band. Gold will soon face a directional decision. From a technical perspective, after rebounding to the $4110 high and encountering resistance, gold has fallen again in a stepped pattern, and this area remains a significant resistance zone.
Key Levels:
First Support: 4040, Second Support: 4023, Third Support: 4004
First Resistance: 4090, Second Resistance: 4108, Third Resistance: 4130
Gold Intraday Trading Strategy:
BUY: 4026-4031, SL: 4010, TP: 4050-4060;
SELL: 4095-4100, SL: 4115, TP: 4080-4070;
More Analysis →
Gold Teprature is almost 1064 Digrees 23 Nov 2025Gold Teprature is almost 1064 Digrees 23 Nov 2025
Hemmm
The Last week of november,
nov,dec will be voltile market , yearly Closing.
Struggling Struggling Struggling
Fight bitween bullish fvg day and th ebearish fvg that is most recent,
i will go with the most recent fvg,
the respected candle farmed inside Bearish FVG,
nearest target is is previus Swing low,
Previus Week Close Below Equalibrium.
potancial targets is PWL. Weekly Swing Low, and more.
Probalities,
allah o aalam

LongAccording to the analysis of the waves and the help of the Gann method, it can be expected that the price will return to the green zone again.
This is my personal opinion. Please don't use it as your trading criteria. Good luck

LongAccording to the analysis of the waves and the help of the Gann method, it can be expected that the price will return to the green zone again.
This is my personal opinion. Please don't use it as your trading criteria. Good luck

LongAccording to the analysis of the waves and the help of the Gann method, it can be expected that the price will return to the green zone again.
This is my personal opinion. Please don't use it as your trading criteria. Good luck

METAL INDEX Shows signs of some more Glittering for the year endNSE:CNXMETAL Shows three swings structure, and currently correcting the wave 3 and as far as it could stay within wave 4 range, we could see on more push higher to complete 5 swings. It has already reached the minium and few stocks like TATASTEEL, JSWSTEEL are reacting higher. We are buying at this level to see if we could see one more push higher to complete the 5 swings.

#btc 7 % to 10 % target #shorterm may I right #Trading Guru's ?In the #longterm, I am #buying #btc on every dip
However, now the #Bitcoin is in #downtrend and capturing the reversal market opportunity.
Experts in #stock #future #option #forex and #crypto Guru can give your commands, is the level I draw is right #startgey to earn 7% to 10% in this #trade.#BTC #forex #supportortandresistance #tradinging #swingtradingstrategies #buy #sell #EURUSD #Gold #niftyy #s&p500 #etf #QQQ #IWM #future #options #longterm #XAUUSD #silver #USDCAD #BTCUSD
#BTC #forex #supportortandresistance #tradinging #swingtradingstrategies #buy #sellll #EURUSD #goldd #niftyy #s&p #etf #qqq #iwm #future #options #longterm #btc #forex #etf #option #money #earning #dollars #bitcoin,#btc,#spy,#forex,#bitcoin,#supportlevel,#RESISTANCELEVEL,#TESLA,#S&P500,#NVDIA,#APPLE,#AMAZON,#NIFTY,#META,#RSI,#STOCKMARKET,#SHAREMARKET,#GOLD,#OIL,#SILVER,#INTRADAY,#SWINGTRADE,#LONGTERM,#INVESTMENT,#SELL,#BUY,#BID,#ASK,#MARKET,#INVESTORS,#IWM,#OPTION,#FUTURES,#US,#ALIBABA,#CASH,#CASHFLOW
What is your recommendation?
Best time to buy #Bitcoin at 125k or 95k with a 35% discount?
I am planning to get a 35% return on # Bitcoin over the next 3 to 6 months.
A few weeks before #btc was more than 125k
If I could bout at that level, now I would lose more than 35% down on my #investment
Now the same # crypto currency #BTCUSD is trading at #discount price for 95k.
So I am entering at this #price range to get 15 to 35 return on my investment in the next 3 to 6 months.
In this investment, I am not using #StopLoss. This capital, which I am #investing I could wait until my return reaches more than 35%.
Even I can hold for 3 months to 3 years.
If the target takes 3yrs I still get a 35% return, that also more than 12% return per year and a profit than Index fund returns.
What is your recommendation?

May I right ? #btc 7 % to 10 % target expectation In the #longterm, I am #buying #btc on every dip
However, now the #biotcoin is in #downtrend and capturing the reversal market opportunity.
Experts in #stock #future #option #forex and #crypto Guru can give your commands, is the level I draw is right #startgey to earn 7% to 10% in this #trade.
#BTC #forex #supportortandresistance #tradinging #swingtradingstrategies #buy #sell #EURUSD #Gold #niftyy #s&p500 #etf #QQQ #IWM #future #options #longterm #XAUUSD #silver #USDCAD #BTCUSD
#BTC #forex #supportortandresistance #tradinging #swingtradingstrategies #buy #sellll #EURUSD #goldd #niftyy #s&p #etf #qqq #iwm #future #options #longterm #btc #forex #etf #option #money #earning #dollars #bitcoin,#btc,#spy,#forex,#bitcoin,#supportlevel,#RESISTANCELEVEL,#TESLA,#S&P500,#NVDIA,#APPLE,#AMAZON,#NIFTY,#META,#RSI,#STOCKMARKET,#SHAREMARKET,#GOLD,#OIL,#SILVER,#INTRADAY,#SWINGTRADE,#LONGTERM,#INVESTMENT,#SELL,#BUY,#BID,#ASK,#MARKET,#INVESTORS,#IWM,#OPTION,#FUTURES,#US,#ALIBABA,#CASH,#CASHFLOW
What is your recommendation?
Best time to buy #Bitcoin at 125k or 95k with a 35% discount?
I am planning to get a 35% return on # Bitcoin over the next 3 to 6 months.
A few weeks before #btc was more than 125k
If I could bout at that level, now I would lose more than 35% down on my #investment
Now the same # crypto currency #BTCUSD is trading at #discount price for 95k.
So I am entering at this #price range to get 15 to 35 return on my investment in the next 3 to 6 months.
In this investment, I am not using #StopLoss. This capital, which I am #investing I could wait until my return reaches more than 35%.
Even I can hold for 3 months to 3 years.
If the target takes 3yrs I still get a 35% return, that also more than 12% return per year and a profit than Index fund returns.
What is your recommendation?

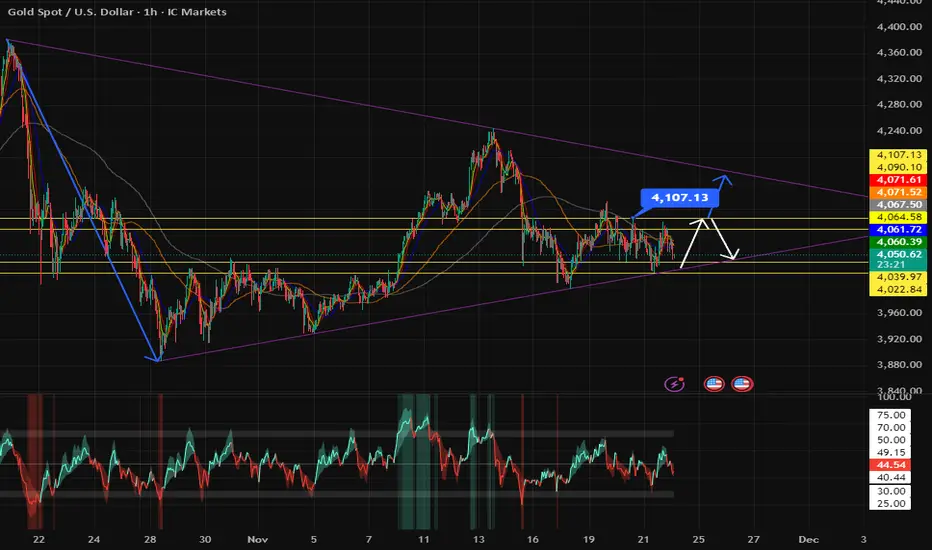
XAUUSD 1h chart levels for the coming week 24 to 28 November
FOREXCOM:XAUUSD
Hey Everyone,
Please see My updated 1h chart levels and targets for the coming week 24 to 28 November
The price closed on 4065 so If the price BREAKOUT UP this area for will open 4093.
The 4061 & 4067 reversal zone and key decision points; if breached, it becomes the path to 4125.
Weekly close at a 90-degree angle from the peak of 4036
If it breaks through with momentum, it will head towards 4004-3998 as it shown on the chart
The week should move like this
Monday should move to 135° degrees (down to 4036 or up to 4093)
Tuesday 150° degrees (if it moved down we will see 4006 & if up will see 4102) First move 150° and We will see rejection of a Strong price when the (moon & sun & Mercury meet I call it = Test Price Day)
Wednesday 160° degrees ((if it moved down we will see 4004 & if up will see 4125 and then 4157) If the price touches the 180-degree angle, it is heading towards a volatile day followed by a strong rise or fall.
Thursday 170° degrees (the price will move between 4125-4157) and if the price moved down wee will move 225° degrees between 4036-4006) A day approaching the peak or undermost, not a reversal day.
Yousif
H-k-O-r-E

#Bitcoin - Macro Pivot Point: $110185Date: 17-10-2025
#Bitcoin - Current Price: $105075
Pivot Point: $110185.27
Support: $102617.85
Resistance: $117,823.20
Upside Targets:
--------------------------------
| Target | Price |
---------------------------------
| 🎯 Target 1 | $128,107.72 |
| 🎯 Target 2 | $138,392.25 |
| 🎯 Target 3 | $148,969.86 |
| 🎯 Target 4 | $159,547.48 |
Downside Targets:
| 🎯 Target 1 | $92,298.07 |
| 🎯 Target 2 | $81,978.29 |
| 🎯 Target 3 | $71,400.67 |
| 🎯 Target 4 | $60,823.05 |
#Crypto #Bitcoin #BTC #CryptoTA #TradingView #PivotPoints #SupportResistance

#AGLD/USDT Alert! Imminent Rise#AGLD
The price is moving within a descending channel on the 1-hour frame, adhering well to it, and is heading for a strong breakout and retest.
We have a bearish trend on the RSI indicator that is about to be broken and retested, which supports the upward breakout.
There is a major support area in green at 0.662, which represents a strong support point.
For inquiries, please leave a comment.
We are in a consolidation trend above the 100 moving average.
Entry price: 0.675
First target: 0.686
Second target: 0.704
Third target: 0.723
Don't forget a simple matter: capital management.
When you reach the first target, save some money and then change your stop-loss order to an entry order.
For inquiries, please leave a comment.
Thank you.

bitcoinbottom at 74k? bearish market?
i think, that we are in the corrective wave 4 right now and still can reach the prices of around 74K in bitcoin.

Two scenarios for Bitcoin's pathTwo scenarios for Bitcoin's path from October 2025 to October 2026: Growth to 118,000 and then a drop to 63-64,000 or growth to 236,000 and then a drop to 52,000. I currently give less weight to the second scenario. But the time frame in both scenarios is the same.

#Bitcoin 56% return in 90 days Am I on the Right track with my #bitcoin asset creation?
I have been entering into #crypto for the past few weeks and going for #long in #btc
In the past 45 days, the # cryptocurrency market has dropped to around 36% from the recent #btc new high level. I was holding my hand at the market's high price and waiting for the discount price.
That is the reason I am buying the crypto on each dip
From this #price if the #btcusd starts to move and my prediction is right, then I could get 56% return on in the next 90 days.
Any trade money management is a tool to help you grow your portfolio.
Simple trading strategy support & resistance
All trading methods will give only 49% or 51% - #moneyManagement is the key
Your money management only decides your profit
#BTC #forex #supportortandresistance #tradinging #swingtradingstrategies #buy #sell #EURUSD #Gold #niftyy #s&p500 #etf #QQQ #IWM #future #options #longterm #XAUUSD #silver #USDCAD #BTCUSD
#BTC #forex #supportortandresistance #tradinging #swingtradingstrategies #buy #sellll #EURUSD #goldd #niftyy #s&p #etf #qqq #iwm #future #options #longterm #btc #forex #etf #option #money #earning #dollars #bitcoin,#btc,#spy,#forex,#bitcoin,#supportlevel,#RESISTANCELEVEL,#TESLA,#S&P500,#NVDIA,#APPLE,#AMAZON,#NIFTY,#META,#RSI,#STOCKMARKET,#SHAREMARKET,#GOLD,#OIL,#SILVER,#INTRADAY,#SWINGTRADE,#LONGTERM,#INVESTMENT,#SELL,#BUY,#BID,#ASK,#MARKET,#INVESTORS,#IWM,#OPTION,#FUTURES,#US,#ALIBABA,#CASH,#CASHFLOW

Bitcoin at Its Final Stand: 8/1 Angle Decides $135K or $58K!The 8/1 angle at $80,620 is Bitcoin’s final line of defence.
If this level breaks: a decline towards $58,000 becomes highly probable.
If it holds: there remains a genuine chance for a strong rebound, potentially leading to a new all-time high with upside targets around $135,000.
Time Analysis:
Our cycle work indicates that a meaningful bottom is likely to form between 21st and 25th November 2025, supported by a confluence of Mars–Jupiter timing signatures.
On 22nd November, the Sun enters Sagittarius (3:37 PM UT) while Mercury Retrograde trines Jupiter Retrograde, a critical turning point window historically associated with heightened volatility and major shifts in trend.
Bitcoin is now approaching a highly significant temporal juncture, and the market will soon reveal which path it chooses. As always, be prepared for both scenarios, flexibility is key.
We will continue to keep you all updated.

Gelaxy IG 2025: Crypto Visa Card + One-Click TokenizationNovember 2025 has proven that cryptocurrency is no longer just “digital gold” for HODLers.
While Bitcoin was dropping below $96,000, stablecoins USDT and USDC grew 11 % in issuance volume in just 30 days, and tokenized real-world assets (RWA) attracted a record $640 million in October–November alone.
This is not a coincidence. It’s a signal: crypto is finally becoming real working capital.
Gelaxy IG is launching the solution that makes your crypto truly alive:
Spend BTC, ETH, USDT and 1,300+ other coins anywhere in the world with a regular Visa/Mastercard
Tokenize any investment position (Forex, stocks, bonds, ETFs) into an ERC-20 token and get instant liquidity without closing the underlying trade
What is Gelaxy IG and why we launched right now
Gelaxy IG is a next-generation fintech platform that connects three worlds:
Crypto wallet with direct Visa/Mastercard integration (130+ countries, 40+ million acceptance points)
Tokenization of any investment position into ERC-20
Instant liquidity without selling the base asset
Key figures as of 18 November 2025:
1,300+ supported assets for payments
User-tokenized position volume already at $180 million
Average time from “I need cash” to “money on card” — 42 seconds
Partnerships with 8 major card issuers and 4 blockchains (Ethereum, Polygon, Solana, Arbitrum)
How it works — two real November 2025 scenarios
Scenario 1. Paying for coffee in Paris with BTC — without selling
You have 0.42 BTC in your Gel − wallet.
Go to a café → tap your Gelaxy Visa card → pay €18.
The system automatically issues a collateralized loan against your BTC at 65 % LTV → money is debited → your BTC stays with you and keeps growing.
Scenario 2. Tokenization and instant liquidity on a Forex position
You have a $250,000 EUR/USD long with ×10 leverage, currently +$18,400 in profit.
Instead of closing, you hit “Tokenize” → the position becomes token gEURUSD-2511 → you sell 40 % of the tokens on the built-in DEX → receive $7,360 in USDT in 18 seconds, without closing the trade or triggering a tax event.
Why this became possible only in 2025
Regulators gave the green light (OCC USA, MiCA EU, Singapore, UAE) — stablecoins and tokenized assets are now treated as regular money
Institutions are already here: BlackRock BUIDL $640 m, Ondo $1.1 bn TVL
Retail is simply following
Gelaxy IG advantages
Spend crypto everywhere Visa/Mastercard is accepted — no sale, no tax event
Tokenize any position and get cash in seconds
Earn up to +15 % extra: staking rewards + 1–3 % cashback on every card purchase
Full compatibility with MetaMask, Ledger, Trust Wallet
0 % conversion fee inside the platform until 31 December 2025
Roadmap 2026
Q1 — tokenization of real stocks (Apple, Tesla, Nvidia)
Q2 — Apple Pay & Google Pay integration
Q3 — own gUSD stablecoin with 6–9 % APY
Get started now
Conclusion — why Gelaxy IG changes the game
2025 has finally erased the line between “crypto” and “real money”.
Gelaxy IG is not just another card and not just another wallet.
It’s a tool that turns your investment capital into real, spendable money — right here, right now — without selling, without waiting, without compromise.
While others wait for the “next bull run”, Gelaxy IG users are already living it:
paying with crypto for dinner
pulling profit from a Forex trade without closing it
earning cashback and staking rewards every single day
Gelaxy IG democratizes investing: anyone with $500 in crypto now has access to advantages that just a year ago were reserved for hedge funds and family offices.
Your crypto no longer has to sit idle.
It has to work — 24 hours a day, 7 days a week.
Gelaxy IG — your capital works while you live.


Bearish BiasI would say this week seems to be Abit shitty. But never the less we can always strangle the xauusd by buy and sell together and wait for the right zone. Just to play the big player out.

XAUUSD: Market Analysis and Strategy for November 21Gold Technical Analysis:
Daily Resistance: 4150, Support: 4000
4-Hour Resistance: 4110, Support: 4010
1-Hour Resistance: 4085, Support: 4020
Technically, the weekly chart is likely to close with a doji today. Yesterday's daily chart closed with a doji, indicating a slowdown in the short-term upward trend and exacerbating the expectation of sideways consolidation. The Bollinger Bands are also narrowing, and the effectiveness of the 4040 support level needs to be monitored today. Meanwhile, the 4000 level is being tested again. If 4020 is broken, a short-term sell signal can be adopted. If the price can hold above 4085, a buy signal can be adopted, with the 4140/4150 area to be watched again. Long-term holders can still look for buying opportunities around the 3930/3920 level;
Looking at the 1-hour chart, gold rebounded after the European session, but after breaking below 4080, there's a possibility of further downside in the short term. Watch for support around 4020;
For the European and American sessions, the plan is to consider buying if a stabilization signal appears around 4005/4000.
Trading Strategy:
SELL: 4078~4085.
BUY: 4005~4000.
More Analysis →
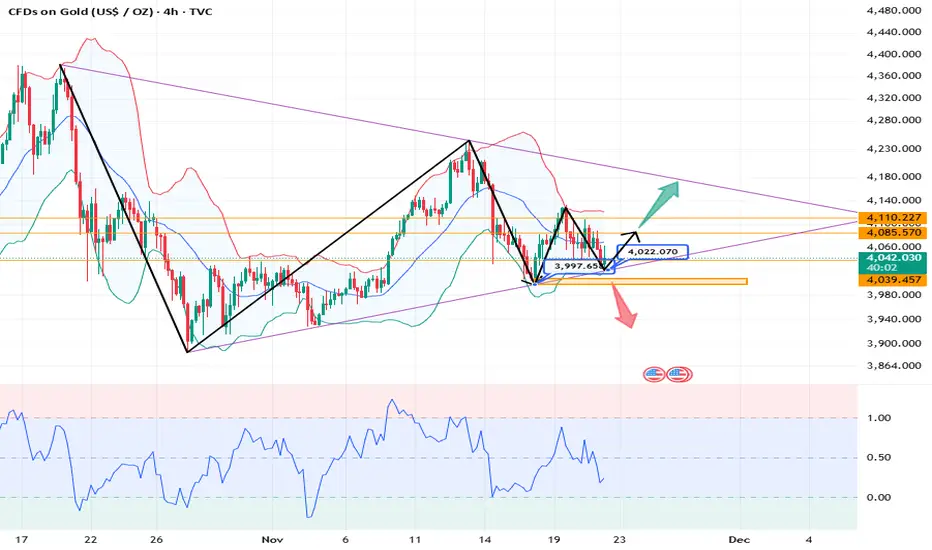
Symmetrical Triangle incoming Avoid trading during a symmetrical triangle formation
Market Indecision & Uncertainty: Symmetrical triangles represent periods where buying and selling pressures are almost equal, causing price to consolidate with lower highs and higher lows converging towards a point. There's no clear directional bias until a breakout occurs, making trade direction and timing highly uncertain during the formation phase.
Risk Management Challenges: Stop-loss placement inside the triangle is unreliable, as price often touches both trendlines without a breakout, increasing the probability of being stopped out repeatedly
