GBPUSD Sell Momentum | Gap Open + Order Block BreakGBPUSD H4 Bearish Since 05 January 2026, price has been moving inside a bearish channel CHOCH BOS confirmed, indicating a clear bearish shift Internal Order Block is in play and has been respected MACD supports the bearish momentum. The lower order block has been broken.
Targets downside liquidity.
Gap

FJET - Gaps, Demand & the Next Decision Point!📊Markets don’t move randomly... they react to unfinished business.
📈After the explosive post-listing move , Starfighters Space AMEX:FJET left a clear price gap above ($23 - $24 area), followed by a controlled pullback into a well-defined demand zone around the $8 – $9 area.
Since then, price has been compressing inside a descending channel, reflecting short-term bearish pressure rather than structural weakness.
What matters now is context 👇
This pullback is happening after an impulse.
📈 What's Next?
FJET is approaching the lower end of the falling channel while sitting on higher-timeframe demand.
This creates a classic decision zone:
– Hold demand → structure shifts bullish
– Lose demand → deeper correction before continuation
A critical factor will be how price reacts near the lower channel boundary. A reclaim of structure would open the door for a rotation higher, with the gap zone above acting as a price magnet. 🧲
A sustained break above the falling channel (marked in red) would signal a transition in momentum from bearish to bullish.📉📈
💡 Why This Matters
Gaps often act like unfinished chapters in the market. When structure stabilizes, price tends to revisit them, not because of hope, but because of order flow mechanics.
The plan is to wait for price confirmation and then follow the trend.
⚠️ Disclaimer: This is not financial advice. Always do your own research and speak with your financial advisor before investing.
📚 Stick to your trading plan regarding entries, risk, and management.
Good luck! 🍀
All Strategies Are Good; If Managed Properly!
~ Richard Nasr
Disclaimer: I have been paid $1,000 by CDMG, funded by Starfighters Space, to disseminate this message.

EUR/USD is positioned at the top of two long-term channelsAs you can see, EUR/USD OANDA:EURUSD is currently testing the upper boundary of two major channels on both the weekly and daily timeframes.
1) Daily Timeframe Analysis
On the daily chart, the dollar completed a five-wave impulsive move into the channel’s upper resistance.
After reaching this level, price has started a correction.
Wave A has already finished with a clear five-wave structure.
Price is now forming wave B.
Based on the current structure, wave B is likely to extend:
At minimum, into the Gap Zone, and
At maximum, into the Resistance Zone
(both areas are clearly marked on the daily chart).
From either of these areas, I expect the beginning of wave C, which will likely push the pair down toward the Support Zone.
2) Weekly Timeframe Confirmation
In the weekly chart (Chart B), EUR/USD has reached:
The top of its major ascending channel, and
The 100% extension of the previous leg.
This confluence significantly strengthens the bearish scenario.
3) Additional Charts Coming
I will also upload the hourly EUR/USD chart on my TradingView page to provide a clearer and more detailed outlook.
4) Follow for More Analysis
Feel free to follow me on TradingView to catch all my analyses and live stock trades.
I’d be happy to hear your thoughts and feedback.

From Neckline to Target: Setting H&S Bearish Entries and ExitsUnderstanding the Head & Shoulders Breakdown
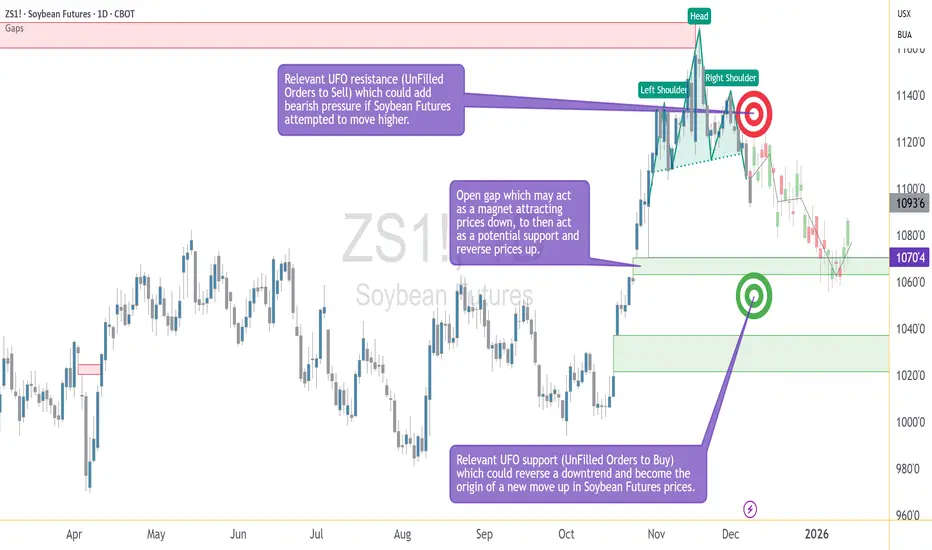
A bearish head and shoulders pattern gives traders a structured way to define entries and exits using price geometry rather than emotion. The pattern forms when a market transitions from strength to distribution, creating a left shoulder, a higher head, and then a lower right shoulder as momentum begins to fade. The neckline acts as the key support level that separates a developing pattern from a completed one.
In the case study illustrated on the chart, the daily timeframe shows a fully developed head and shoulders structure that confirmed during the December 5 trading session, when price closed below the neckline. This type of close is often interpreted by traders as evidence that bearish participation has taken control of the pattern. Whether a trader enters immediately or waits for a retest, the priority becomes identifying the levels that will structure the trade: the area of invalidation, the downside objective, and the points where risk must be controlled.
A confirmed neckline break does not imply certainty about future price direction. Instead, it provides an organized framework—a map traders can use to define where their idea is considered valid and where it is considered invalid. The educational value of this pattern lies not in its ability to predict, but in its ability to help traders pre-plan actions with clarity.
Structuring the Bearish Entry: Neckline Retests and Resistance Zones
One of the most common approaches to trading a bearish head and shoulders is to monitor for a modest bounce back toward the neckline after the breakdown. Retests do not always occur, but when they do, many traders see them as opportunities to enter with more control over the distance between entry and stop.
In this example, price sits beneath a well-defined UFO resistance area between 1123 and 1136. This band aligns with a cluster of unfilled sell orders, which may reinforce bearish pressure if price attempts to climb. More importantly, the upper boundary of the zone—1136—serves as an objective point of invalidation. If price were to move above that level, the logic of the completed bearish structure would no longer hold. Therefore, traders could use this upper boundary as a stop-loss level. It is neither arbitrary nor emotional; it is derived directly from the structure.
This type of predefined invalidation is essential because even the cleanest technical patterns can fail. The purpose of using a pattern is not to guarantee the outcome, but to know exactly when the trade thesis no longer makes sense. In this framework, the neckline provides context for the entry, while the resistance zone provides clarity for where the idea is wrong.
Defining the Target: Gap Alignment and Technical Confluence
After establishing where a trade becomes invalid, traders turn to the question of where it becomes complete. In pattern-based trading, target selection often blends classical measurement rules with the identification of technical areas where price has reason to react. In this case study, the downside objective centers on 1070'4, where two important elements align.
First, there is an open gap at this price level. Gaps frequently attract price because they represent prior imbalances in trading activity—areas where the market moved too quickly for participants to fully transact. When price revisits such a location, it becomes a zone where activity may increase. Second, the gap coincides with a region of unfilled buy orders that may serve as a UFO support area. When gaps and demand zones overlap, the confluence strengthens the rationale for using the level as a target.
Because the bearish pattern is already confirmed, traders using this structure may calculate a reward-to-risk ratio by comparing the distance from the entry zone to the stop (near 1136) and the distance from the entry zone to the target (1070'4). The role of the target is not to predict where price will go, but to anchor the trade in a predefined and measurable plan. It transforms the setup into a risk-managed scenario rather than an open-ended directional hope.
Understanding Contract Specs, Margin, and Risk Management
Traders using standardized futures contracts must structure their decisions around contract size, tick value, and margin requirements. The chart example in this idea uses the standard ZS contract, which represents 5,000 bushels. The micro contract (MZS) represents 500 bushels. This difference directly affects position sizing and the dollar impact of each tick. Because margin requirements vary over time, traders should always check the latest values before entering any position.
Tick (Minimum Price Fluctuation:
ZS: 1/4 of one cent (0.0025) per bushel = $12.50 per contract
MZS: 0.0050 per bushel = $2.50 per contract
Current Margin Requirements:
ZS: $2,000 per contract
MZS: $200 per contract
A key benefit of having two contract sizes available is flexibility. Traders seeking to maintain disciplined risk parameters often use micro contracts to fine-tune exposure, ensuring that the stop-loss level does not exceed their predefined risk tolerance. The objective of the head and shoulders pattern is not merely to identify a direction but to help traders organize their plan around risk boundaries. Knowing the contract’s characteristics enables the trader to size positions correctly.
Risk management remains the foundation of pattern-based approaches. Price can behave unpredictably, even when the chart seems decisive. This is why traders emphasize position sizing, controlled leverage, and strict adherence to the stop-loss level. The goal is not to avoid losses entirely but to keep them manageable and consistent. A well-constructed head and shoulders strategy relies not only on identifying the pattern but on respecting the risk parameters that accompany it.
Bringing It All Together: Structure, Context, and Discipline
The chart included in this idea illustrates the essential elements of the bearish head and shoulders setup: the left shoulder, head, and right shoulder; the neckline break; the gap at 1070'4; and the resistance band between 1123 and 1136. These levels form the backbone of a structured trading plan. Rather than reacting to market movement in real time, traders can use these predefined reference points to guide decision-making with consistency.
The purpose of this article is educational. It demonstrates how entries, exits, and risk parameters can be structured around a classical bearish head and shoulders pattern, how confluence strengthens downside targets, and how contract specifications help traders align position size with their risk tolerance. Above all, it shows that disciplined planning matters more than attempting to anticipate every price movement.
When charting futures, the data provided could be delayed. Traders working with the ticker symbols discussed in this idea may prefer to use CME Group real-time data plan on TradingView: www.tradingview.com - This consideration is particularly important for shorter-term traders, whereas it may be less critical for those focused on longer-term trading strategies.
General Disclaimer:
The trade ideas presented herein are solely for illustrative purposes forming a part of a case study intended to demonstrate key principles in risk management within the context of the specific market scenarios discussed. These ideas are not to be interpreted as investment recommendations or financial advice. They do not endorse or promote any specific trading strategies, financial products, or services. The information provided is based on data believed to be reliable; however, its accuracy or completeness cannot be guaranteed. Trading in financial markets involves risks, including the potential loss of principal. Each individual should conduct their own research and consult with professional financial advisors before making any investment decisions. The author or publisher of this content bears no responsibility for any actions taken based on the information provided or for any resultant financial or other losses.
Coming soon 125 Looks bullish and can double from here. My max target is 180. Hopefully 125 by Aug 2026, may go higher but minimum 125. It must stay above 60 otherwise it can crash if it loses 60.
All the best!!

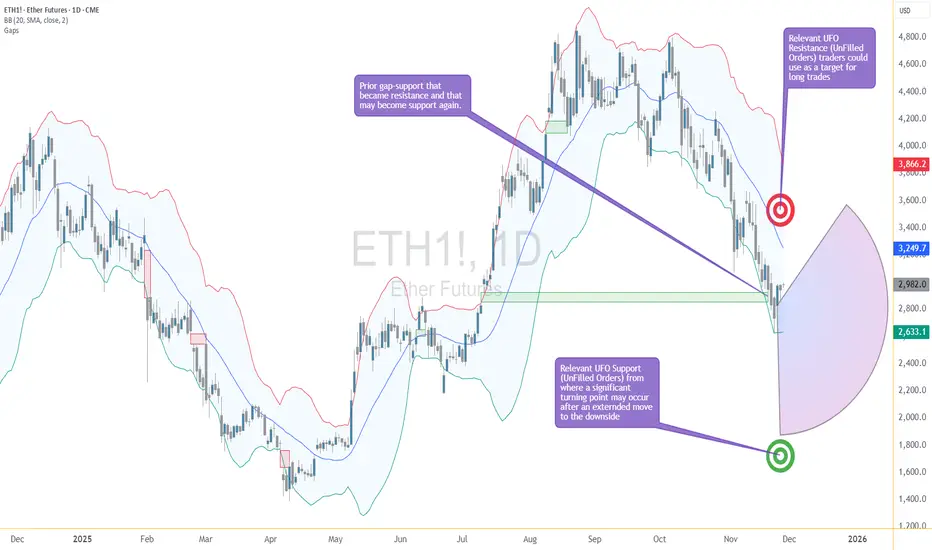
Ether Breaks the Ceiling: Is This the First Real Clue of a Turn?Ether Futures just pulled an interesting move — it finally pushed above the upper edge of the stubborn gap that has been capping price below 2853.5.
For a while, ETH was sliding down the lower Bollinger Band like a chilled skier who forgot how to turn. Now? It just jumped over the fence.
This changes things. A gap break doesn’t guarantee a trend reversal, but it’s the market’s way of saying:
“Hey, sellers… your seat might not be reserved anymore.”
The Old Barrier Is Now the New Test
That closed gap was acting like a reinforced ceiling. Buyers hitting their heads on it didn’t get far — until now. Trading above 2853.5 means the market is testing whether:
Sellers still have ammunition
Buyers can hold the reclaimed turf
Momentum is finally shifting gears
A close and hold above this zone is usually where early reversal logic starts to form.
Next Target: UFO Resistance at 3376.5
If buyers keep control, the next structural “magnet” is near 3376.5, where a cluster of unfilled sell orders waits. Markets love revisiting old unfinished business, and this is the next shelf of potential friction.
It’s not a prediction — it’s just where the roadmap naturally leads once the gap breaks.
Support Below: The New Battleground
What used to be resistance is now a potential support zone. If price pulls back toward the gap’s top edge and stabilizes, it would confirm that buyers have actually taken the wheel.
If price slips back into the gap, then this “break” was just a false alarm — the chart equivalent of stepping on a stair that wasn’t actually there.
Two Quick Read-Through Scenarios
Scenario 1 — Reversal Gains Traction
ETH stays above 2853.5
Buyers defend the reclaimed gap
Market may gravitate toward 3376.5
This would suggest the downtrend is losing its grip.
Scenario 2 — Rejection Back Into the Gap
ETH falls back below the gap ceiling
Sellers reclaim control
Market may return to prior support zones
This would keep Ether in a broader corrective environment.
The key here is not guessing — it’s waiting to see whether the breakout holds.
Futures Traders Have Two Contract Sizes to Play With
Ether Futures (ETH) are the big, fast movers.
Micro Ether Futures (MET) offer the same chart logic, but at 1/500th the size, which makes scaling more controlled.
Whether large or micro, the structure is the same — only the sizing changes.
Quick Specs (Fast & Simple)
ETH contract: 50 Ether
Tick: 0.25 per Ether = $12.50 per contract
Margin: ≈ $44,000 (varies)
MET contract: 1/500th of ETH (good for precision adjustments)
Bottom Line — The Story Just Got Interesting
For the first time in a while, Ether has stopped drifting and started acting. Breaking above the upper gap is the market’s first real sign of a potential power shift.
Now the question becomes simple:
Can buyers hold the line they just captured?
If yes → the path toward 3376.5 opens.
If no → the market falls back into its old bearish rhythm.
Either way, the quiet slide is over — this is where things get lively.
Want More Depth?
If you’d like to go deeper into the building blocks of trading, check out our From Mystery to Mastery trilogy, three cornerstone articles that complement this one:
🔗 From Mystery to Mastery: Trading Essentials
🔗 From Mystery to Mastery: Futures Explained
🔗 From Mystery to Mastery: Options Explained
When charting futures, the data provided could be delayed. Traders working with the ticker symbols discussed in this idea may prefer to use CME Group real-time data plan on TradingView: www.tradingview.com - This consideration is particularly important for shorter-term traders, whereas it may be less critical for those focused on longer-term trading strategies.
General Disclaimer:
The trade ideas presented herein are solely for illustrative purposes forming a part of a case study intended to demonstrate key principles in risk management within the context of the specific market scenarios discussed. These ideas are not to be interpreted as investment recommendations or financial advice. They do not endorse or promote any specific trading strategies, financial products, or services. The information provided is based on data believed to be reliable; however, its accuracy or completeness cannot be guaranteed. Trading in financial markets involves risks, including the potential loss of principal. Each individual should conduct their own research and consult with professional financial advisors before making any investment decisions. The author or publisher of this content bears no responsibility for any actions taken based on the information provided or for any resultant financial or other losses.
QS V3 Exclusive — Pre-Earnings GAP Short SetupGAP Earnings Signal (2025‑11‑20)
Direction: Buy PUTS (Short)
Strike Price: $23.00
Entry Range: ~$1.10 – $1.28 (mid ~$1.19)
Target 1: $1.90 (~+60% gain)
Target 2: $2.50 (~+110% gain)
Stop Loss: $0.80 (~‑33% from entry)
Expiry Date: 2025‑11‑21 (1 day)
Confidence Level: 60% (Moderate)
Recommended Position Size: ~2% of portfolio
📊 Market / Signal Analysis
Katy AI Prediction: Neutral-to‑bearish shift — price predicted down from ~$23.55 to ~$23.32 before potential minor recovery.
Technical Factors:
Current Price: ~$23.55
24h Move: ‑1.71% (suggests weakness)
Resistance near ~$24.20 / ~$24.00
Support near ~$23.00 (psychological)
Elevated volume ~1.4× average → institutional activity likely
Options / Flow:
Put/Call Ratio (PCR): 0.16 (strong call buying, contrarian PUT interest)
Volatility: High implied move ~12.8% (~$3.02) → significant risk & opportunity
⚠️ Risk Considerations & Strategy Alignment
This is a highly volatile earnings‑day trade with large implied move and only 1 day till expiry → swift action required.
Katy AI shows downward bias despite overall “BUY CALLS” composite signal → contrarian setup (PUTs)
Tight stop and conservative size recommended thanks to mixed signals and earnings risk
Aim to capture quick move rather than hold long term due to short horizon

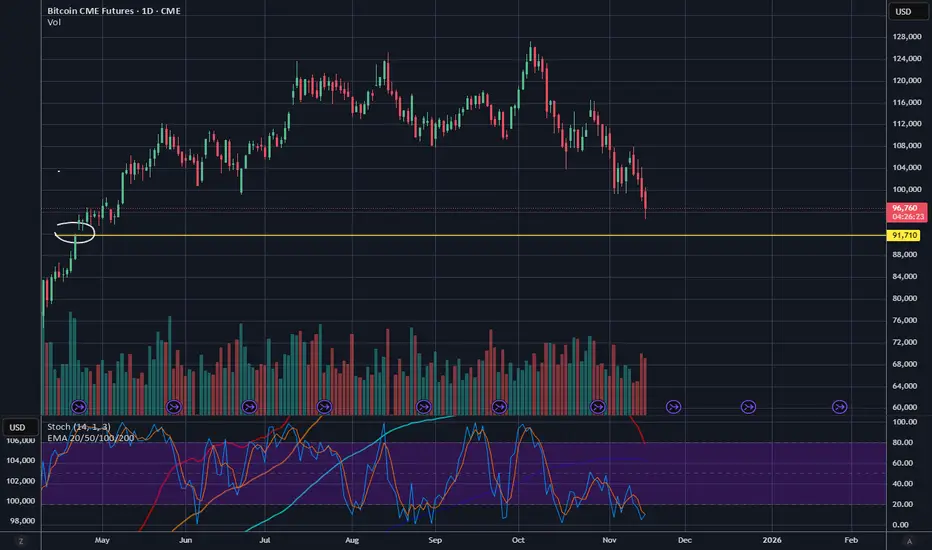
BTC CME - One final push down to close the gap?There is unfilled CME gap at $91,700 that remains unfilled. Could we have one more push down to fill it?
This can hit 40sBearish. Bearish Bearish !!! Falling knife ! $40s coming. Will buy when it hits high 30s and low 40s for a jumpt towards 80s. All the best !!
It can have some support around 115 and may jump for some time before it hits 40s...
Not a financial advise.

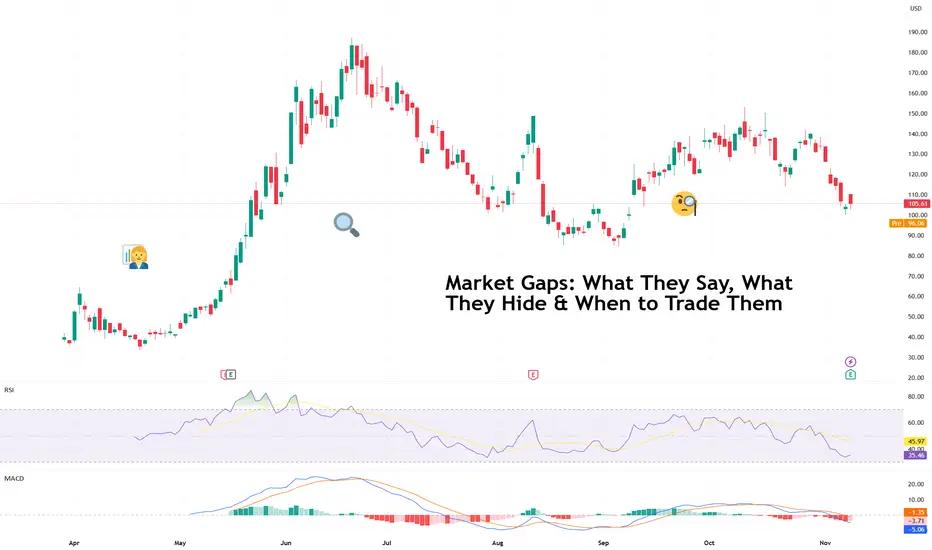
Market Gaps: What They Say, What They Hide & When to Trade ThemIt’s 9:30 a.m. You sip your coffee, glance at the chart, and there it is. Your stock has leapt several dollars higher (or lower), skipping right over the previous day’s closing price.
Welcome to the world of market gaps — those mysterious spaces between yesterday’s close and today’s open that make traders question both their strategy and their life choices.
A market gap isn’t a missing candle but the story of what happened while you were sleeping (or ignoring the news). It’s the sum of after-hours trades, global market sentiment, overnight earnings, and sometimes a rogue tweet.
The question is: should you trade them — or stay far, far away?
🌍 Why Gaps Happen
Gaps exist because markets never really sleep. When one exchange closes, another is already open somewhere else, digesting the same news through a different timezone. Add in pre-market trading, futures markets, and weekend surprises, and you get an ecosystem where prices constantly readjust (even when you can’t click “Buy”).
Most gaps fall into one of three categories:
Breakaway gaps – when new information changes everything (earnings beats, mergers, surprise rate cuts).
Runaway gaps – the “momentum monsters” that happen mid-trend when traders can’t get enough.
Exhaustion gaps – the final gasp before a reversal, when optimism or panic reaches peak saturation.
Understanding which one you’re looking at is half the battle. The other half? Not taking the bait too early.
💥 What Gaps Reveal (and Conceal)
We’re in the earnings season now so it’s pretty normal to spot a gap on the charts.
A gap higher often signals optimism: strong earnings, bullish guidance, or a macro tailwind. But it can also mean traders are front-running euphoria — piling in before the market can catch its breath.
Similarly, a gap lower screams heavy selling, but sometimes it’s just overreaction dressed as disaster. Take for example the recent showing from CoreWeave NASDAQ:CRWV . The neocloud beat on both top- and bottom-line expectations. And yet, the stock fell 8% in after-hours .
Typically, if prices hold above or below the gap for several hours or sessions, that’s confirmation that traders are validating the move. But if it’s filled quickly (the price retraces back to the previous close), it means the reaction faded faster than your New Year’s resolution.
🕳️ The Weekend Trap
Weekend gaps deserve their own warning label. Markets close Friday afternoon, and by Monday, the world’s had 48 hours to produce headlines, scandals, or White House drama.
If you hold high-risk positions over the weekend, you’re effectively saying, “I’m okay with the market repricing everything I own before I wake up Monday.” Sometimes that works — you wake up richer. Sometimes it doesn’t — and your stop-loss never had a chance.
Fast fact : Stop losses don’t work during a gap because the price jumps over your stop level — there’s no trading in between, so your order can only trigger at the next available price, often far worse than expected.
🧭 How (and When) to Trade Gaps
So how do pros handle them? Like most things in trading — with patience, context, and a healthy respect for traps.
Wait for confirmation . Don’t chase the open. See if volume supports the gap or if it’s just knee-jerk volatility.
Look left . Check past support/resistance levels — gaps tend to gravitate toward old battle zones.
Mind the news . If the gap is driven by an actual event (earnings, guidance, policy change), the odds of it holding improve. Make sure to stay on top of market-moving news .
Avoid FOMO . The first 15 minutes of trading are often chaos. Let the emotional traders clear out before you step in.
Remember the fill rule . When in doubt, assume gravity wins eventually — most gaps don’t stay open forever.
🔮 What Gaps Really Mean
Gaps are the market’s way of saying, “Something happened — pay attention.” They’re emotional, fast-moving, and occasionally misleading. But they also reveal where sentiment can truly shift — the moments when traders collectively decide that yesterday’s price was wrong.
Handled well, gaps can offer some of the cleanest trades on the chart. Handled poorly, they’re an expensive lesson in humility.
So the next time you wake up to a market that’s sprinted ahead, take a breath. The space between two candles isn’t a void. It’s a story. Read it before you react.
Off to you : How do you handle gaps? Share your approach to these market events in the comments!
Generals Charge, Soldiers Stall: Reading Bearish Divergence1. Context: The Battle Line Between Large and Small Caps
This week’s futures landscape paints a striking contrast between leadership and hesitation. In the CME equity index universe, the large caps — ES (E-mini S&P 500), NQ (E-mini NASDAQ 100), and YM (E-mini Dow Jones) — advanced as a united front, all opening above their prior week’s highs. The market generals were charging confidently uphill.
Yet, on the same battlefield, the RTY (E-mini Russell 2000) lagged behind. The small caps failed to take out the prior week’s high and opened below the aggressive gaps that marked their larger counterparts. In trader terms, breadth was narrowing. In storyteller terms, the generals were calling “forward!” — but the soldiers weren’t following.
Such divergences in participation often mark transition zones in market psychology. When large caps push while small caps stall, it doesn’t necessarily mean the campaign is lost — but it does mean confidence among the broader troops is weakening.
2. Reading the Divergence: When Breadth Narrows
The relationship between large-cap and small-cap indices often reveals more than just price action — it exposes the structure of conviction. In sustained bullish environments, small caps tend to lead or at least confirm the move. Their participation signals that risk appetite is healthy across the field, not confined to the biggest names.
When that breadth fades, the advance becomes fragile. A rally driven only by mega-cap components (the generals) can stretch further, but with decreasing participation, it becomes increasingly vulnerable to shocks. Traders who watch intermarket behavior know this phenomenon as bearish divergence — higher highs in the generals, lower or flat highs in the soldiers.
From a practical standpoint, narrowing breadth implies that fewer sectors are carrying the index higher. In other words, the market’s engine is running on fewer cylinders. This is not a timing trigger on its own, but it is a powerful contextual clue suggesting that volatility could expand when the leadership stumbles.
3. Quantifying the Risk: Supports and Market Depth
Looking beneath price, Order Flow (UnFilled Orders) provides a sense of where liquidity may reside once the current rally pauses. Key UFO support zones, acting as potential demand clusters, reveal how far the market might travel before encountering fresh buy interest.
From this week’s open:
ES shows its next support roughly 5.26% below current levels.
NQ sits around 6.25% below.
YM’s cushion lies approximately 9.39% beneath.
RTY, however, faces a much deeper air pocket — the next notable UFO support sits nearly 13.99% lower.
This asymmetry is critical. If markets retreat, small caps have the most unprotected downside terrain before reaching meaningful support. In other words, the generals may fall back a few miles, but the soldiers could tumble down the hill.
These percentages don’t guarantee a move — they outline the potential amplitude of correction if risk-off flows accelerate. The deeper the distance to support, the larger the volatility zone beneath.
4. Strategic View: Large Caps Lead, but Are They Overextended?
The current setup puts traders in a classic tactical dilemma:
Are the generals inspiring a new advance, or are they overextended and exposed?
Two plausible scenarios emerge:
Continuation scenario: If the small caps (RTY) regain strength and take out their prior week’s high, the breadth gap could close. This would validate the generals’ move and reestablish a broad-based advance.
Correction scenario: If RTY continues to stall while ES, NQ, and YM fail to sustain their gaps, it would confirm a divergence-led weakening. A close back below prior week’s highs could trigger a retreat toward the support zones identified earlier.
The idea is not to predict a reversal, but to prepare a framework in case weakness unfolds.
5. Contract Overview: E-mini and Micro Versions
To analyze or engage these markets, traders can study both E-mini and Micro E-mini contracts listed on the CME. These contracts represent standardized ways to participate in U.S. equity index movements, but at different notional sizes.
E-mini contracts (ES, NQ, YM, RTY) are the long-standing institutional benchmark instruments that track major U.S. equity indices with efficient liquidity and tight spreads.
Micro E-mini contracts (MES, MNQ, MYM, M2K) provide the same exposure pattern at one-tenth the size, offering more granularity in risk management and flexibility for smaller accounts or precise hedging.
It’s important to understand that these futures allow directional and hedging applications without requiring ownership of the underlying equities. However, as with any leveraged product, margin requirements can amplify both gains and losses. Traders should familiarize themselves with margin-to-equity ratios and maintenance requirements before participation.
S&P 500 – ES / MES
Minimum tick: 0.25 points
Tick value: $12.50 (E-mini) | $1.25 (Micro)
Typical margin: ≈ $21K (E-mini) | ≈ $2.1K (Micro)
NASDAQ 100 – NQ / MNQ
Minimum tick: 0.25 points
Tick value: $5.00 (E-mini) | $0.50 (Micro)
Typical margin: ≈ $30K (E-mini) | ≈ $3.0K (Micro)
Dow Jones – YM / MYM
Minimum tick: 1 point
Tick value: $5.00 (E-mini) | $0.50 (Micro)
Typical margin: ≈ $13K (E-mini) | ≈ $1.3K (Micro)
Russell 2000 – RTY / M2K
Minimum tick: 0.10 points
Tick value: $5.00 (E-mini) | $0.50 (Micro)
Typical margin: ≈ $9K (E-mini) | ≈ $0.9K (Micro)
Please note that all margin requirements are approximate and may be adjusted.
6. Risk Management Spotlight
Breadth divergences can test patience and positioning discipline. Managing exposure becomes as important as analyzing the signal itself.
Here are three core reminders:
Position Sizing: Adjust to volatility. If the distance to the nearest support is wide, scale down accordingly to maintain a consistent risk percentage per trade.
Stop-Loss Discipline: Predetermine exit points based on technical invalidation, not emotion.
Capital Preservation: Capital is ammunition; running out of it limits participation when true opportunity returns.
In the end, risk management isn’t about avoiding loss; it’s about surviving long enough to thrive when clarity returns. When markets are divided between generals and soldiers, maintaining balance becomes a trader’s greatest edge.
7. Educational Takeaway
The “generals vs. soldiers” analogy reminds us that market structure is not just about price—it’s about participation. When large caps surge but small caps lag, it signals a potential exhaustion point in the broader advance. The healthiest rallies are those in which all troops move in sync.
For traders and investors, breadth divergences serve as an early-warning system, not a countdown clock. They encourage a review of exposure, tighter stop placement, and a shift toward risk-awareness rather than return-chasing.
At this stage, the technical setup across U.S. index futures reads like a fragile truce: ES, NQ, and YM maintain their gains above prior-week highs, while RTY still lingers below. Should the soldiers eventually follow, confidence could rebuild. But if the generals start retreating first, the path toward their UFO supports could unfold quickly.
The core takeaway: breadth divergences don’t predict timing—they illuminate imbalance. Recognizing that imbalance early allows traders to respond intelligently instead of react emotionally when volatility expands.
When charting futures, the data provided could be delayed. Traders working with the ticker symbols discussed in this idea may prefer to use CME Group real-time data plan on TradingView: www.tradingview.com - This consideration is particularly important for shorter-term traders, whereas it may be less critical for those focused on longer-term trading strategies.
General Disclaimer:
The trade ideas presented herein are solely for illustrative purposes forming a part of a case study intended to demonstrate key principles in risk management within the context of the specific market scenarios discussed. These ideas are not to be interpreted as investment recommendations or financial advice. They do not endorse or promote any specific trading strategies, financial products, or services. The information provided is based on data believed to be reliable; however, its accuracy or completeness cannot be guaranteed. Trading in financial markets involves risks, including the potential loss of principal. Each individual should conduct their own research and consult with professional financial advisors before making any investment decisions. The author or publisher of this content bears no responsibility for any actions taken based on the information provided or for any resultant financial or other losses.

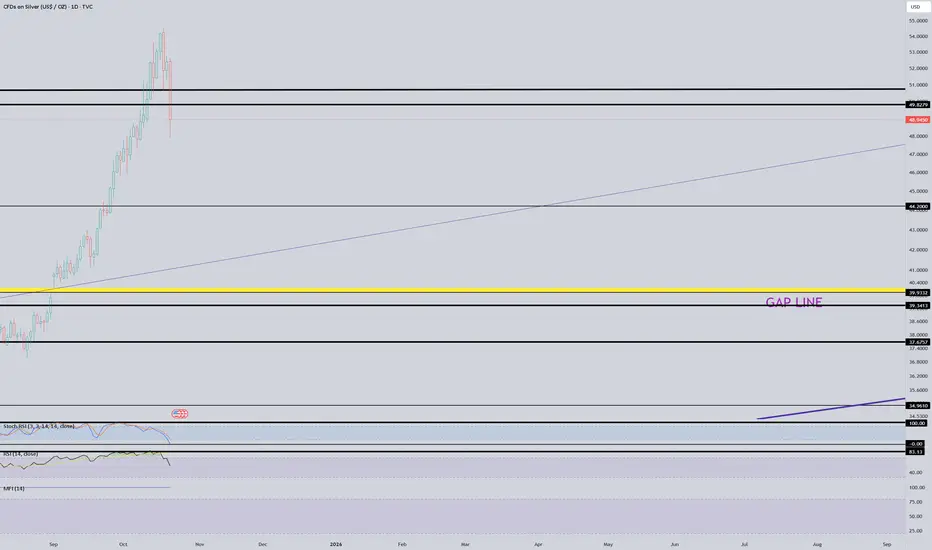
Major gap sitting there at $39 I have trouble believing this daily/weekly/monthly gap doesn't get filled at $39.
Keep an eye on this!
If it breaks below $44... I believe we're headed there.
This might become the last great opportunity to buy silver/stocks.
EURJPY - Buy the gap, ride the trend!EURJPY remains overall bullish inside an ascending channel.
Price is pulling back toward a support zone that coincides with the lower channel trendline—a strong confluence where I’ll look for trend-following longs. The small gap overhead adds fuel for a potential snap-back if buyers step in.
I’ll wait for a bullish rejection (wick rejections, H4 bullish engulfing, or a break-retest back above the intraday lower highs) around 172.8–173.4 to enter.
As long as this intersection holds, I’ll target the mid-channel first, then the upper boundary near 176.5 and 178.0–178.8.
The plan is invalidated on a clean H4 close below 172.3 (under the zone and trendline), which would open a deeper correction before any new buy setup.
⚠️ Not financial advice. Do your own research and manage risk (position sizing, stops, partials).
All Strategies Are Good; If Managed Properly!
~Richard Nasr

Dont get trapped chasing the Opening gap Bitcoin Hello and Welcome
Here I present to you a quick theory on the Bitcoin CME open in the event we gap down and open in the 112K range.
This idea is just something to consider in the week ahead, with many traders destroyed as a result of Fridays crash and emotions running high going into the week ahead I encourage you to take a listen to this potential scenario for the week ahead on BTC.

When will Microsoft (MSFT) close its monthly gap?NASDAQ:MSFT
Microsoft (MSFT) saw a 7% gap up following its earnings report in May.
To fill this gap, the stock would need to drop about 28.59% from its high, or 23.33% from the current level.
Historically, gaps on the monthly chart have eventually been filled, so it’s reasonable to assume that this one might be as well in the long term.
However, given that MSFT is one of the top three companies by market capitalization, a decline of more than 20% would likely trigger a broader correction across the Nasdaq index.
Therefore, this potential gap fill should not be seen merely as an individual stock event, but rather as part of a broader market correction scenario.
Your follow and boost would mean a lot. 🚀
I am Korean and I used Google Translate.

Mind the Gap! The Euro's Waiting GameShadows and Gaps: The Market’s Inside Joke
Euro FX Futures (6E, M6E) are doing that thing again… you know, when the chart leaves a Long Upper Shadow (LUS) on the weekly candle and basically whispers, “Don’t get too comfortable up here, bulls.”
Shadows this long usually mean buyers tried to party at higher levels, but sellers crashed the event and sent everyone home early. And just to make life interesting, the daily chart left an open gap below — like an unfinished side quest in a video game. Gaps are notorious for pulling price back, sooner or later, because the market hates leaving things undone.
The Setup: Simple but Sweet
Here’s how the trade idea shapes up:
Trigger: Wait for a break below 1.17865 (prior low).
Target: 1.17475 — the “gap magnet” zone.
Stop: 1.18090, based on volatility so it isn’t just a random guess.
Reward-to-Risk: Around 2:1. Clean, balanced, and not too shabby.
⚠️ Quick heads-up: right under that gap sits a support zone. Translation? Don’t overstay your welcome. Get in, fill the gap, and don’t go fishing for extra ticks where a bounce might kick you out.
Why This Combo Works
This setup is a little like peanut butter and jelly — two different flavors that just click.
Weekly chart = a big ol’ rejection shadow.
Daily chart = a gap that’s basically screaming, “Fill me!”
Put them together, and you’ve got multi-timeframe confluence — a fancy way of saying “both charts agree.” And when charts agree, traders pay attention.
Big vs. Mini: Futures Contract Fun
6E (Euro FX Futures): Big contract, €125,000. Each tick = $6.25. Great for heavy hitters.
M6E (Micro Euro FX Futures): Mini-me version, 1/10th the size. Each tick = $0.625. Perfect if you’d rather test the waters than dive headfirst.
Micros make scaling in and out a breeze, and honestly, they’re underrated for learning without risking the farm.
The Takeaway
The Euro is caught between rejection above and a magnet below. No downside break yet, but once 1.17865 goes, the path to 1.17475 could be quick.
Moral of the story? Candlestick shadows troll the highs, gaps tempt the lows, and patience is the secret sauce.
Want More Depth?
If you’d like to go deeper into the building blocks of trading, check out our From Mystery to Mastery trilogy, three cornerstone articles that complement this one:
🔗
🔗
🔗
When charting futures, the data provided could be delayed. Traders working with the ticker symbols discussed in this idea may prefer to use CME Group real-time data plan on TradingView: www.tradingview.com - This consideration is particularly important for shorter-term traders, whereas it may be less critical for those focused on longer-term trading strategies.
General Disclaimer:
The trade ideas presented herein are solely for illustrative purposes forming a part of a case study intended to demonstrate key principles in risk management within the context of the specific market scenarios discussed. These ideas are not to be interpreted as investment recommendations or financial advice. They do not endorse or promote any specific trading strategies, financial products, or services. The information provided is based on data believed to be reliable; however, its accuracy or completeness cannot be guaranteed. Trading in financial markets involves risks, including the potential loss of principal. Each individual should conduct their own research and consult with professional financial advisors before making any investment decisions. The author or publisher of this content bears no responsibility for any actions taken based on the information provided or for any resultant financial or other losses.

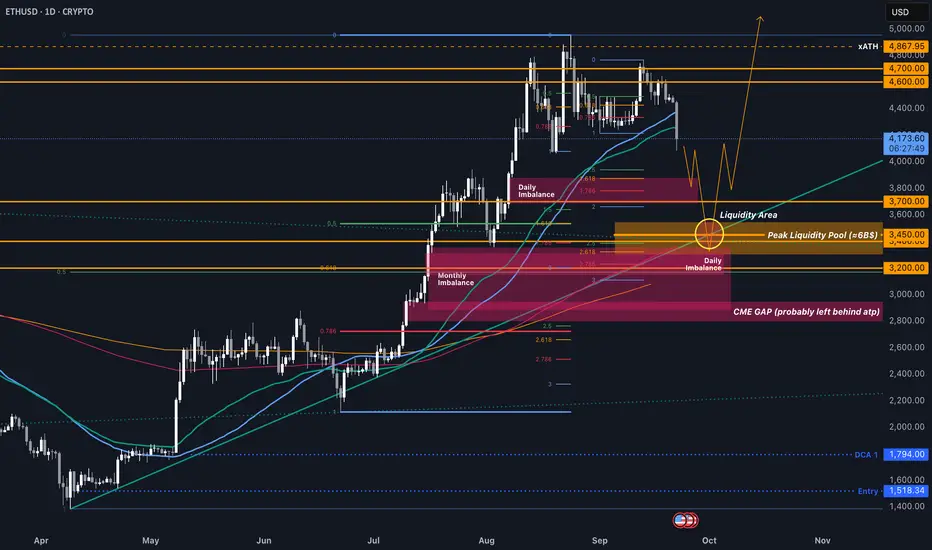
Possible Pre-Skyrocket ManipulationSince every soul on this earth knows that we will see huge bull-moves with given and upcoming rate cuts + october price action, its not unlikely that we COULD manipulate even lower after the Billion Dollar liquidation move overnight.
IF we do so, we would do it pretty fast and continue the displacement from the bearish head and shoulders pattern that broke the daily 50 EMA%SMA in the next few weeks.
On a technical site, there is still a huge amount of liquidity on CRYPTO:ETHUSD left (around 20B$), most accumulated at around 3.450$.
Strangely enough, that area matches the current ranges equilibrium, standard deviation levels of prior bearish manipulation moves, KEY SR Levels of 3400 and 3200, monthly and daily imbalances (which will get filled sooner or later), the 200D EMA and 50W EMA, AND the current htf bullish trendline and broken triangle resistance...
If we hit this before mid-October, these will be free longs, and I will DCA into my position, which sits at 1.794$ currently.
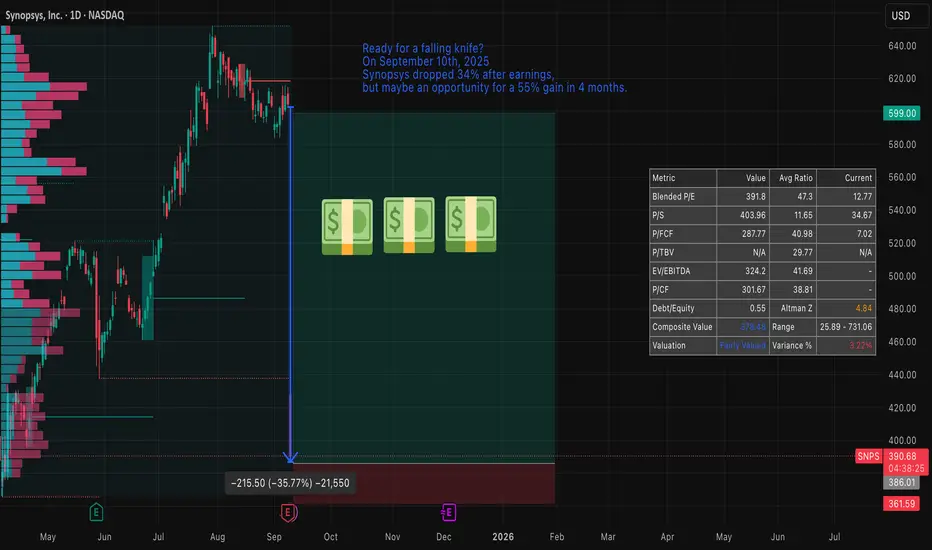
Synopsys — a sharp sell-off, risky entry and clear opportunitySynopsys plunged roughly 30–34% on 10 September 2025, wiping out a large chunk of market value after quarterly results missed expectations and guidance was cut. That kind of move often feels like a “falling knife”: attractive on paper, dangerous in practice.
Price action and technical context
The stock has gapped lower and left a sizeable down-gap to fill. From a technical viewpoint the setup resembles a fast, impulsive sell-off inside a broader downtrend established since the spring; price is now testing levels that were former support in April 2025. Short-term momentum indicators show oversold readings, but volatility is elevated and trend-following measures still favour the downside until a reliable base is formed.
Key technical reference points to watch:
Gap zone/topside resistance: around the pre-drop range near the mid-$600s.
Immediate support / stop placement: just below the April 2025 lows (your stated stop).
Possible gap-fill target: if the market rotates back, reclaiming the gap by January 2026 implies roughly a ~55% upside from current depressed levels (as you noted).
Fundamentals and why this remains an opportunity
Despite the headline shock, Synopsys’s underlying business remains high-quality:
Market-leading positions in EDA tools and IP libraries.
Strong, recurring revenue mix (software subscriptions and maintenance).
Long secular tailwinds from AI, advanced node design and chiplet modularity.
Valuation has re-rated materially after the drop — the company is no longer priced at the frothy multiples of earlier in the cycle. Analysts have revised estimates downward but many still target stock levels clustered around $600, reflecting belief in recovery by late 2025 / early 2026.
Options flow and timing
There is notable open interest concentration in both calls and puts around the $600 strike with expiries in December 2025 and January 2026. That concentration suggests the market expects meaningful activity/interest around that level into the winter and gives a window where a gap-fill or relief rally could materialize before January expiries.
Risk management and trade plan
Trade type: speculative rebound / gap-fill play, not a buy-and-forget investment.
Target: gap-fill / recovery toward pre-drop levels by January 2026 — roughly +55% potential from current depressed price (per your scenario).
Stop: just below April 2025 lows (limits downside if the downtrend resumes).
Position sizing: small relative to portfolio — treat as a high-volatility, event-driven trade.
Alternatives: consider defined-risk option structures (e.g., debit spreads) to cap downside while retaining upside exposure to a gap fill.
Catalysts to monitor
Any updates to guidance or profitability from Synopsys management.
China demand/FX developments and IP licensing commentary.
Options positioning into December 2025 / January 2026 expiries.
Broader semiconductor capital spending and AI-related design win announcements.
Technical indicators to watch
200DMA and April lows (support/resistance anchors).
RSI(14) and MACD for bullish divergence and momentum confirmation.
Volume on any recovery day — strong volume on up days increases odds of a sustained bounce.
Bottom line
This is a high-risk, high-reward setup: a classic “ falling knife ” that can be dangerous if you’re early, but presents a credible opportunity because Synopsys’s fundamentals remain solid, valuation is more attractive, and market positioning (options interest near $600) favors a potential recovery window through January 2026. Use tight risk controls (stop under April lows) and consider defined-risk option plays if you prefer limited downside.
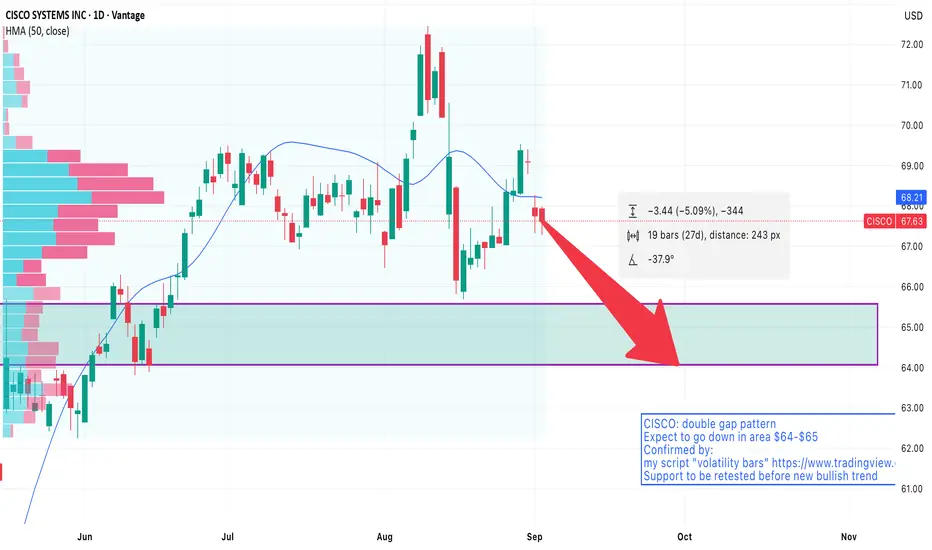
CISCO: bearish pattern foundCisco (CSCO) Forecast:
Double gap pattern spotted for Cisco (CSCO), with expectations for the price to decline to the $64-$65 range in the next days.
Confirmation
This forecast is supported by my script, "Volatility Bars".
Additional Insights
I expect that the price will retest support area $64-$65 before initiating a new bullish trend.
Keep an eye on market conditions and any news that may impact Cisco's performance.
Trading Ideas
Short Position:
Entry: Current market price
Take Profit (TP): Set at 5%-6% below the current price.
Long Position:
Entry: Wait for a retracement to the $64-$65 area to buy.
Feel free to share your thoughts or any additional insights!
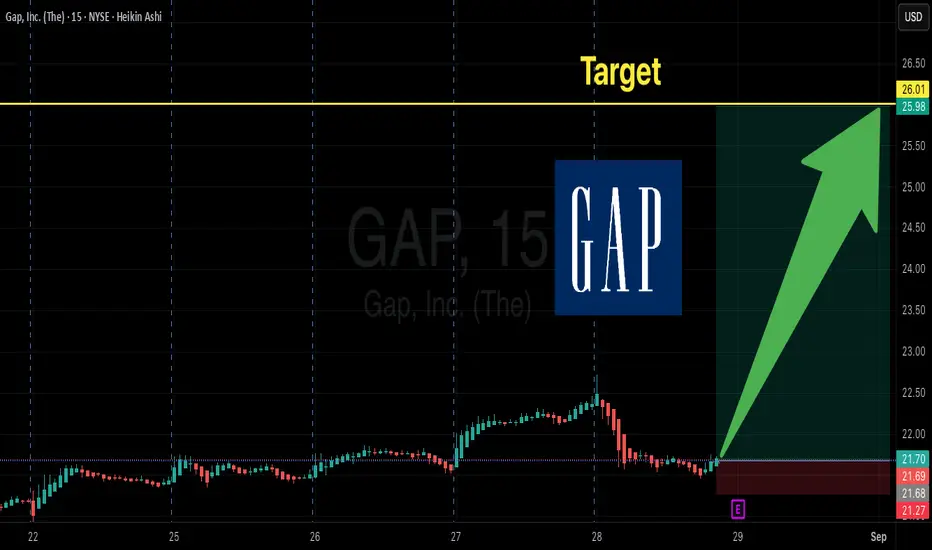
GAP Earnings Jackpot? 75% Bullish Call Setup Into AMC!
# 🚀 GAP Earnings Play (8/28 AMC) 🚀
💰 **Bullish Call Setup – 75% Conviction** 💰
### 🔥 Thesis
* 📈 4 straight EPS beats (avg +29% surprise)
* 💵 Strong margins & \$2.2B cash cushion
* 🔮 Technicals bullish → Price \$22.30 > 20/50/200 MA
* 📊 Options flow: heavy \$23C OI, hedging on \$20P (bullish skew)
* 🌎 Low VIX (14.9) supports directional move
**Conviction: 75% (Moderate Bullish)** 🎯
---
### 🎯 Trade Setup
* **Ticker**: \ NYSE:GAP
* **Direction**: CALL
* **Strike**: \$23.00
* **Expiry**: 2025-08-29
* **Entry Price**: \$0.61 (ASK)
* **Entry Timing**: Pre-earnings close (8/28 AMC)
* **Size**: 1 contract (risk \$61)
---
### 📏 Risk / Reward Plan
* 🛑 **Stop Loss**: \$0.30 (-50%)
* 🎯 **Profit Target**: \$1.83 (200%) → \$122 profit per contract
* ⚡️ **Breakeven**: \$23.61 (+5.9% move)
* ⏰ **Exit Rule**: Within 2 hrs post-earnings open OR hit target/stop
---
### 📌 Scenarios
✅ **Bull Case**: EPS beat + guide up → Gap to \$24.5–25.5 → Calls \$1.83–\$2.40 (200–300%)
➖ **Base Case**: Inline → stock \$21–23 → IV crush → stop \$0.30
❌ **Bear Case**: Miss → stock <\$21 → calls near 0
---
### 🤝 Model Consensus
* Claude: \$22C @0.99 ✅
* Gemini: \$23C @0.61 ✅
* Llama: \$23C @0.61 ✅
* Grok: \$22C @0.97 ✅
📊 **All bullish (72–78%)** → Only debate = strike (\$22 vs \$23)
---
🚦 **Final Call**:
👉 BUY \ NYSE:GAP 8/29 \$23C @0.61 BEFORE 8/28 CLOSE
⚡️ Quick exit post-print to dodge IV crush
---
\#️⃣ Hashtags:
\#EarningsPlay #OptionsTrading #GAP #CallOptions #TradingSetup #StockMarket 🚀📊
Review and plan for 18th August 2025 Nifty future and banknifty future analysis and intraday plan.
This video is for information/education purpose only. you are 100% responsible for any actions you take by reading/viewing this post.
please consult your financial advisor before taking any action.
----Vinaykumar hiremath, CMT

Intraday set up for 7th August 2025 Nifty future and banknifty future analysis and intraday plan.
Quarterly results.
This video is for information/education purpose only. you are 100% responsible for any actions you take by reading/viewing this post.
please consult your financial advisor before taking any action.
----Vinaykumar hiremath, CMT

Uptrend resuming SHIN ZU SHING CO TWSE:3376 is looking at a resumption of the uptrend after price action indicates a strong bullish after breaking above the bullish flag and it has successfully cleared above the bearish gap zone which occurs on 10 Apr 25. We believe further upside is likely to continue as long-term MACD’s histogram and its signal/MACD line has returned to the upside. Stochastic has risen steadily. Volume is also in a healthy position. Short-term target is at 282.50 while long-term target is at 345.00. Support to accumulate on pullback is at 209.20.
