Bitcoin (CME) - GAP that needs to be filledWe just got a gap on the CME. Making it very likely we will go up from here and form a bottom on Bitcoin.
Gapfill

$FISV ready to launchNASDAQ:FISV is trying to recover from a major selloff just months ago. One catalyst since then was heavy insider share purchases to establish confidence among investors.
Fundamentals aside, an ascending triangle has been forming and we're right at the apex, which sits in front of a massive gap. That gap fill could provide north of 70% returns, and it might just be the beginning of the recovery trade!

XAG/USDSilver Short trade. A very risky trade, but i guess two gaps in comex silver is not normal. Hence we look for a short trade in silver with strict sl of 95 to 95.1$.
Entry- 93-93.5
SL- 95.1 STRICT.
Target- Todays low that is the gap, 2nd target is for 88 dollars.
Disclaimer- This is just for educational purpose.
JAI SHREE RAM.

CME gap needs to be filled..There is a CME gap that has not been filled between $88,120-88,720
Suggest be aware of this prior to market open,as a move down in price usually will follow.

Crude Oil Futures Closing the GAP this Week?📊 CRUDE OIL FUTURES (FEB 2026) TECHNICAL ANALYSIS
"The goal of a successful trader is to make the best trades. Money is secondary." — Alexander Elder
The Crude Oil Futures (CLG2026) chart on the 1-hour timeframe shows a significant bearish breakdown as we head into late December 2025. Sellers have taken control after a period of distribution near the recent highs.
📉 CURRENT PRICE ACTION
Ticker: CLG2026 (Crude Oil Feb '26)
Price: 56.93 (+0.05% in the current session)
Trend: The market has experienced a sharp "flush" from the 58.40 level, breaking through multiple support zones in a single high-momentum move.
🚀 CRITICAL LEVELS TO WATCH
UPWARD RESISTANCE
Entry Zone: 58.40 (This was the previous distribution peak and acts as significant resistance on any bounce).
Previous Support: 57.80 (The blue line now acts as a technical "ceiling" for short-term recovery).
DOWNWARD SUPPORT
Market Closing Price: 56.94 (Current area of consolidation following the breakdown).
Target Gap: 56.53 – 56.60 (The chart indicates an "Open Gap" that hasn't been filled yet; price is gravitating toward this zone).
📈 MOMENTUM AND PATTERNS
Distribution Box: The yellow box near the top shows the price struggling to move higher before the aggressive sell-off.
Breakout Move: A large yellow rectangle highlights the high-velocity downward move that invalidated the previous bullish structure.
Gap Theory: The orange arrow points directly to the lower gap, suggesting a high probability that the price will hit the 56.50 range before finding new buyers.
🔍 TRADING STRATEGY
Bearish Bias: The overall short-term outlook is bearish as long as the price remains below 57.80.
Gap Fill Play: Traders are likely watching for a move into the 56.60 "Gap" zone to look for potential "exhaustion" or reversal signs.
Wait for Rejection: If the market rallies back to 57.14, look for rejection candles to confirm the downtrend's continuation.
#CrudeOil #OilTrading #FuturesTrading #TechnicalAnalysis #Commodities #CLG2026 #WTI #TradingStrategy #MarketUpdate

COCOA: The Unfilled Gap & The Solitary DancerThe Philosophy: Dancing to Your Own Tune
In the grand orchestra of the markets, it is easy to get lost in the noise of the crowd. We are all playing different instruments, adhering to different rhythms and frequencies. Yet, together, we form a chaotic but beautiful composition.
However, when it comes to execution, you must be a soloist. I often repeat, there is nothing new under the sun —just new ways to complicate simple statistics. The crowd is currently shouting "Bearish," pointing to the obvious trend. But we deal in probabilities, not certainties.
Copying a trade is akin to gambling; you borrow the entry but you cannot borrow the conviction. When the heat is on, only your own thesis will keep you steady. You must train yourself to follow your plan flawlessly rather than waiting for a conductor to wave a baton. Today, I am looking at a contrarian setups on Cocoa—a bullish reversal in a sea of red, based on market inefficiency.
The Technical Landscape: The Bearish Context
Let us acknowledge the reality before we dream of the reversal. As the analysis shows:
The Daily and 4H trends are undeniably bearish, adhering to a descending channel. Price has broken the shelf at 5,500 , flipping it into a formidable resistance.
Volume profiles show heavy overhead supply.
Most would stop here. But context matters. Most breakouts fail, and most trends eventually exhaust. We are approaching the psychological support of 5,000 , a level where the "bears have fattened up for winter" and may soon look to hibernate (take profits).
The Setup: The Gap Fill Thesis
My eyes are fixed on the Market Inefficiency —the massive UNFILLED GAP hovering above. The market abhors a vacuum; price seeks liquidity like water seeks a valley.
The Bullish Thesis: We are looking for a failure of the current bearish momentum to translate into a mean-reversion trade.
The Trigger: We need to see price reclaim and close above the 6,000 level on the 4H chart. This invalidates the immediate bearish breakdown.
The Target: Once the reversal is confirmed, the magnet is the liquidity void (Gap Fill) aimed toward 7,200 .
The Risk: Until 6,000 is reclaimed, this is catching a falling knife. If 5,600 gives way, the thesis is invalid, and we step aside.
Remember, I share this not so you can mimic my steps, but so you can find your own rhythm within the music.
Disclaimer: This is not financial advice. It is for educational and informational purposes only. Please conduct your own research and manage your risk accordingly.

Neckline Breaks and Trader Nerves: A Quick Guide to Bearish H&S The head and shoulders pattern is like the market’s way of clearing its throat and saying, “Things might be changing up here.” Once that neckline snaps, traders often sit up straighter — not because something magical happened, but because the chart finally drew a clean line between “maybe” and “now it matters.”
In this ZS (Soybean Futures) example, price slipped under the neckline and started wandering toward lower ground. Traders who work with this pattern usually focus on three things:
A possible bounce back toward the neckline (because markets love second chances),
A clear invalidation level (in this case, above 1136),
A logical downside objective such as the gap-and-support combo near 1070'4.
That simple trio turns a chaotic chart into a calm plan.
Contract specs matter too. The ZS contract moves in bigger bites:
Tick: 1/4 of one cent (0.0025) per bushel = $12.50 per contract
Margin: $2,000 per contract
The MZS (Micro Soybean Futures) contract takes smaller ones:
Tick: 0.0050 per bushel = $2.50 per contract
Margin: $200 per contract
Traders who want more precision sometimes choose the micro so their stop-loss distance and account size stay on speaking terms. Either way, the chart sets the idea, but the contract size sets the comfort level.
And of course, the golden rule in pattern-based trading: the market can still do whatever it wants. That’s why traders define their exit if wrong, their objective if right, and their size before clicking anything. A head and shoulders isn't about predicting — it's about organizing.
The chart example ties it all together: neckline break, resistance overhead, downside target below. Simple, structured, and practical — just the way traders like it.
Want More Depth?
If you’d like to go deeper into the building blocks of trading, check out our From Mystery to Mastery trilogy, three cornerstone articles that complement this one:
🔗 From Mystery to Mastery: Trading Essentials
🔗 From Mystery to Mastery: Futures Explained
🔗 From Mystery to Mastery: Options Explained
When charting futures, the data provided could be delayed. Traders working with the ticker symbols discussed in this idea may prefer to use CME Group real-time data plan on TradingView: www.tradingview.com - This consideration is particularly important for shorter-term traders, whereas it may be less critical for those focused on longer-term trading strategies.
General Disclaimer:
The trade ideas presented herein are solely for illustrative purposes forming a part of a case study intended to demonstrate key principles in risk management within the context of the specific market scenarios discussed. These ideas are not to be interpreted as investment recommendations or financial advice. They do not endorse or promote any specific trading strategies, financial products, or services. The information provided is based on data believed to be reliable; however, its accuracy or completeness cannot be guaranteed. Trading in financial markets involves risks, including the potential loss of principal. Each individual should conduct their own research and consult with professional financial advisors before making any investment decisions. The author or publisher of this content bears no responsibility for any actions taken based on the information provided or for any resultant financial or other losses.

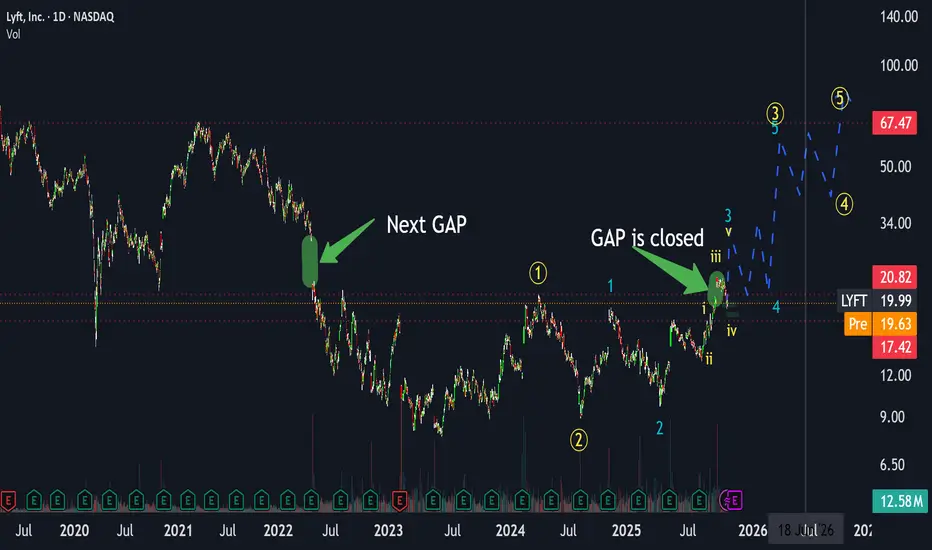
LYFT: The Hidden Gem in My October Top 3 PicksAs I’ve mentioned in my recent videos, LYFT is one of my top 3 priority stocks for October — and for good reason.
The fundamentals have exploded while the price is still lagging far behind.
🔸 Fundamentals
EPS growth has been massive .
– In March, EPS was up +128% YoY,
– and by June, it jumped to +234% YoY.
EPS has finally moved into positive territory , which is a strong signal.
Revenue continues to rise steadily, and EPS literally took off while the price hasn’t followed yet.
To put it in perspective — when LYFT traded around $60, EPS was negative .
Now, EPS is many times higher, but the stock still trades far below those levels.
Even emission has stopped increasing (we saw –0.25% in June 2025), and the forward P/E is only 15.3 ,
which is extremely low for this kind of EPS acceleration.
→ In short: LYFT looks deeply undervalued from a fundamental standpoint.
🔸 Technical Picture
Technically, LYFT has just closed a local gap , exactly as expected.
We are currently finishing the fourth sub-wave of the third global wave .
This means the fifth wave is coming next, and the current target around $70 represents only the peak of the third sub-wave — there is still additional upside expected beyond $70.
In the short term, we could see a retest around $18 ,
followed by the next major move — closing the May 2022 gap near $30 , forming the third wave of this cycle.
After that, some consolidation is likely in the $20–30 range,
followed by the next impulse targeting $50–70 .
This will be the fourth wave pullback, eventually leading into the fifth wave breakout above $70 ,
with potential for even higher upside as the global third wave continues.
Summary
Overall, LYFT shows a perfect mix of improving fundamentals and bullish technical structure.
As I’ve said in my latest videos, this stock could take off soon —
and it remains one of my Top 3 picks for October .
Call to Action
If you enjoy this type of analysis or would like me to review other tickers, tap on rocket 🚀 and leave a ticker in the comments .
I’ll make sure to cover your suggestions in upcoming posts soon!
(Full breakdown and context discussed in my recent videos — you can find them via my profile.)
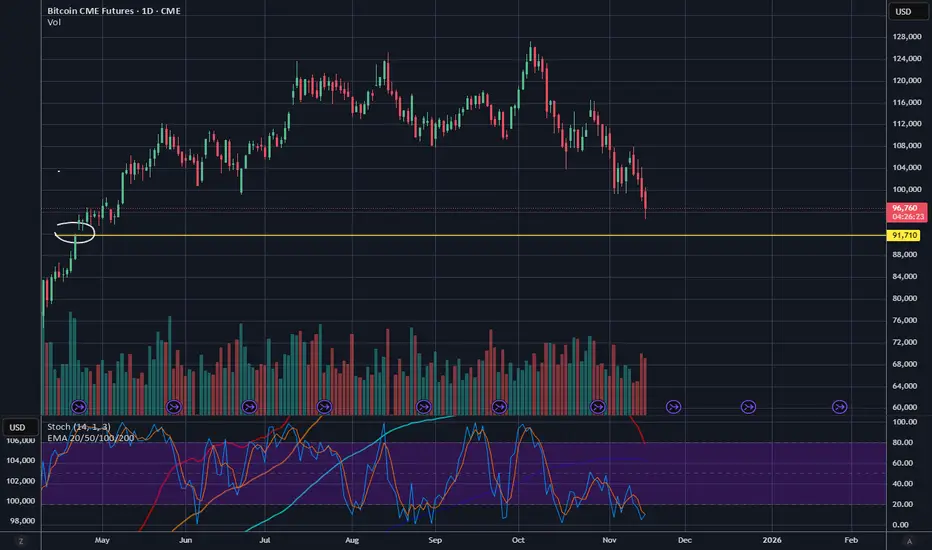
BTC CME - One final push down to close the gap?There is unfilled CME gap at $91,700 that remains unfilled. Could we have one more push down to fill it?
Support and resistance key guide (Volume, Trendlines, FVG, MA)Support and resistance key guide (Volume, Trendlines, FVG, MA)
1️⃣ Importance of Support and Resistance in Highly Volatile Crypto Markets
The cryptocurrency market operates 24/7/365, exhibiting far greater volatility than traditional financial markets. This volatility presents substantial profit opportunities, but it also triggers intense fear and greed among investors, creating significant psychological stress.
Support and resistance serve as key milestones in this chaos, signaling zones where price reactions are likely. Beyond mere technical analysis, they reflect the collective psychology of countless traders. Understanding them is essential for success in crypto trading.
2️⃣ The Nature of Support and Resistance and Their Psychological Basis
Support and resistance occur where buying and selling pressures strongly collide, slowing or halting price movement.
Support:
At this level, buyers see the asset as "cheap enough!" and stand ready, forming a psychological and physical barrier against further decline. Additionally, traders previously trapped in losing positions may sell at breakeven, adding resistance against further drops.
Resistance:
At this level, sellers perceive the asset as "expensive enough!" and offload positions, while traders previously trapped at highs may sell with a "better late than never" mindset, limiting upward movement.
※ Meaning of Support/Resistance Breakouts and “Fakeouts”:
When a support level is breached, existing buyers may panic and trigger stop-loss selling. Conversely, breaking resistance may prompt buyers to enter, accelerating the trend.
However, some breakouts can be “fakeouts,” designed to exploit trader psychology. Premature chasing of such moves should be avoided.
3️⃣ Key Support and Resistance Pattern Analysis
📈 Trendlines and Consolidation Zones: The Psychology Behind Market Order
Trendlines: Trendlines visually represent the shared expectation among traders that price will move in a certain direction. Touching an upward trendline triggers “buy at a bargain” psychology, while touching a downward trendline triggers “it can’t go higher” sentiment.
Consolidation Zones (Boxes): These are zones where buying and selling pressures balance each other. Traders plan trades around these zones, dominated by the “waiting for breakout” psychology to capture significant moves.
📈 FVG (Fair Value Gap): Market Inefficiency and Smart Money Footprints
FVGs occur when the market moves too rapidly through a price range, leaving a “price gap.” They often reflect sudden activity by smart money (institutions, whales).
Gap Filling:
Markets instinctively avoid leaving incomplete states (FVGs) unaddressed. When price re-enters an FVG zone, the players who drove the prior rapid move may close or re-enter positions, forming support/resistance. Beginners can treat FVGs as smart money footprints and follow their activity strategically.
📈 Moving Averages (MA): Collective Psychology and Trend Direction
Moving averages reflect the average price perceived by the market over a period. Being widely monitored, they act as psychological support/resistance levels.
Short-term MA (e.g., 50MA): Reflects short-term trader sentiment. Price below it can trigger “short-term trend broken?” anxiety, while above it fosters optimism.
Long-term MA (e.g., 200MA): Represents long-term trader psychology and trend direction. Price below 200MA creates fear of a long-term downtrend, while above inspires hope of a sustained uptrend. When acting as support/resistance, MAs carry strong psychological consensus as a widely observed benchmark.
📈 POC (Point Of Control) Volume Profile: Market Consensus and the Power of Volume
POC is the price level with the highest traded volume over a period. It indicates market agreement on price, with substantial volume concentrated there.
Price below POC: POC becomes strong resistance. Buyers trapped in losing positions may sell at breakeven, and sellers actively resist upward moves.
Price above POC: POC acts as strong support. Buyers believe “price won’t fall below this level,” and prior sellers may switch to buying.
POC represents the market’s “expected price” and the zone where loss-aversion psychology is strongest.
📈 Fibonacci: Natural Order and Human Expectation
Fibonacci retracements apply golden ratio mathematics to charts, reflecting the expectation that price will reverse at certain levels, forming support/resistance.
These levels are not coincidental; many traders plan trades around them, causing real market reactions.
Levels like 0.5 (50%) and 0.618 (61.8%) are psychologically significant, viewed by traders as buying or selling opportunities. Support/resistance forms through “herd psychology,” as many act in unison.
📈 CME Gap: Institutional Moves and Market Regression Instinct
CME gaps occur in Bitcoin futures dominated by institutional investors. They happen when the spot market moves over weekends while futures are closed, and the market tends to “fill the gap.”
Gap Filling: CME gaps represent periods without institutional activity, prompting the market to normalize these “abnormal” price zones.
Traders anticipate “the gap will eventually be filled,” making these zones potential strong support/resistance, reflecting future-oriented market psychology.
4️⃣ Managing Trading Psychology Using Support and Resistance
Even the best tools are ineffective without psychological discipline.
Confirmation bias and stop-loss discipline: Ignoring losses due to selective perception leads to ruin. When support breaks, acknowledge your prediction was wrong and act decisively to exit.
Overbought/oversold psychology and FOMO:
Avoid chasing price surges out of fear of missing out (“everyone else is profiting, why not me?”).
During crashes, resist panic selling at the bottom. Base trades on your rules derived from support and resistance.
Partial trading for risk management:
Avoid buying all at support or selling all at resistance at once. Splitting trades across multiple support/resistance levels provides psychological stability and reduces the impact of wrong predictions.
5️⃣ Comprehensive Strategy Formation and Practical Application Tips
Multi-level Support/Resistance Confluence: Overlapping zones (e.g., Fibonacci 0.618 + 200MA + POC + FVG bottom) create very strong support/resistance. These reflect collective trader agreement and can be traded with higher confidence.
Volume Analysis and Support/Resistance Strength: High volume at a zone confirms its significance. Reliable breakouts require strong volume, showing market participation and intent.
Develop Your Own Trading Plan: Don’t blindly follow all patterns. Choose indicators and methods that suit you to establish personal trading rules. Adhering to these rules maintains psychological stability and long-term success.
If you found this content helpful, please show your support with a Boost (🚀) and a comment (💬)! Your encouragement is a great motivation for us to create better analyses and content. You can also follow us to receive notifications about new posts.
Live Trading - Breakeven pt.2Was aiming for a gap fill.
Sold at breakeven, and protected capital.
CBOT_MINI:YM1!

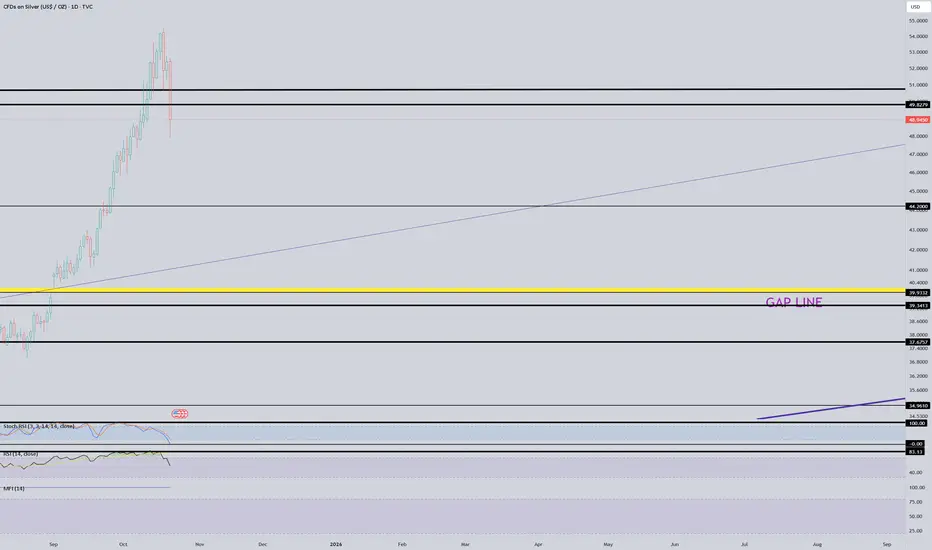
Major gap sitting there at $39 I have trouble believing this daily/weekly/monthly gap doesn't get filled at $39.
Keep an eye on this!
If it breaks below $44... I believe we're headed there.
This might become the last great opportunity to buy silver/stocks.
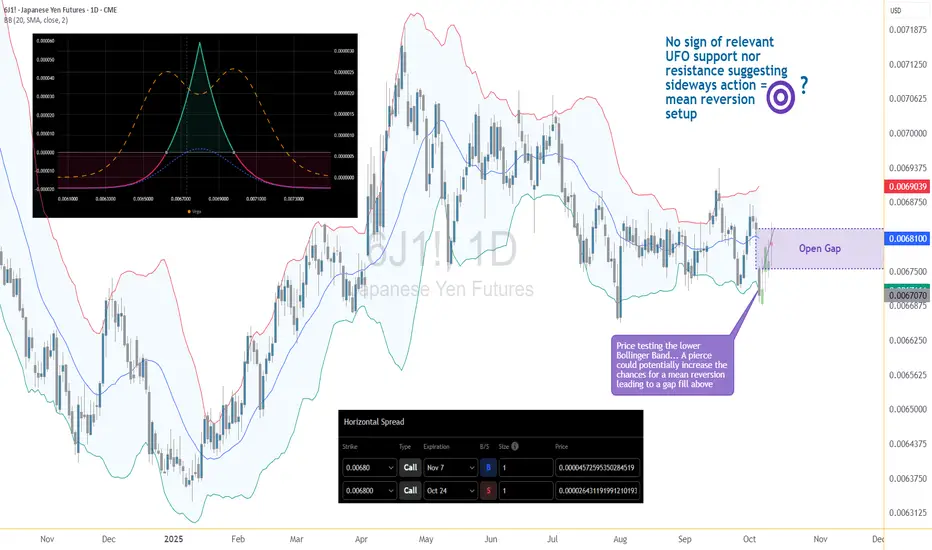
When the Yen Fell Out of Bed — And Time Picked It Up1. Yen Drama at the Open 🎭
The Japanese Yen Futures (6J) woke up after the weekend and immediately faceplanted into the lower Bollinger Band®. Big gap, lots of noise — the classic “what just happened?” moment.
Now, that gap around 0.0068 might just invite a mean reversion, because markets love to clean up after their weekend messes. Instead of chasing direction, we’ll let time do the heavy lifting.
2. The Strategy — A Time-Based Power Nap 😴
We’re running a Horizontal Call Spread (Calendar Spread) — same strike, different expiration dates:
Buy Nov 7 Call @ 0.00680
Sell Oct 24 Call @ 0.00680
You’re basically saying: “Hey, Yen, take your time — but drift a little upward, okay?”
If price chills near 0.0068, theta decay works for us. If it crashes again, we lose just our debit. Simple, elegant, zen.
3. Quick Specs (Because You’re Smart) 💡
Contract size: 12,500,000 Yen
Tick value: $6.25 (0.0000005)
Margin: ≈ $2,800 (outright futures)
Calendar Spread Risk = $237.50 debit
Setup target: gap-fill near 0.0068+
Risk is capped, reward potential roughly 3:1, and all you need is a calm market — not a hero move.
4. The Trader’s Zen Moment 🧘
This setup wins if price stabilizes and time passes — that’s it.
You’re not fighting the market; you’re getting paid for waiting.
While others panic, you’re sipping tea, letting theta do the work.
5. Takeaway 🍵
Gaps often fill.
Time spreads love calm markets.
Less stress, more logic.
Sometimes, the best move in trading is to stop anticipating — and start aging gracefully with your positions.
Want More Depth?
If you’d like to go deeper into the building blocks of trading, check out our From Mystery to Mastery trilogy, three cornerstone articles that complement this one:
🔗 From Mystery to Mastery: Trading Essentials
🔗 From Mystery to Mastery: Futures Explained
🔗 From Mystery to Mastery: Options Explained
When charting futures, the data provided could be delayed. Traders working with the ticker symbols discussed in this idea may prefer to use CME Group real-time data plan on TradingView: www.tradingview.com - This consideration is particularly important for shorter-term traders, whereas it may be less critical for those focused on longer-term trading strategies.
General Disclaimer:
The trade ideas presented herein are solely for illustrative purposes forming a part of a case study intended to demonstrate key principles in risk management within the context of the specific market scenarios discussed. These ideas are not to be interpreted as investment recommendations or financial advice. They do not endorse or promote any specific trading strategies, financial products, or services. The information provided is based on data believed to be reliable; however, its accuracy or completeness cannot be guaranteed. Trading in financial markets involves risks, including the potential loss of principal. Each individual should conduct their own research and consult with professional financial advisors before making any investment decisions. The author or publisher of this content bears no responsibility for any actions taken based on the information provided or for any resultant financial or other losses.

Options Blueprint Series [Advanced]: Gap Fill Time Spread Play1. The Market Context — Yen’s Weekend Gap and Mean Reversion Setup
The Japanese Yen futures (6J) reopened after the weekend with an aggressive downside gap, immediately catching the eye of volatility traders. Gaps of this nature are often emotional reactions to global macro news or overnight FX shifts — yet, when structural levels like the Bollinger Band lower boundary are involved, traders begin to anticipate a mean reversion rather than continued momentum.
This is exactly what we see on 6J:
Price plunged into the lower Bollinger Band, finding temporary balance near 0.0067+, while the middle band — representing the 20-period mean — sits around 0.0068+. The gap above remains open, and that area coincides with the Bollinger mean, creating a convergence between technical equilibrium and market memory.
Historically, the Yen tends to exhibit mean reversion behavior after outsized weekend gaps, as liquidity normalizes. That statistical tendency does not guarantee results, but it provides the foundation for a non-directional strategy applied with a slight directional bias — exactly where options on futures can shine.
2. Strategy Rationale — A Non-Directional Tool Used Directionally
Instead of a pure directional play (like buying calls), we opt for a Horizontal Call Spread — also known as a Calendar Spread or Time Spread — positioned around the 0.00680 strike. This structure allows us to express a view on time and volatility, rather than raw price movement.
Objective: capture a modest recovery or stabilization near 0.0068
Approach: profit from time decay and implied volatility behavior as the front option (short leg) loses value faster than the back month (long leg)
Outcome: defined risk, limited exposure to violent swings, and a smoother equity curve
In essence, we’re using a non-directional strategy (time-based) in a slightly directional context (mean reversion target) — a powerful way to let the clock, not the market, do most of the work.
3. Constructing the 6J Horizontal Call Spread
Let’s break it down with specific contracts:
Buy Nov 7 Call (0.00680 strike)
Sell Oct 24 Call (0.00680 strike)
This combination forms a calendar spread, where both options share the same strike but different expirations. The trade is initiated for a net debit, meaning we pay a small premium upfront for the position.
Mechanics
As time passes, the shorter-dated Oct 24 call decays faster.
If price drifts toward the 0.0068 area by the front expiry, the short leg expires near-the-money (or worthless), while the back-month call retains time value.
The spread expands — producing the ideal outcome.
The position benefits from stabilization, controlled volatility, and time decay alignment — instead of needing a directional surge.
Greeks behave in a nuanced way:
Theta: positive near the target zone
Vega: long volatility — the position gains if implied volatility rises in the back month
Delta: small positive exposure (mild bullish tilt)
That’s the “slightly directional” essence of this setup — time-sensitive, but gently leaning toward a gap-fill move.
4. Chart Perspective — The Technical Catalyst
The Bollinger Bands® tell the story clearly.
Lower band: 0.00672 → recent test zone
Mean (20-period average): 0.00681 → target
Upper band: 0.00690 → secondary resistance
The weekend gap remains unfilled, overlapping perfectly with the Bollinger mean.
Should price gravitate back toward equilibrium, the spread reaches its best reward zone as Oct 24 time decay accelerates.
5. Risk Management — Structuring Control, Not Hope
Every options trade begins with a cost — the net debit — which defines maximum risk. This makes the horizontal spread particularly appealing in uncertain environments.
Here’s the structured approach:
Entry zone: 0.0067+ area or below the lower Bollinger Band
Target zone: 0.0068+ (Bollinger mean & partial gap fill)
Stop: below 0.0066575 (recent intraday swing), or no stop at all since the options strategy provides a limited risk natively.
That defines a maximum reward-to-risk ratio of roughly 3:1 when measured against time decay and expected mean reversion distance.
It’s also crucial to track macro catalysts. The Yen can react sharply to U.S. yields or Bank of Japan policy headlines. Avoid holding this position through major FX events if volatility spikes uncontrollably — horizontal spreads work best in stable-to-moderate volatility environments.
Lastly, avoid scaling without liquidity awareness. 6J options are institutionally liquid, but ensure bid–ask stability during execution.
6. CME Context — Contract Specs
Understanding contract size and margin requirements is essential before structuring any options-on-futures strategy.
Contract size: 12,500,000 Japanese Yen
Minimum tick: 0.0000005 USD per JPY
Tick value: $6.25 per contract
Trading hours: Nearly 24-hour access Sunday–Friday
As of recent CME data, the initial margin for the standard 6J futures contract is around $2,800, though this varies with volatility. Traders using options on futures generally post the premium paid as margin (for debit spreads), which in this case is $237.5 (0.000019/0.0000005 x $6.25).
7. Risk, Reward & Realistic Expectations
The goal here is not to “predict” a direction — it’s to position intelligently around time.
A well-constructed calendar spread lets traders participate in short-term stabilization moves with predefined exposure.
If 6J consolidates and slowly lifts toward 0.0068:
The short Oct call decays,
The long Nov retains premium,
The spread widens — success.
If the Yen collapses further or volatility implodes across the curve, losses remain contained to the initial debit — no margin calls, no open-ended risk.
For advanced traders, layering such spreads across correlated expirations can create calendar ladders, offering continuous time exposure while recycling theta — but that’s a topic for another Blueprint.
8. Key Takeaways
Directional calendar spreads can be powerful after emotional gaps.
6J’s gap down plus Bollinger reversion potential creates an interesting time-based setup.
Using non-directional tools directionally provides precision control over risk and exposure.
Proper risk management defines the edge — not prediction accuracy.
This approach emphasizes professional-grade thinking: controlling variables (time, volatility, strike) rather than chasing price movement.
When charting futures, the data provided could be delayed. Traders working with the ticker symbols discussed in this idea may prefer to use CME Group real-time data plan on TradingView: www.tradingview.com - This consideration is particularly important for shorter-term traders, whereas it may be less critical for those focused on longer-term trading strategies.
General Disclaimer:
The trade ideas presented herein are solely for illustrative purposes forming a part of a case study intended to demonstrate key principles in risk management within the context of the specific market scenarios discussed. These ideas are not to be interpreted as investment recommendations or financial advice. They do not endorse or promote any specific trading strategies, financial products, or services. The information provided is based on data believed to be reliable; however, its accuracy or completeness cannot be guaranteed. Trading in financial markets involves risks, including the potential loss of principal. Each individual should conduct their own research and consult with professional financial advisors before making any investment decisions. The author or publisher of this content bears no responsibility for any actions taken based on the information provided or for any resultant financial or other losses.
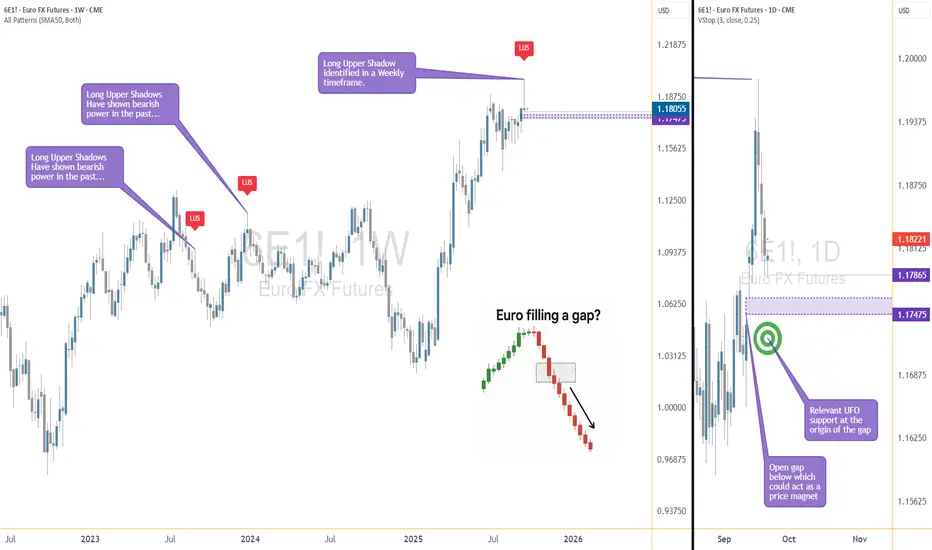
Gap-Fill Watch: Euro FX Futures React to Weekly RejectionIntroduction
When analyzing futures markets, one of the most compelling signals arises when higher timeframe candlestick rejection aligns with lower timeframe price imbalances. That is exactly what we see in Euro FX Futures (6E, M6E). On the weekly chart, long upper shadows (LUS) have historically marked turning points, reflecting exhaustion of bullish pressure. On the daily chart, an open gap below current price offers a potential magnetic pull. Together, these elements provide a textbook technical case study of how price can align across timeframes.
This article explores the educational insights behind candlestick rejection and gap mechanics, then applies them to a concrete trading scenario in 6E and its micro equivalent, M6E.
Weekly Chart: The Long Upper Shadow (LUS)
Long Upper Shadows appear when a market tests higher levels but fails to sustain them, leaving sellers in control by the close. They are one of the clearest visual expressions of rejection.
In Euro FX Futures, past long upper shadows have preceded significant bearish moves. Each instance reflects an imbalance where buyers were unable to absorb selling pressure at higher prices. The most recent weekly candlestick shows another long upper shadow forming near resistance. For technically minded traders, this is an early warning sign of potential downside ahead.
Daily Chart: The Open Gap Below Price
Price gaps occur when markets open significantly away from the prior session’s close. In futures, gaps often act like magnets—price tends to revisit them over time as liquidity seeks balance.
Currently, Euro FX Futures show an unfilled gap just below the market. Historically, such gaps in 6E have attracted price action, especially when combined with bearish rejection signals from higher timeframes. The combination of a weekly LUS above and a daily gap below paints a picture of imbalance: rejection at the highs, unfinished business at the lows.
Trade Setup
A structured trade idea emerges from this technical alignment:
Entry condition: Short position if 6E breaks below the prior day’s low at 1.17865. This ensures price is moving in line with bearish continuation before entry.
Target: 1.17475, the origin of the open gap. This is where the “magnet effect” is expected to complete.
Stop-loss: 1.18090, derived from a 2-day ATR calculation and adjusted to 25%. This keeps risk tight but accounts for minor noise.
Reward-to-Risk Ratio: With entry near 1.17865, risk is around 22 ticks while potential reward is about 39 ticks, yielding a favorable R:R of almost 2:1.
Risk caveat: Right below the gap origin lies a UFO support area. This means price may stall or reverse after the gap is filled. Being conservative with the target is wise—seeking deeper downside could run into structural support.
Contract Specs and Margin Notes
Understanding the contract structure is vital when applying risk management.
o Euro FX Futures (6E):
Contract size = €125,000
Tick size = 0.00005 USD per euro = $6.25 per tick
Initial margin (approximate, varies daily): ~$2,500–$3,000
o Micro EUR/USD Futures (M6E):
Contract size = €12,500 (1/10th of 6E)
Tick size = 0.0001 USD per euro = $1.25 per tick
Initial margin (approximate, varies daily): ~$300–$400
Application: Traders with smaller accounts can use M6E to size positions more precisely, while larger participants may choose 6E for liquidity. Micros provide flexibility to scale in/out of trades while maintaining strict risk per trade.
Risk Management Essentials
Risk management is not about avoiding losses—it is about ensuring that any loss remains controlled relative to potential reward. This trade idea highlights three core principles:
Stop placement by ATR: Volatility-based stops adjust naturally to current market conditions. Using 25% of a 2-day ATR prevents overexposure while respecting noise.
Position sizing: Traders should calculate how many contracts (6E or M6E) align with their personal risk tolerance.
Target discipline: While tempting to aim lower than the gap origin, technical evidence suggests price may encounter support there. Conservative targeting avoids overstaying a move.
Educational Takeaway
This setup demonstrates the power of multi-timeframe confluence. A weekly rejection signal provides context, while a daily gap gives tactical direction. Traders often gain an edge when higher timeframe sentiment (bearish rejection) aligns with lower timeframe imbalances (gap fill).
For students of price action, this is a reminder that candlestick patterns should never be taken in isolation. Instead, they should be validated by market structure, liquidity imbalances, or other confirming signals.
Conclusion
Euro FX Futures present a case study in how weekly rejection and daily gaps can combine to create a structured opportunity. While no outcome is certain, the confluence of signals here underscores the educational value of analyzing shadows and gaps together.
Traders can study this setup not only as a potential trade but also as a lesson in disciplined multi-timeframe analysis.
When charting futures, the data provided could be delayed. Traders working with the ticker symbols discussed in this idea may prefer to use CME Group real-time data plan on TradingView: www.tradingview.com - This consideration is particularly important for shorter-term traders, whereas it may be less critical for those focused on longer-term trading strategies.
General Disclaimer:
The trade ideas presented herein are solely for illustrative purposes forming a part of a case study intended to demonstrate key principles in risk management within the context of the specific market scenarios discussed. These ideas are not to be interpreted as investment recommendations or financial advice. They do not endorse or promote any specific trading strategies, financial products, or services. The information provided is based on data believed to be reliable; however, its accuracy or completeness cannot be guaranteed. Trading in financial markets involves risks, including the potential loss of principal. Each individual should conduct their own research and consult with professional financial advisors before making any investment decisions. The author or publisher of this content bears no responsibility for any actions taken based on the information provided or for any resultant financial or other losses.
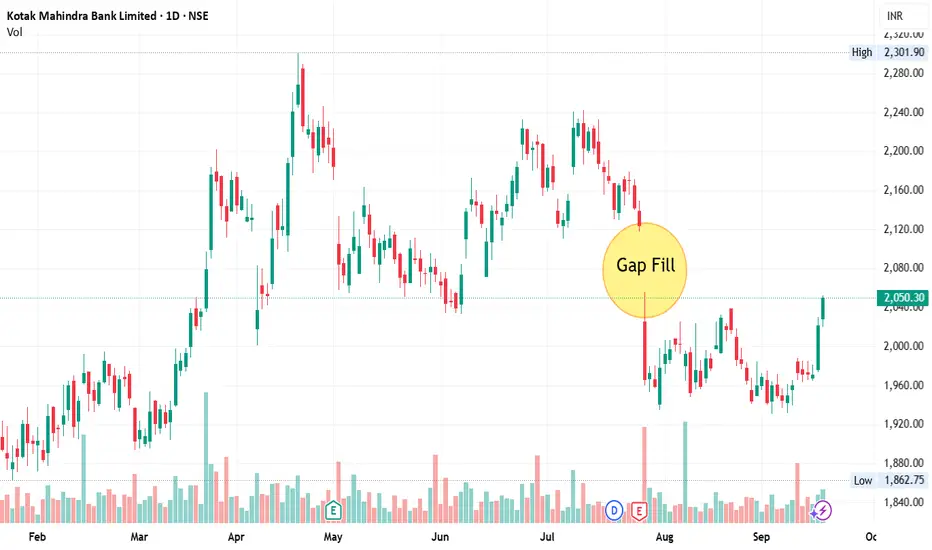
Gap Fill - Kotak Mahindra Bank📊 Script: KOTAKBANK
Key highlights: 💡⚡
📈 Script will fill gap in near future, we may see some good rally.
📈 One can go for Swing Trade.
⏱️ C.M.P 📑💰- 2050
🟢 Target 🎯🏆 - 2176
⚠️ Stoploss ☠️🚫 - 1991
⚠️ Important: Always maintain your Risk & Reward Ratio.
✅Like and follow to never miss a new idea!✅
Disclaimer: I am not SEBI Registered Advisor. My posts are purely for training and educational purposes.
Eat🍜 Sleep😴 TradingView📈 Repeat 🔁
Happy learning with trading. Cheers!🥂
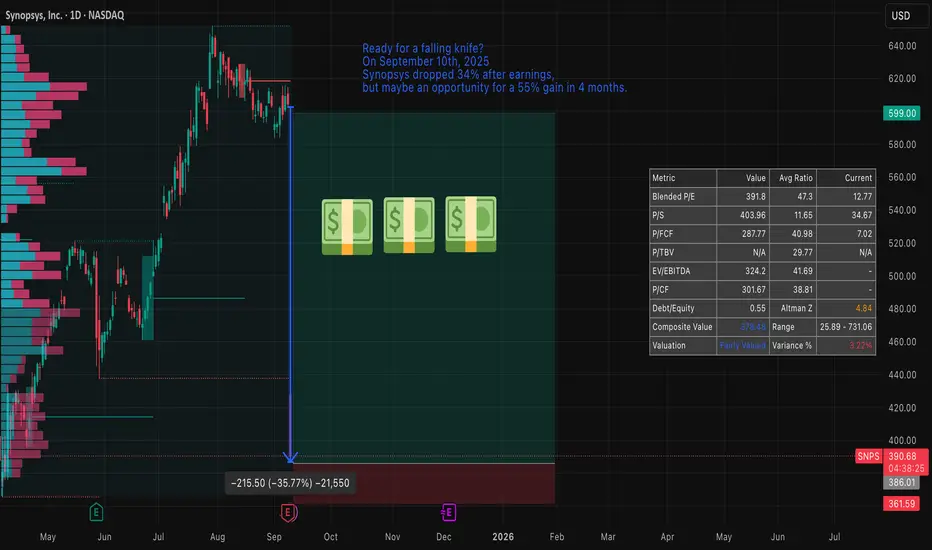
Synopsys — a sharp sell-off, risky entry and clear opportunitySynopsys plunged roughly 30–34% on 10 September 2025, wiping out a large chunk of market value after quarterly results missed expectations and guidance was cut. That kind of move often feels like a “falling knife”: attractive on paper, dangerous in practice.
Price action and technical context
The stock has gapped lower and left a sizeable down-gap to fill. From a technical viewpoint the setup resembles a fast, impulsive sell-off inside a broader downtrend established since the spring; price is now testing levels that were former support in April 2025. Short-term momentum indicators show oversold readings, but volatility is elevated and trend-following measures still favour the downside until a reliable base is formed.
Key technical reference points to watch:
Gap zone/topside resistance: around the pre-drop range near the mid-$600s.
Immediate support / stop placement: just below the April 2025 lows (your stated stop).
Possible gap-fill target: if the market rotates back, reclaiming the gap by January 2026 implies roughly a ~55% upside from current depressed levels (as you noted).
Fundamentals and why this remains an opportunity
Despite the headline shock, Synopsys’s underlying business remains high-quality:
Market-leading positions in EDA tools and IP libraries.
Strong, recurring revenue mix (software subscriptions and maintenance).
Long secular tailwinds from AI, advanced node design and chiplet modularity.
Valuation has re-rated materially after the drop — the company is no longer priced at the frothy multiples of earlier in the cycle. Analysts have revised estimates downward but many still target stock levels clustered around $600, reflecting belief in recovery by late 2025 / early 2026.
Options flow and timing
There is notable open interest concentration in both calls and puts around the $600 strike with expiries in December 2025 and January 2026. That concentration suggests the market expects meaningful activity/interest around that level into the winter and gives a window where a gap-fill or relief rally could materialize before January expiries.
Risk management and trade plan
Trade type: speculative rebound / gap-fill play, not a buy-and-forget investment.
Target: gap-fill / recovery toward pre-drop levels by January 2026 — roughly +55% potential from current depressed price (per your scenario).
Stop: just below April 2025 lows (limits downside if the downtrend resumes).
Position sizing: small relative to portfolio — treat as a high-volatility, event-driven trade.
Alternatives: consider defined-risk option structures (e.g., debit spreads) to cap downside while retaining upside exposure to a gap fill.
Catalysts to monitor
Any updates to guidance or profitability from Synopsys management.
China demand/FX developments and IP licensing commentary.
Options positioning into December 2025 / January 2026 expiries.
Broader semiconductor capital spending and AI-related design win announcements.
Technical indicators to watch
200DMA and April lows (support/resistance anchors).
RSI(14) and MACD for bullish divergence and momentum confirmation.
Volume on any recovery day — strong volume on up days increases odds of a sustained bounce.
Bottom line
This is a high-risk, high-reward setup: a classic “ falling knife ” that can be dangerous if you’re early, but presents a credible opportunity because Synopsys’s fundamentals remain solid, valuation is more attractive, and market positioning (options interest near $600) favors a potential recovery window through January 2026. Use tight risk controls (stop under April lows) and consider defined-risk option plays if you prefer limited downside.
Bitcoin CME Closing Price: The Key to Next Week’s TrendIn this video I cover the CME closing price and go through a plan which includes a gap to the upside and a short squeeze before gravitating to the downside for lower targets .
I also give a bias for higher prices if the VAH is claimed .
This idea is modelled on the daily time frame and can play out over the course of the following week or more .
I also look at the Eth/Btc pair and the Btc dominance chart and marry whats happening on those charts with this idea .
When looking at BTC I use order flow software to further support my bias and the confluences I present in the chart.
If you have any questions then leave them below .
Support my work with a boost and Safe trading

UNH bear flag and gapsUNH has been top of my radar for a bullish reversal. With 2 major gaps to fill after the epic collapse in share price this ticker has a lot of potential. Currently sitting in what appears to be a bear flag, it is holding above the monthly 200EMA (overlayed on this 4H chart). However price recently rejected off the daily 21ema (overlayed on this 4H chart) and if the bear flag is any indicator price may head lower for another liquidity sweep before the inevitable bullish reversal.
A side note: insiders have been buying $millions since the share price collapsed which is always a good indicator of what's to come.

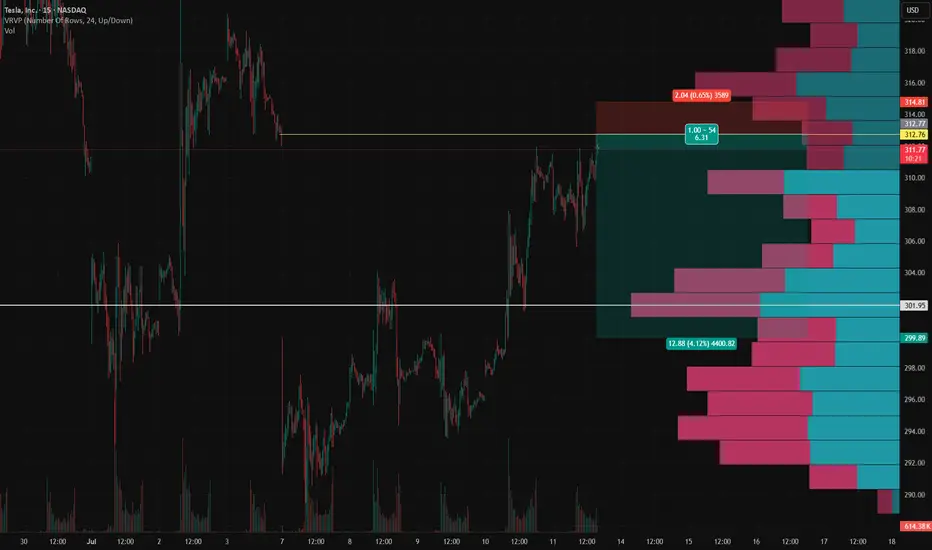
TSLA Short Setup – Fading the July 7 Gap FillTSLA Short Setup – Fading the July 7 Gap Fill 📉
This short idea on TSLA builds off a key gap fill from Monday, July 7 , combined with a strong local volume profile and risk-reward alignment on the 15-minute chart.
Entry: $312.76
Stop Loss: $314.81 (above gap resistance and local high)
Target: $299.89 (gap base and volume shelf)
RR: ~6.3R
Why I'm shorting here:
TSLA has just filled the July 7 gap , which often acts as a technical resistance zone on retest.
Price stalled right as it completed the fill — with visible hesitation and selling pressure stepping in.
VRVP shows low liquidity above, suggesting diminished reward for upside continuation.
Below, there's a clean volume shelf around $294–$300 that could attract price if weakness confirms.
Trade Logic:
This is a classic fade-the-gap-fill setup, targeting the lower edge of the volume cluster for a potential bounce or reversal zone.
As always: size accordingly, stick to the stop, and don’t chase if the entry’s already gone.
Thoughts? Anyone else watching this gap level?
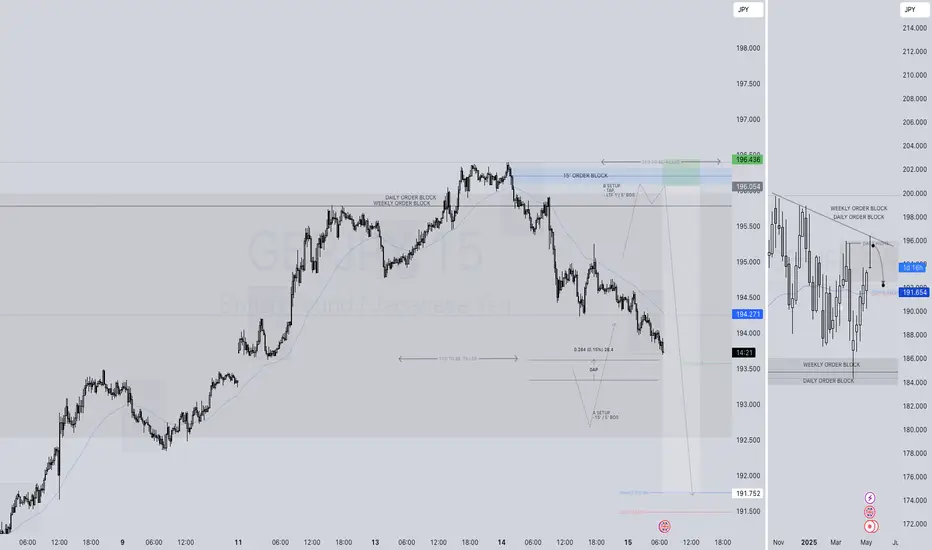
GBPJPY SHORT FORECAST Q2 W20 D15 Y25GBPJPY SHORT FORECAST Q2 W20 D15 Y25
Professional Risk Managers👋
Welcome back to another FRGNT chart update📈
Diving into some Forex setups using predominantly higher time frame order blocks alongside confirmation breaks of structure.
Let’s see what price action is telling us today!
💡Here are some trade confluences📝
✅Weekly order block rejection
✅Daily order block rejection
✅Intraday 15' order blocks
✅Gap fill
🔑 Remember, to participate in trading comes always with a degree of risk, therefore as professional risk managers it remains vital that we stick to our risk management plan as well as our trading strategies.
📈The rest, we leave to the balance of probabilities.
💡Fail to plan. Plan to fail.
🏆It has always been that simple.
❤️Good luck with your trading journey, I shall see you at the very top.
🎯Trade consistent, FRGNT X
Ethereum - CME Gap fill before going up ?Ethereum has formed a classic CME Gap between $1,707 and $1,765, following a strong breakout. CME gaps, especially over the weekend, are statistically likely to be filled before the next major move.
We’re watching for a retest of this gap zone with a potential bounce at the lower boundary, creating a solid long entry opportunity.
Entry: 1,710–1,725 (inside the CME gap)
TP1: 1760
TP2: 1800
TP3: 1900
SL: 1,667 (below gap & invalidation of bullish structure)
Like and support us for more such idea.
Cheers
GreenCrypto

Bitcoin - CME Gap fill before going up ?Bitcoin CME Futures have formed a clear CME Gap in the $91,600 – $93,400 zone (highlighted in blue). Historically, these gaps tend to get filled before the price resumes its trend.
Price may dip into the gap zone (91,800–93,400) to fill the imbalance.
We have a entry around the lower part of the gap ($91,800–$92,200).
Stop loss: Below $91,500 to invalidate the setup.
After the gap fill, we can expected strong bullish continuation
Entry: 91600
TP1: 92800
TP2: 93500
TP3: 94500
SL Below 90500
Like and support for more ideas.
Cheers
GreenCrypto
