An Exhaustive Analysis of Financial Market GapsAn Exhaustive Analysis of Financial Market Gaps: Mechanics, Psychology, and Advanced Trading Applications
● Part I: The Foundational Architecture of Price Gaps
The study of financial markets is, in essence, the study of price action. While much of this action is continuous, with transactions creating a seamless flow of data, there are moments of abrupt discontinuity that appear on price charts as voids or empty spaces. These phenomena, known as price gaps, are not mere charting curiosities; they are powerful signals that reveal profound shifts in the equilibrium between supply and demand, offering a unique window into market psychology and future price direction. Understanding the architecture of these gaps—their definition, their classification, and the complex web of factors that cause their formation—is a prerequisite for any sophisticated market participant seeking to interpret and navigate market dynamics effectively.
• Section 1: Defining the Phenomenon
At its most fundamental level, a price gap represents a range of prices at which no trades have occurred. This visual discontinuity on a price chart signifies a sudden and significant jump in an asset's price, where the opening price of one trading period is markedly different from the closing price of the preceding period.
• 1.1. The Anatomy of a Price Gap: Visual and Technical Definitions
A price gap, also referred to as a "window" in Japanese Candlestick charting, is a term used to describe a discontinuation in a price chart. Visually, it appears as an empty space between two consecutive trading periods, most commonly observed on daily bar or candlestick charts. The formation of a gap indicates that the market's perception of an asset's value has changed so dramatically that it bypasses a range of prices entirely.
• 1.2. A Taxonomy of Gap Formations: Full vs. Partial Gaps
Not all gaps are created equal in their structure or implications. This distinction gives rise to two main categories:
Partial Gap: Occurs when the opening price of the current session is higher or lower than the previous session's close, but still falls within the trading range (high and low) of that previous session.
Full Gap: Occurs when the opening price is completely outside the prior day's entire trading range.
• Section 2: The Genesis of Gaps: Causal Factors and Market Dynamics
Price gaps are the tangible result of a confluence of fundamental, technical, and market microstructure factors.
• 2.1. Fundamental Catalysts
Corporate Earnings Reports: Quarterly earnings reports are the most regular and potent catalysts for individual stocks.
Major News Events: Mergers, acquisitions, product launches, or regulatory changes.
Macroeconomic Data: GDP figures, CPI inflation reports, and interest rate decisions.
• 2.2. Technical Precursors
Support and Resistance Breakouts: A gap through a well-established level is a particularly powerful technical event.
Chart Pattern Completion: Gaps frequently serve as the confirmation signal for patterns like the cup and handle or head and shoulders.
Algorithmic Trading: Automated systems can exacerbate gaps when specific technical conditions are met.
● Part II: A Comprehensive Typology of Market Gaps
The ability to correctly classify a price gap is the most critical step in its analysis. Different types of gaps have vastly different implications for future price action.
• Section 3: The Four Archetypal Gaps: A Deep Dive
• 3.1. The Common Gap (or Trading/Area Gap)
Common Gaps are typically small in magnitude and characterized by normal or below-average trading volume. They usually appear within a sideways trading range and tend to be "filled" relatively quickly, often within a few days.
• 3.2. The Breakaway Gap (or Power Gap)
Signifies a decisive and forceful end to a period of consolidation.
Volume: Must be accompanied by a massive surge in trading volume (ideally 50% or more above the 50-day average).
Significance: Low probability of being filled in the near term; the gap area often transforms into a new support or resistance level.
• 3.3. The Runaway Gap (or Continuation/Measuring Gap)
Occurs in the middle of a well-established trend and signals that the prevailing momentum is strong. It is often driven by "FOMO" (Fear of Missing Out).
• 3.4. The Exhaustion Gap
Occurs near the end of a mature trend. The single most important feature is climactic trading volume . This represents the peak of emotional intensity, often followed by a rapid reversal and a high likelihood of the gap being filled.
• Section 4: Advanced and Specialized Gap Patterns
• 4.1. The Island Reversal
A distinctive and highly reliable chart pattern where a cluster of price bars is isolated by gaps on both sides. It represents a dramatic shift in market sentiment and is one of the strongest reversal signals in technical analysis.
• 4.2. Fair Value Gaps (FVG) and Liquidity Voids
An institutional perspective identifying market inefficiencies. An FVG is a three-candle pattern where the wick of the first and third candle do not overlap. Unlike breakaway gaps, FVGs are viewed as "magnets" that price will likely return to in order to rebalance liquidity.
● Part III: The Human Element and Empirical Realities
• Section 5: The Behavioral Science of Gaps
Irrational Exuberance: Drives bullish exhaustion gaps where optimism overrides fundamentals.
Panic and Capitulation: Drives downside exhaustion gaps at the end of a downtrend.
Herd Behavior: Amplifies price shocks as traders follow the collective crowd, often leading to initial overreactions.
"Breakaway, Runaway, and Exhaustion gaps are foundational technical formations rooted in crowd psychology and trend lifecycle stages. Conversely, the Fair Value Gap (FVG) is an institutional metric designed to identify price inefficiencies. While analytically distinct, these frameworks often converge within the same price action event, providing a dual perspective on market dynamics."
• Section 6: Statistical Analysis of the "Gap Fill"
The popular adage that "all gaps get filled" is an oversimplification.
Common/Exhaustion Gaps: Fill probability of 75-90%.
Breakaway Gaps: Fill probability of 35-65%.
Volume Impact: Gaps on low volume are 85% likely to fill within two sessions.
● Part IV: Application and Strategy
• Section 7: Strategic Frameworks for Gap Trading
Momentum-Based ("Gap and Go"): Trading with the gap. Best for Breakaway and Runaway gaps.
Mean-Reversion ("Fading the Gap"): Trading against the gap. Best for Common and Exhaustion gaps.
• Section 8: The Indispensable Role of Confirmation
Volume Spread Analysis: High volume validates breakaway gaps; climactic volume confirms exhaustion.
Momentum Oscillators (RSI, MACD): Identify divergences that suggest a gap might be exhausting rather than continuing.
Volatility Indicators (ATR): Used to set intelligent stop-losses based on the asset's specific character.
• Section 9: Advanced Risk Management
The single greatest danger in holding positions overnight is Gap Risk—the risk that price opens far beyond a pre-set stop-loss, causing significant slippage.
To manage this risk:
Avoid known catalysts (earnings).
Reduce position size during high-volatility weeks.
Use protective options (hedging).
● Part V: A Cross-Market Perspective
• Section 10: Comparative Gap Analysis Across Asset Classes
Equities: Daily gaps due to session closures; earnings are the primary driver.
Forex: Weekday gaps are rare; weekend gaps are the primary focus.
Commodities: Sensitive to supply shocks and interplay between global exchanges (CME vs LME).
Cryptocurrencies: Spot markets are 24/7 (no gaps), but CME Bitcoin Futures Gaps act as powerful price magnets with high fill rates.
● Part VI: Synthesis and Concluding Insights
• Section 11: Integrating Gap Analysis into a Holistic Market Framework
Effective gap analysis requires that:
Diagnosis Precedes Treatment: Classify the gap before selecting a strategy.
Volume is the Arbiter of Truth: It is the physical manifestation of market conviction.
Analysis is Probabilistic: There are no certainties, only shifts in likelihood based on context.
The study of price gaps remains one of the most compelling disciplines in financial markets, offering a record of collective emotion and a lens into market discovery.
Gaps

CHF/JPY AnalysisCHFJPY (4-hour, FXCM) TradingView Analysis:
Current Price: 193.101
Open: 192.991
High: 193.243
Low: 192.937
Change: +0.110 (+0.06%)
Recent Trend: Modest upward movement in the current 4-hour candle, with the price near today's high, indicating bullish momentum.
Volatility: The high-low range is relatively narrow, signaling low immediate volatility.
Potential Signals:
A price break above 193.243 could continue the bullish trend.
Failure to stay above 193.000 might signal a short-term correction.
Target Zones:
Blue Lines: Represent key target zones drawn on the chart. These zones are based on the open gap area highlighted with a circle, suggesting areas where price might react or aim to fill the gap.
Recommendation: Watch for a breakout above or below the current range and monitor the blue target zones for increased price action or reversals.

GBPJPY D1 TRADE IDEA FOR 20TH OCT, 2025.The GJ market is still overall on an uptrend and currently in and out of range which seems price is trying to retrace downwards a bit to fill the Gap Area indicated below.
Now lets talk a little bit about Market Gaps...
One of the regular behaviour of the markets that happens is that usually after a sessional jump(GAPS) most times which is created after the weekend of a past trading week, the markets usually most times create a Gap because of the lack of trading activity over the weekend that create a void in prices, so in other for the market to create a balance before the market continues in its determined direction? it usually as always comes back to fill Gaps of inactivity before it resumes on a balanced trajectory.
this is why in most cases holding trades over the weekend isn't advisable to avoid overnight fees, swaps and drawdowns in capital or profits when holding a position especially when under-capitalized because these kinds of Gaps or Jumps in price happen due to fresh information that comes into the market before a new session begins.

BTC CME / FVG levelsHi,
Here are some 4 hour FVG / CME levels I found on BTC, just to have an overview over the levels in case of bull, in case of bear, etc..
Price don't have to respect these levels, but usually does, in accordance with ICT market maker / smart money algorithm theory.
Have a great day, and good luck trading!

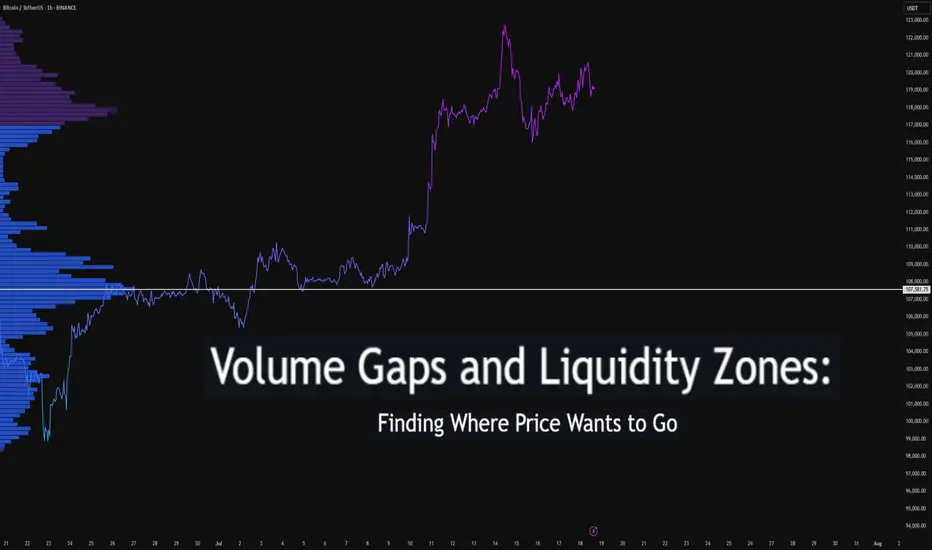
Volume Gaps and Liquidity Zones: Finding Where Price Wants to GoDifficulty: 🐳🐳🐳🐋🐋 (Intermediate+)
This article is best suited for traders familiar with volume profile, liquidity concepts, and price structure. It blends practical trading setups with deeper insights into how price seeks inefficiency and liquidity.
🔵 INTRODUCTION
Ever wonder why price suddenly accelerates toward a level — like it's being magnetized? It’s not magic. It’s liquidity . Markets move toward areas where orders are easiest to fill, and they often avoid areas with little interest.
In this article, you’ll learn how to identify volume gaps and liquidity zones using volume profiles and price action. These tools help you anticipate where price wants to go next — before it gets there.
🔵 WHAT ARE VOLUME GAPS?
A volume gap is a price region with unusually low traded volume . When price enters these areas, it often moves quickly — there’s less resistance.
Think of a volume gap as a thin patch of ice on a frozen lake. Once the market steps on it, it slides across rapidly.
Volume gaps usually show up on:
Volume Profile
Fixed Range Volume tools
Session or custom volume zones
They’re often created during impulsive moves or news events — when price skips levels without building interest.
🔵 WHAT ARE LIQUIDITY ZONES?
Liquidity zones are price areas where a large number of orders are likely to be sitting — stop losses, limit entries, or liquidation levels.
These zones often form around:
Swing highs and lows
Order blocks or fair value gaps
Consolidation breakouts
Psychological round numbers
When price approaches these areas, volume often spikes as those orders get filled — causing sharp rejections or breakouts.
🔵 WHY THIS MATTERS TO TRADERS
Markets are driven by liquidity.
Price doesn’t just move randomly — it hunts liquidity, clears inefficiencies, and fills orders.
Your edge: By combining volume gaps (low resistance) with liquidity zones (target areas), you can forecast where price wants to go .
Volume gap = acceleration path
Liquidity zone = destination / reversal point
🔵 HOW TO TRADE THIS CONCEPT
1️⃣ Identify Volume Gaps
Use a visible range volume profile or session volume. Look for tall bars (high interest) and valleys (low interest).
2️⃣ Mark Liquidity Zones
Use swing highs/lows, OBs, or EQH/EQL (equal highs/lows). These are magnet areas for price.
3️⃣ Watch for Reactions
When price enters a gap, expect speed.
When it nears a liquidity zone, watch for:
Volume spike
Wick rejections
S/R flip or OB retest
🔵 EXAMPLE SCENARIO
A strong bearish move creates a volume gap between 103 000 – 96 000
Below 96 000 sits bullish order blocks — clear liquidity
Price enters the gap and slides fast toward 96 000
A wick forms as buyers step in, volume spikes — the reversal begins
That’s price filling inefficiency and tapping liquidity .
🔵 TIPS FOR ADVANCED TRADERS
Use higher timeframes (4H/1D) to define major gaps
Look for overlapping gaps across sessions (Asia → London → NY)
Align your trades with trend: gap-fills against trend are riskier
Add OB or VWAP as confirmation near liquidity zones
🔵 CONCLUSION
Understanding volume gaps and liquidity zones is like reading the market’s intention map . Instead of reacting, you start predicting. Instead of chasing, you’re waiting for price to come to your zone — with a plan.
Price always seeks balance and liquidity . Your job is to spot where those forces are hiding.
Have you ever traded a volume gap into liquidity? Share your setup below
Earnings HFT gapsThe gaps that form during earnings season on or the next day after the CEO reports the revenues and income for that past quarter are always HFT driven. The concern over the past 2 previous quarters was the fact that the High Frequency Trading Firms were incorporating Artificial Intelligence into their Algos to make automated trading decisions on the millisecond scale. These small lot orders fill the ques milliseconds ahead of the market open in the US and any huge quantity of ORDERS (not lot size) causes the computers of the public exchanges and market to gap up or gap down, often a huge gap.
This can be problematic for those of you who use Pre Earnings Runs to enter a stock in anticipation of a positive to excellent earnings report for this upcoming quarter.
The HFT algos had several major flaws in the programming that did the opposite: The AI triggered sell orders rather than buy order causing the stock price to gap down hugely on good earnings news.
Be mindful that normal gaps due to a corporate event are far more reliable and consistent.
When you trade during earnings season, be aware that there is still added risk of an AI making a mistake and causing the stock to gap and run down on good news.
It is important to calculate the risk factors until it is evident by the end of this earnings season that the errors within the AI programming have been corrected and that the AI will gap appropriately to the actual facts rather than misinterpreted information.

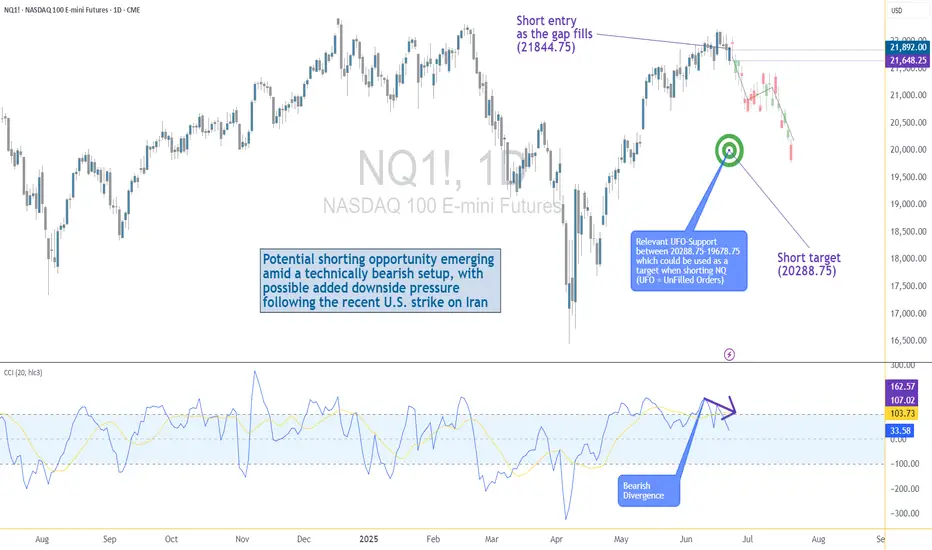
US–Iran Conflict Triggers a Potential Nasdaq Bearish Setup🟣 Geopolitical Flashpoint Meets Technical Confluence
The U.S. weekend airstrike on Iranian nuclear facilities has reignited geopolitical instability across the Middle East. While broader markets often absorb news cycles quickly, high-beta assets like Nasdaq futures (NQ) tend to react more dramatically—especially when uncertainty meets existing technical vulnerability.
Monday’s session opened with a notable gap to the downside, reflecting immediate risk-off sentiment among futures traders. While the initial drop is being retraced intraday, historical patterns suggest that such gap-fills can often serve as ideal shorting zones—particularly when other bearish signals confirm the narrative. The backdrop is clear: this is no ordinary Monday open.
🟣 Bearish Divergence on CCI Builds the Case
From a technical standpoint, the setup gains weight through a clear bearish divergence on the Commodity Channel Index (CCI) using a 20-period setting. While prices recently pushed higher, momentum failed to follow—an early indication that buyers may be running out of steam. This divergence appears just as price approaches the origin of Friday’s gap, a level that frequently acts as a resistance magnet in such contexts. This confluence of weakening momentum and overhead supply aligns perfectly with the geopolitical catalyst, offering traders a compelling argument for a potential reversal in the short term.
🟣 Gap Origin: The Line in the Sand
The origin of the gap sits at 21844.75, a price level now acting as potential resistance. As the market attempts to climb back toward this zone, the likelihood of encountering institutional selling pressure increases. Gap origins often represent unfinished business—zones where prior bullish control was suddenly interrupted. In this case, the added layer of global tension only strengthens the conviction that sellers may look to reassert dominance here. If price action stalls or rejects at this zone, it could become the pivot point for a swift move lower, especially with bearish momentum already flashing caution signals.
🟣 Trade Plan and Reward-to-Risk Breakdown
A potential short trade could be structured using 21844.75 as the entry point—precisely at the gap origin. A conservative stop placement would rest just above the most recent swing high at 22222.00, offering protection against a temporary squeeze. The downside target aligns with a prior UFO support area near 20288.75, where demand previously showed presence. This sets up a risk of 377.25 points versus a potential reward of 1556.00 points, resulting in a reward-to-risk ratio of 4.12:1. For traders seeking asymmetrical opportunity, this ratio stands out as a strong incentive to engage with discipline.
🟣 Futures Specs: Know What You’re Trading
Traders should be aware of contract specifics before engaging. The E-mini Nasdaq-100 Futures (NQ) represent $20 per point, with a minimum tick of 0.25 worth $5.00. Typical margin requirements hover around $31,000, depending on the broker.
For smaller accounts, the Micro Nasdaq-100 Futures (MNQ) offer 1/10th the exposure. Each point is worth $2, with a $0.50 tick value and much lower margins near $3,100.
🟣 Discipline First: Why Risk Management Matters
Volatility driven by geopolitical events can deliver fast gains—but just as easily, fast losses. That’s why stop-loss orders are non-negotiable. Without one, traders expose themselves to unlimited downside, especially in leveraged instruments like futures. Equally critical is the precision of entry and exit levels. Acting too early or too late—even by a few points—can compromise an otherwise solid trade. Always size positions according to your account, and never let emotion override logic. Risk management isn’t a side-note—it’s the foundation that separates professionals from those who simply speculate.
When charting futures, the data provided could be delayed. Traders working with the ticker symbols discussed in this idea may prefer to use CME Group real-time data plan on TradingView: www.tradingview.com - This consideration is particularly important for shorter-term traders, whereas it may be less critical for those focused on longer-term trading strategies.
General Disclaimer:
The trade ideas presented herein are solely for illustrative purposes forming a part of a case study intended to demonstrate key principles in risk management within the context of the specific market scenarios discussed. These ideas are not to be interpreted as investment recommendations or financial advice. They do not endorse or promote any specific trading strategies, financial products, or services. The information provided is based on data believed to be reliable; however, its accuracy or completeness cannot be guaranteed. Trading in financial markets involves risks, including the potential loss of principal. Each individual should conduct their own research and consult with professional financial advisors before making any investment decisions. The author or publisher of this content bears no responsibility for any actions taken based on the information provided or for any resultant financial or other losses.
USDJPY = Win. Finally? I have shit winrate, but at least this trade is "logical", and has followed the trading plan lol.
TRADING SPECS:
BIAS = DOWNTREND
NARRATIVE = 4HR BEARISH PD ARRAY(S/R FLIP+FVG)
CONTEXT = RESPECTED PREMIUM ARRAY + A Wave
ENTRY = SELL STOP ORDER @ A WAVE LOW (RUN ON LIQUIDITY). Nearly got SL'd. OPTIMAL ENTRY WOULD HAVE BEEN THE BEARISH FVG AFTER THE "4HR PREMIUM ARRAY REBALANCE" INSIDE CONTEXT AREA. THERE WAS A SHARP TURN IN THERE SOMEWHERE BUT I DIDN'T WAIT FOR THAT.
RISK MANAGEMENT = N/A(?) JUST LET TRADE PLAY OUT. BUT SL WAS INSIDE THE ORDERFLOW LEG(?)
Here's how it went:
1. Assessed Day Bias - price was downtrending. checked orderflow and candle science for this shit
2. Assessed Current Price "Intention" - price only does two things: seek liquidity, and rebalance fair value.
When I plotted my Key Levels, price was at a point where it was just done seeking liquidity(support + poc was swept) and it was reversing.
I see an S/R Flip + FVG area. If price goes here, that means price has rebalanced fair value.. so, logic dictates that it will reverse again to SEEK LIQUIDITY.
When I came back to this chart again, price has already rebalanced fair value, has respected the S/R Flip + FVG, and has started reversing down.
3. Picked Out a Target - I picked out something realistic. Here is where indicators/tools come in.
Instead of using my confluence mix(POC+FVG+OTE pd array) as entry points,
"I just used it as a target since... price has already rebalanced fair value at the higher TF, and it's already going down, so it's probably going to seek liquidity on the other side. It's most probable target before price may or may not do something else is the FVG+POC+OTE AREA."
My choice of liquidity category was the Previous Day Session nPOC. Along with the FVG and OTE, it was a strong "magnet", especially considering that price has finished seeking buy side liquidity and therefore the price's next target are the liquidities below.
Wow, this makes so much sense to me now.
Price always intend to bounce from opposite liquidities, from higher timeframe to lower timeframe... so...
4. Waited for PA that will Deliver Towards Target - I think my entry here was sloppy, the weakest part of this trade. But it made sense, and it still worked anyway.
I just found a sting candle down(the A wave) after tapping the (S/R Flip+FVG).. I set a sell stop limit on the exact low of that candle.
LOGIC was, if price pushed down below that sting, especially with a strong fvg, it would validate the RESPECT of the (SR FLIP+FVG), and it would continue going down(an invalidation of a long continuation idea)... probably to, again, seek liquidity below.
Reason why I think my entry was sloppy, is because I did not validate the trade idea first. I didn't wait for that sting candle to get "run on(liquidity)" first. I think in order to validate it, I would have waited for the sting to become a run on liquidity area first, and then a second bearish fvg candle close to confirm downtrend. It would have been too late and the profit would have been too small at that point.
5. Put SL at the Orderflow Leg Swing High - If price was really not intending to continue going up, it wouldn't have gone here, which it didn't. I nearly got stopped out, like the other trades I had on sunday and monday.
-------------
Here's the pattern that I keep seeing though, when price makes a valid HIGH(like in this case, the SRFLIP+FVG rebalance), price will attempt to go here atleast twice with a WICK, but will still make lower highs. Usually, those second and third wicks will form as if it's going to take the liquidities at those wicks, but it will just take out the CANDLE BODY HIGHS... So take note of these next time.
When price sweeps a higher timeframe FVG/LIQUIDITY, mark out the candle body closes as TARGET LIQUIDITIES, not the wicks. If a downtrend is valid, it will only take out the body close liquidities. I will make a diagram to help make this make sense lmfao.
-------------
I feel like a mad scientist at this point... endlessly trying to see the actual logic in the market. Not the probabilities of patterns playing out, but the CAUSES and EFFECTS.
I think I'm close to finding the pattern within the pattern... or the message hidden in the patterns(Arcane reference, anyone?).
But I think the two things I have found thanks to Arjo is...
"Price only does two things: 1. Seeking Liquidity 2. Rebalancing Fair Value
and Higher TF = Rebalancing Fair Value <-> Lower TF = Seeking Liquidity"
and
"The Higher the Timeframe, The Stronger the Timeframe"
Like... the market isn't random. I think these two things are the core principles of trading.
Because with these two ideas, you don't need a strategy. You need to UNDERSTAND this. And the strategy can be adapted to whatever you see on the chart.
You open EURUSD, and you see that price is on a downtrend, and it has recently rebalanced the bearish fair value gap on the 4HR? You know what price will do next. It will continue going down to seek liquidity below. So, with that information, what will you look for? How will you enter? Where will you set your entry point, your stoploss, and where is your target?
You open USDCAD, and you see that price is on an uptrend, it has already rebalanced fair value below, has made a bullish choch+FVG, and has respected that choch+FVG on a lower timeframe. You know it will seek buy side liquidity next. So how will you enter? Where will you place your stoploss? Where's your exit?
-------
Now, if only I can translate this knowledge into actual consistency in trading, I can finally make money.
But I guess doing the journal is great. I'm consistently at the 25-30% winrate. So with this understanding.. Maybe I can slowly push that winrate up over time.
I think mechanically, the trade entries i had a year ago and now was the same(choch+POC+FVG+OTE), but now I have the understanding of why it may work or why it won't work, and when do I apply it so I increase the odds of winning. So that's something.
Before, I didn't know why it did or did not work. But now, I know.
I can use this info moving forward to increase my odds.
-------
OH WAIT YEAH, IF I KNOW WHAT THE MARKET DOES AND WHY IT DOES WHAT IT DOES, THEN I WILL BE ABLE TO REFINE MY ENTRIES, BECAUSE NOW I KNOW WHY AND HOW I'M MAKING MY MISTAKES. HELL YEAH.
-------
I'm just not sure about whether I can stick to one entry strategy now, or if I should, or I won't trade something that looks doable under my principles... because I've studied everything, and it makes sense now. lmfao.
-------
if people are reading this(up to this point lol that was a long ash read), then thank you. Reply with your thoughts if ever.
Alright thanks bye

Two Daily Gaps attract market for pullbackAlthough S&P500 is within uptrend, recent days has left two clearly visible gaps behind. That means that it is highly possible that SPX will come back to cover those gaps in the near future, before it continue uptrend (if it will). Same picture at NDX chart with two 4H gaps.
I take this idea to apply to all markets including crypto. While chances to resume higher timeframe uptrend are valid for Bitcoin, Stock Indices will most probably influence it's short term price action.

SPY - A GAPTacular 2024And leaves a tiny one on today's open up top...Oops.
Couple of those lower ones were on a different time, but lots of these on the daily chart forgotten behind.
Someday...my SPY crash will come...

Price Gap Examples - Bitcoin FuturesSharing for educational purposes only.
█ Three Types of Gaps
There are three general types of gaps:
Breakaway Gap
Runaway (or Measuring) Gap
Exhaustion Gap
█ 1 — The Breakaway Gap
The breakaway gap usually occurs:
At the completion of an important price pattern.
At the beginning of a significant market move
Examples:
After a market completes a major basing pattern, the breaking of resistance often involves a breakaway gap.
Breaking major trendlines signaling a reversal of trend may also involve this type of gap
Key Characteristics:
Heavy volume often accompanies breakaway gaps.
They are typically not filled (or only partially filled).
In an uptrend, upside gaps act as support areas on subsequent corrections.
A close below the gap is a sign of weakness.
█ 2 — The Runaway or Measuring Gap
The runaway gap forms:
Midway through a trend (uptrend or downtrend).
Indicates the market is moving effortlessly, usually on moderate volume.
Key Characteristics:
In an uptrend, it signals strength.
In a downtrend, it signals weakness.
Acts as support or resistance during subsequent corrections.
Why "Measuring" Gap?
It often occurs at the halfway point of a trend.
By measuring the distance the trend has already traveled, the probable extent of the remaining move can be estimated by doubling the amount already achieved.
█ 3 — The Exhaustion Gap
The exhaustion gap appears:
Near the end of a market move.
Key Characteristics:
Occurs after objectives have been achieved and other gap types (breakaway and runaway) have been identified.
In an uptrend, prices leap forward in a final push but quickly fade.
Within a couple of days or a week, prices turn lower.
█ Conclusion
By understanding the types of gaps and their characteristics, traders can better interpret market signals and anticipate potential trends or reversals.
█ Source:
Murphy, John J. Technical Analysis of the Financial Markets: A Comprehensive Guide to Trading Methods and Applications. New York Institute of Finance, 1999. Chapter 4, "Price Gaps," pp. 94-98.

Bitcoin Week 48When looking at BINANCE:BTCUSDT.P and BINANCE:ETHUSDT.P you can clearly see that BINANCE:ETHUSDT.P closed above the previous week high while BINANCE:BTCUSDT.P didn't what indicate us as a bearish SMT.
BINANCE:ETHUSDT.P reached to a 1D gap from previous Q1 week which will be a resistance area.
This is why I would be bearish to BINANCE:BTCUSDT.P this week.
I would like to target the previous gaps marked in the chart above

ES1 Week 48Seems like this week CME_MINI:ES1! closed above the high of the previous Tertiary Quarter while CME_MINI:NQ1! didn't which indicate as bear SMT.
What supports this idea is the fact that CME_MINI:NQ1! is between two daily gaps of previous weeks in the same month Q1.
This make me believe that we are looking to retrace to previous gaps and I'm bearish this week.

Do You Trade Gaps? Here's What You Need to Know!📈 Trading gaps can provide some of the most reliable opportunities in the market—if you know how to handle them.
🔍 What is a gap?
A gap occurs when the price "jumps" between two levels, leaving an empty space on the chart. Gaps usually reflect strong market sentiment, news, or low liquidity during off-hours.
💡 Key points to consider:
1️⃣ Types of Gaps:
Breakaway Gap: Signals a new trend.
Continuation Gap: Often occurs mid-trend.
Exhaustion Gap: Marks the end of a trend.
2️⃣ How to Trade Them:
Identify if the gap is likely to fill or expand.
Use support and resistance around the gap.
Always keep an eye on volume—low volume could mean a false move.
3️⃣ Risk Management:
Gaps can be volatile! Use tight stop-losses and wait for confirmation before entering.
What’s your favorite strategy for trading gaps? Let’s discuss below! 👇

Crypto Week 47 AnalysisIt seems like that all Major 3 Crypto Coins are in Premium.
All of them are above True Week Open, True Month Open and True Year Open except for BINANCE:ETHUSDT.P Which is below True Year Open.
We are using a gap from previous Year Q4 that merge with a weekly gap. and we have a PSP in a weekly graph right about it.
Near True Year Open BINANCE:ETHUSDT.P there is a Gap from previous Monday in 3h graph.
I think I would like to see BINANCE:ETHUSDT.P getting into the 3h gap and targeting the True Year Open.
Current target in BINANCE:ETHUSDT.P is True year Open
After touching it I'll be bearish since the price is in a major Premium.

Futures Week 47 Monday AnalysisAs I see it the close target of both ES and NQ is the True Month Open.
On both of the True Month Open there is a gap from previous Monday in 6h chart.
The bullish movement that we had this week is supported by SMT between CME_MINI:ES1! , CME_MINI:NQ1! and CBOT_MINI:YM1! and 6h gap from previous Tuesday (Q2).
I don't see any relevant higher time frame gaps that the price can encounter until the True Month Open so my current target is that.
In my opinion CME_MINI:ES1! will get to the True Month Open first and will liquidate it, at the same time CME_MINI:NQ1! will get to a 90 minutes gap at AM session (Q3) and won't liquidate the True Month Open and we'll get a bearish SMT

Update on Tesla This is my update on Tesla stock.
A huge gap that was created today and looking to not go inside the gap.
Not seeing anything to show why this will continue going up without going back to the first GAP mentioned in the last post. Which was in October.
The GAP is showing a whopping 4% rise.

Update on teslaHi, quick update.
i do want to update some bearish technical scenerios that align with liquidity concepts. (neither bullish or bearish idea is 100% to occur and its important to prepare to all scenerios)
The latest test on demand was not what i was hoping to see. with prices making bad lows (confirm on TPO) and creating a liquidity pool, showing a lack of strength (market moves on the path of least resistance) from buyers(volume is low market shows uncertainty around current price).
We have a gap down (green rectangle) and bad lows, the last imbalances on the chart at 199.48 (if we dont consider the aug 5 bad lows duo to the japanese sell off)
These will hit stop losses and reset highly leveraged positions and most importantly will provide wallstreet a premium price on tsla shares.
That price aligns with targets from both bearish and bullish sides. as of now we are holding the daily 100 ema
the 200 EMA is 201 and the yearly VWAP is also confluencing with that EMA. SHOCKING!
If we are at the parliamentary supply a selling climax will follow.. and the target for it would close the imbalance and the gap would provide us a good low to buy from and grab upside liquidity if not break resistance finally.
in terms of RSI a sell off to that area will give us an oversold RSI on the daily and hit the orderblocks down there!
I am still bullish on tesla but acknowledging these bearish scenerios will help up understand what is happening if they happening. I closed my CFD position in tiny profit but i am still keeping my value investment on and havent sold a bit.
I will happily go further down and give myself a nice CFD trade on tesla from these price targets.!
This is not a financial advice but simply me sharing my ideas and journaling my investments and trading. I hope you all have a great day
I AM STILL BULLISH
THERES A REASON WHY THEY ARE CALLED SHORTS (SHORT TERM) AND LONGS (LONG TERM)

$AMZN: Fast Rebounds Reveal Fundamental Support LevelThe new technologies that Amazon is embracing, including robots/robotics, and a brilliant CEO keep this huge company moving forward.
The HFT-driven gap down in August was massive but the rebound was fast. This isn't the first time the stock has moved right back up to its prior quarter's fundamental support range, aka Dark Pool Buy Zone.
Now, NASDAQ:AMZN is slightly above that range to challenge the July high. A stock to watch ahead of its earnings report October 24th.

Dark Pool Buy Zone Stages More Gap Up PotentialNYSE:NKE gapped again with a breakaway gap jumping over resistance. These rarely fill and if the gap fills, it will be minimal. Volume was above average. This kind of gap up sequence can happen easily when a classic Shift of Sentiment pattern forms in Accumulation/Distribution indicators as a stock bottoms. But price remains well below the previous gap down. It may gap again as the stock challenges that resistance.

NAS Ideas This is just levels that I will be looking at for potential reversals or continuations ONLY.

Learning Price Action Through ObservationLearning Happens when you're open and curious and making observations from what you see. From there, you must be mentally balanced to take action on your observations.
In this post, I focus on the price action that happens in the pivot portion of a swing cycle. If you make observations of this area you will see a certain kind of repeating behavior that can help you understand and design methods for trading swings. You will notice that the market likes to wash everybody out of their positions before pivoting to continue its swing.
I have a look at two of the ways this shows up in the price action of a pivot. The first is an engulfing bar that expands and swallows at least 3 of the previous bars. The second is a Gap Swap where there will be a WRB Gap making an effort in one direction just to be followed by another WRB GAP that reverses that effort and direction and shows that the balance of power has shifted.
This is just a small part of what makes up a swing but it factors into my overall methods and trade plan. You can make observations yourself on pivots and see what you can learn.
Shane

FUBO Elliow WXY Double CorrectionFUBO started its rally from $0.96 in March 2023 and reached $3.87 in August 2023. Since August 2023, it has been declining with the Elliot WXY correction wave.
I think this correction will continue until the gap at $ 1.18 is filled. My guess is that this correction will continue until around $ 1.12-1.2. Unless it goes above $1.9, I am short FUBO.
