IPGP gaps up on higher volumeIPGP is a possible near-term buy opportunity. It is not trending well so is not a longer-term trade right now.
Yesterday's gap up offers a near-term buy due to the increase in volume on both this and the previous bar. Friday's bar (6th February) was actually more bullish and broke out above the strong resistance (at $78.59) and above the round number ($80). Yesterday's bar gapped up (showing strength to the upside) but was not bullish (a possible indecision or reversal candle). A retest and/or gap fill may transpire.
However, there is no further resistance ahead - although earnings are due on 20th February. Even for a short term trade this may be cutting it fine (to make a profit) but is not unreasonable.
Gapup

GPC double gap upGPC has spent most of 2014 in consolidation. The high of February proved to offer very strong resistance and price tested it a couple of times before finally breaking through. Once resistance had turned into support the uptrend has continued with some momentum.
On the daily chart there was a bit of stickiness around the $100 figure but now there is no specific resistance ahead. Last week Thursday's bar gapped up with higher volume and a bullish bar. This looked like a good near-term buy opportunity but the following day price gapped up again on higher volume - but this time with a bearish bar.
This could still present a good near-term buy but with the Christmas break fast approaching I will stand aside on this one - for now. I may look at it again next year for a longer-term trade.

CTAS gaps up but approaching $80CTAS has been in good uptrend for some time but had a fair bit of resistance to tackle before being considered for a long-term buy candidate.
At the end of 2013 price finally broke through the 2002 pivot high ($56.62) and the weekly chart shows the subsequent retest (as a double bottom) converting previous resistance into support. Since the confirmation of this chart pattern the bullish trend momentum has continued.
On the daily chart the trend is not the most linear but is adequate. Friday's gap up was an extremely bullish bar with higher volume (on the earnings announcement). If it weren't for the $80 round number (and the Christmas break) up ahead I would consider this a near-term long opportunity.

KMX gaps up to new highOverall KMX is not a great trending stock but has been in a bullish move for many years. So today I would only look for a near-term buy opportunity even though it has been trending well since breaking above the 2013 high ($53.08).
In late October price broke above the 2013 pivot high and this time the move stuck. There was a retest to turn previous resistance into support and since then price has continued to move up. On Friday price gapped up significantly (on the earnings announcement) with higher volume and a bullish bar.
The gap was rather large but all conditions point to a good possibility of price moving higher in the near-term (provided the gap isn't filled).

PETM gaps up (again)I last posted on PETM on 19th November when price gapped up past the very strong resistance from October 2013.
At that time I recommended standing aside until this level had been retested. If anyone bought this short-term the trade would've probably broken even or realised a very small profit.
Since then price has come back to retest $77.32 and the pivot held firm - previous resistance has become support. With yesterday's gap up on very high volume this has now become a far better opportunity to buy this stock.
In the near term the only downside is yesterday's bar was fairly bearish. Longer-term there is now support at the $80 zone (with the recent pivot high just below this at $79.68) and beyond that major support at $77.32.
PLong

CNC gaps up with bull flag above $100CNC gapped up on Friday, despite the overall bearish move on the US Indices. This was a quite significant move as there are a number of reasons to support a continuation of the uptrend - in the near-term at least.
Firstly, price gapped up above 3rd December high of $101.83 and the $100 figure. Second, this also confirmed a bull flag formation or, if you prefer, there was a reasonably even double bottom pattern. Finally, there was higher volume on the breakout bar.
Overall CNC is in a bull trend. There have been a couple of pullbacks which have been on the deep side since the weekly uptrend began in May but I would not look to take a longer-term position right now anyway (until $100 has been retested). Near-term, however, the signals are good for a continued move up so a small profit could be made here.

ORLY gaps up but approaching $200I have posted on ORLY before (in early November) and since then it has gone on to experience a lovely linear trend.
After the first gap up I was waiting for a pullback followed by a breakout to enter the trade. This happened on the day of my last post so I was able to enter on the next bar. Yesterday's gap up added to my equity so overall I am happy with this position.
To trade ORLY now (if I didn't have a position open) I would only consider a near-term buy as price is rapidly approaching the $200 figure. But a quick profit could be made as the set-up looks good. The bar was bullish and on higher volume. The overall trend is up and linear. The breakout bar confirmed a bullish flag and, hopefully, $190 could act as support (which would stop the gap being filled).
However, while the bar is bullish (giving momentum to the upside) it is a reversal/indecision candle so if you do want to trade this make sure your stop is tight.

RCL gaps up on higher volumeUntil earlier this year RCL had been in consolidation since 1999.
After price finally broke above $58.88 a good trend began to develop but was seriously hindered by the October pullback. This breached the 1999 pivot high and the 200dma but it was not all bad news - a cup and handle chart formation developed on the daily chart suggesting a move to the upside could continue.
The first gap up (28th November) was maybe a smidgen early - although perfectly valid as previous resistance had been tested to become support. The current gap up, however, is on very high volume and a bullish bar so a good candidate for a near-term buy.
A longer-term buy may also be on the cards but more cautious traders may want to see a bit more of the trend develop before making a long-term commitment. The longer the consolidation then the bigger the breakout - if this holds true there should be a lot more to come from RCL.

FDX gaps up with bearish barsFDX has been moving up since it's 2009 low but took some time to regain the ground lost from the 2007 high - with a long period of consolidation along the way.
Since breaking above the 2007 high ($121.42) late in 2013 price has still struggled to fall into a linear trend. However once price broke - and retested - the $150 zone a smoother trend has developed.
In the last couple of weeks FDX has gapped up three times on higher volume. While this should indicate strength, to the upside, the move as been most peculiar - each breakout bar has been bearish.
For this reason it may be prudent to wait a while to see how the trend develops. This may mean standing aside until $200 is cleared.

ESRX clears $80The markets were skittish yesterday so the breakout list today is not the best.
As a longer-term trader I would not want to trade ESRX. While this stock has been bullish for years the pullbacks can be very deep. Trends only last at the most for a few months. However, this may suit other traders who like to trade shorter-term.
The first gap up passed $80 (and on higher volume) so was a good opportunity to buy this stock. A second gap up soon followed but not, this time, on higher volume - so the entry was a little murky. Getting into a trade here could be difficult. But, if past data is anything to go by, the uptrend could last a few more weeks.
If you like a bumpy ride the next set-up for a long position could provide a near-term gain.
ELong

SAVE gaps up above $80On one of my other posts today I looked at LUV - another airline. LUV offers both a long-term and near-term buy opportunities. For SAVE, however, I would only consider a near-term opportunity.
SAVE had a good breakout and retest after breaking above the September high. It has now gapped above the more recent November high and $80. However, I do not have much data on SAVE (it only goes back to 2011). This is adequate for a near-term trade but not, for me, a longer-term one. Volume is also a little on the low side (although up on the breakout).
Overall, while this chart looks promising and I anticipate price going higher, I do not want to overcommit to one sector and I prefer LUV. If this were not an aspect of my trading plan then I might consider a long-term long on LUV and also a near-term long on SAVE.
SLong

LUV gaps up above $40LUV has been a good trending stock I have traded until the October pullback earlier this year.
Breaking above the September high (and confirming a cup and handle chart pattern) offered the first opportunity to re-enter this stock. But with some uncertainty still in the markets I passed this one by.
Since then price has continued its bullish rise with a more recent pullback/flag with plenty of indecision candles. But with Friday's gap up, above the pivot high, above $40, and on higher volume this is a positive buying set-up.
This looks good for either a near-term or long-term trade. I will be entering this trade on the next set-up.

AAPL - Buy Now or Wait? It's Your Call...Everyone has a different opinion about the answer to this question. I have learned that any day can be the right day to begin a trade or investment. The real question is how to limit the risk. This goes for Long and Short investments.
Why didn't you buy AAPL at $80? Did you think it had jumped too much after the $5 gap up?
This gap up was nice for current owners of AAPL. But it may have been a turn off for anyone thinking about getting in. Turns out it was a great opportunity...
Let's go through the chart.
Circle 1 - Price crossed above the red downtrend line when it gaped up. If you bought AAPL here, you could have set a stop at $80 and been off to the races.
Circle 2 - Price crossed above the red downtrend line. If you bought AAPL here, you could have set a stop at $89.50 and been off to the races.
How do you know when to get out of an investment? Should you sell everything? Just a portion? It's your call...
All I can tell you is I like to use an uptrend line to help make my decision. The original uptrend line that touches the low of day one after the gap and the lowest price in circle 2 is the uptrend line I drew. Problem is the price closed below my uptrend line on August 5.
Now in this case, the price only dropped $3 - $4 before turning positive again. But there was just as much of a chance that the price could have dropped much more. I believe in protecting profits. So selling a third or half was a good decision at this point.
Once the price turned back up, I adjusted my uptrend line lower and used that for a place to sell the rest.
On the topic of "adjusted trend lines"...
If you have profits and you are willing to risk them then go ahead and make "small adjustments". The adjusted uptrend allowed for even more profits. What is the downfall to adjusted trend lines? They may lead to smaller gains or eventual losses if you are not careful.
If you don't have profits, don't adjust trend lines! Get out when you said you were going to. Honor your stops.
Circle 3 - Price crossed above the red downtrend line. If you bought AAPL here, you could have set a stop at $93.25 and been in a good trade.
** Now realize that there needs to be another "Idea" published to talk about maximizing profits on the way up. This "idea" would be far too long if I included that subject here.
Circle 4 - Price crossed above the red downtrend line when it gaped up. If you bought AAPL here, you could have set a stop at $101.25 and been off to the races. It is also worth noting that the new green uptrend line that starts on this gap up is a steeper line than the adjusted uptrend or even the original uptrend. So the price is rising faster than it has in months...
Circle 5 - Price crossed above the red downtrend line. If you bought AAPL here, you could have set a stop at $108.25 and been in a good trade.
Now is the moment of truth. There is no "Circle 6". I can't see into the future so I can't tell you when it will happen.
Anyone who says they can should be approached with caution...
What if you buy now? To me, the most important thing is that you remember the investment is based on an uptrend line. Which means we all agree the price could come back to the uptrend line. Where is the uptrend line now? Yes, it is about $115. Are you willing to lose $3ish (2-3% of your capital) before "finding out" if the price will go back up?
What if you wait? If you wait you are probably saying, "I would rather buy AAPL closer to $115, $116, $117, etc. The good news is you won't lose any of your capital by waiting. Bad news is you may miss out on a great investment or trade. Many investors will tell you "don't chase". Why? Because successful investing is all about managing risk. The risk is at a minimum when you begin an investment close to the trend line.
Trade What You See. Not What You Think, or Feel, or Hope, or ... Protect Profits & Limit Risk

PANW gaps up on higher volumeThere is not much historical data on this stock so longer-term trend trading opportunities are out for me.
However, PANW gapped up on higher volume yesterday. Price is well clear of the $100 figure and is continuing to make higher highs. The bar was extremely bullish and only marginally larger than previous bars.
If the gap doesn't get filled this could be a good near-term buy.
PLong

ODFL approaching $80ODFL is a good trending stock, but volume is fairly thin. This can affect liquidly when entering and exiting trades.
The weekly uptrend has been long and linear - the pullbacks have become a little deeper but are more than acceptable on this timeframe.
On the daily chart, however, the pullbacks have caused a bit more of a concern. During early 2014 there were better charts to trade. Since the October 2014 pullback the trend does seem to have settled down. If you're comfortable with fairly large stops and low volume this could well be a long-term buy opportunity.

ROST gaps up on earningsROST could offer a good near-term buy on Fridays' gap up on higher volume. The bar was very bullish - adding to the momentum to the upside - and easily cleared the 2013 pivot high.
For longer-term traders, however, the large gap up could easily be filled - so we would want to see some sort of pullback or retest of the 2013 high before considering this a buy opportunity. And by that time we could well be approaching the psychological resistance of the 100 figure.
Since breaking above the 200dma in August the trend has been very linear so if this continues and price clears $100 then a long-term buy could be in the offering.
One for the watchlist.

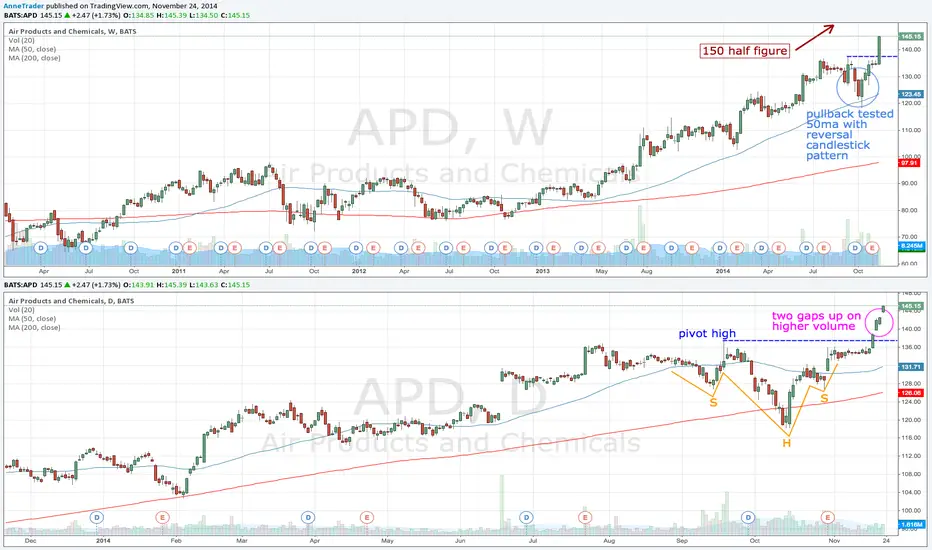
APD potential measured move upAPD has been in an uptrend all year but the deep pullbacks have made it too unpredictable to long-term trade so far.
On the daily chart an inverted head and shoulders chart pattern offered an opportunity to trade a measured move up. Since the break of the pivot high (which also confirmed the H&S pattern) there have been two gaps up on slightly higher volume.
This had the potential set-up for an almost $20 move up but, if you missed the first gap, the risk:reward is rapidly declining.
It offers a very good buy for a short-term trade as the momentum is up (with the gap, volume and bullish bar all in the direction of the trend).
But for longer-term traders you may want to now wait for a break above the $150 half figure before looking to trade this one.
TSO gaps up on higher volume - againTSO gapped up on 31st October above the long-term pivot high of $65.75 and the more recent September pivot high of $67.07.
The October gap was too soon to consider a long-term buy as price had not really cleared 2013s high of $65.75. Thursday's bar offered a better opportunity with a break above the November high with a clearly bullish bar. Despite the subsequent gap up on Friday this bar was not bullish - in fact it was on the bearish side - although volume was higher.
If you managed to buy into TSO on Friday then a long term position could well pay off. If not then you may prefer to wait for price to develop a little more into a more substantial trend. It does offer a buy opportunity but maybe not just yet for the more cautious, longer-term trader.
TLong

DLTR gaps up on higher volumeOn yesterdays earnings announcement price gapped up on DLTR (with higher volume). This offers a good near-term opportunity to buy this stock for a quick profit. Ideally, it would've been nice to have seen a more bullish bar.
For longer-term opportunities this stock has trended well in the past, but since June 2012 the trend has not been able to re-established itself. In late October 2014 the most recent upward wave began and, after breaking the October 2013 pivot high at around $60, it has shown more strength.
With two gaps up on higher volume and a retest of the October 2013 pivot this could well turn into a good longer-term opportunity, again.

PETM gaps up on earningsPETM has undergone a deep and prolonged pullback lasting over a year.
Yesterday price gapped up on higher volume and broke through previous resistance. The bar was very bullish, which gives a good indication that price could well continue it's upward momentum over the next few days.
However, with price only just breaking such a strong pivot point the potential bull move could be short-lived. If you trade gaps keep your stop tight. If you're looking for a longer-term opportunity this chart needs more time to develop so stand aside.
PLong

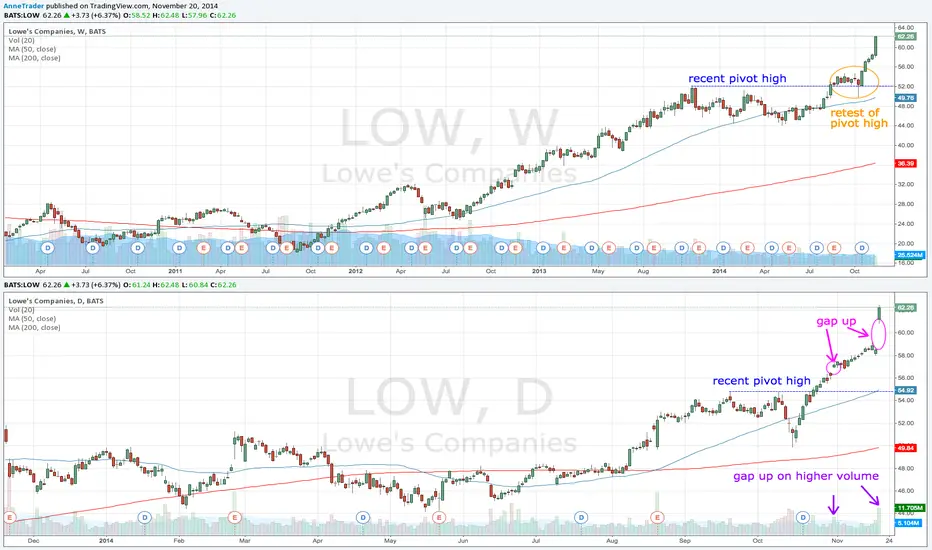
LOW going higherLOW has been trending up since late 2012 but the ride has not always been smooth. From November 2013 to August 2014 price was stuck in a prolonged pullback/consolidation around $50. Then in late August price broke above the November 2013 pivot high, retested it (see the weekly chart) with a spike below the resistance-turned-support and continued it's upward momentum.
On the daily chart LOW broke above the 19th September pivot high and a good opportunity to buy into this stock presented itself with the first gap up on 31st October. If you missed this then yesterdays gap offers a second opportunity.
Trading gaps is a near-term strategy but LOW looks in a position to trend over the longer-term, too, so this set-up could apply to either.
MMM strength to the upsideMMM has periods where it trends really well. But this year there have been two deep pullbacks which would've stopped most trend traders out of their buy positions.
Since price broke above the September pivot high the candles have not been overly convincing. There was a gap up on 31st October but it was a doji, followed by a gravestone doji, which did not inspire confidence. However, the next bar broke out on higher volume so this could've been the first opportunity to get into this trade.
Yesterday another bullish flag was confirmed (on higher volume) offering traders the opportunity to now consider entering long on MMM (or add to their trade).

AGN gaps up over $200AGN often crops up on my watchlist. It has been in a bull trend for several years but frequently experiences prolonged consolidationary periods.
The stock has been in an uptrend since earlier this year but got into a $145-$175 range from May to October. But, despite the market-wide October pullback, AGN manage to break out of this range, retest the previous resistance and continue its upward trajectory.
Yesterdays bar gapped up on higher volume and closed well above the $200 mark and previous pivot points - offering a good short-term buy opportunity. The one negative on this potential trade is the nature of the breakout bar - it's extremely bearish. If you don't get triggered long onto this trade within the next bar or two you may want to remove your order.
ALong
