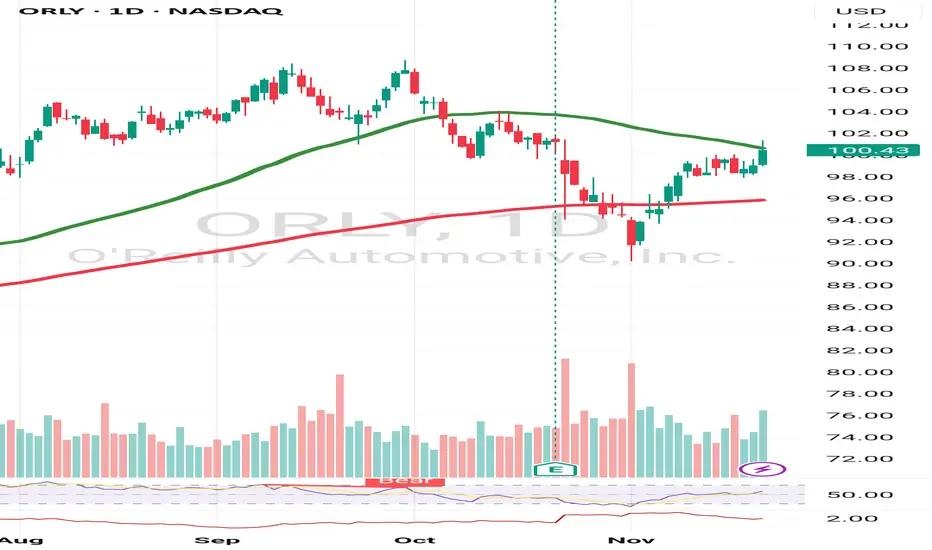
$ORLY Riskable level for potential new ATHsA nice candle last week to risk against along with volume coming in. This is at support and a higher low to the tweezery bottom formed back in July.
I will wait for the end of this weeks candle to ultimately pull the trigger and I'd like to see that improve first.
A clear supply level with riskab
Compare with O'Reilly Automotive, Inc.
3.16 USD
2.54 B USD
17.78 B USD
804.71 M
Next report date
—
Report period
—
EPS estimate
—
Revenue estimate
—
Company info
Sector
Industry
CEO
Brad W. Beckham
Website
Headquarters
Springfield
Founded
1957
IPO date
Apr 23, 1993
ISIN
US67103H1077
CUSIP
67103H107
FIGI
BBG000BGYWY6
Identifiers
ISIN US67103H1077
O'Reilly Automotive, Inc. owns and operates retail outlets in the United States. It engages in the distribution and retailing of automotive aftermarket parts, tools, supplies, equipment, and accessories in the U.S., serving both professional installers and do-it-yourself customers. It provides new and remanufactured automotive hard parts, including alternators, starters, fuel pumps, water pumps, brake system components, batteries, belts, hoses, temperature controls, chassis parts and engine parts, maintenance items consisting of oil, antifreeze products, fluids, filters, lighting products, engine additives, and appearance products, and accessories, such as floor mats, seat covers, and truck accessories. Its stores offer auto body paint and related materials, automotive tools, and professional service provider service equipment. The firm stores also offer enhanced services and programs consisting of used oil, oil filter and battery recycling, battery, wiper, and bulb replacement, battery diagnostic testing, electrical and module testing, check engine light code extraction, a loaner tool program, drum and rotor resurfacing, custom hydraulic hoses, professional paint shop mixing and related materials, and machine shops. O'Reilly Automotive stores provide do-it-yourself and professional service provider customers a selection of brand name, house brands, and private label products for domestic and imported automobiles, vans, and trucks. The company was founded by Charles F. O'Reilly and Charles H. O'Reilly in November 1957 and is headquartered in Springfield, MO.
ORLY - Higher time frames are aligning for a trade setupThe weekly/daily are lookin' flaggy.
On the monthly, you can see us fighting to hold a 6 year trend line - having teased it and taken lower time frame liquidity on strong volume.
I'm tempted to risk the $82 lows and take it to the upper end of the taper at $98.
However, I think the better play is
O'Reilly Automotive (ORLY) - Major Move on the Horizon?
A Bottom May Be In.
O'Reilly Automotive (ORLY) — Primary Outlook (Ew analyisis)
With wave (iv) complete at $82.62, price appears to be unfolding within a new impulsive sequence to the upside. Price has found support at the 61.8% retracement, setting the stage for wave iii to extend toward the 1.
O'Really (ORLY)ORLY stock is one of the strangest stocks. It goes up when the rest of the market is going down, and during a bear market, it does not drop as much as other stocks.
Looking at the chart, institutional investors have taken all the available liquidity. This means the market may be ready to go up.
Be
ORLY at Confluence: Bullish Rotation Loading?
Bullish acceptance: Close above green value line = continuation higher.
Bearish failure: Break below red channel boundary = auction invalid.
Price now at confluence of support + red boundary line. Expecting rotation to the upside.
Analysts Strong Buy, avg PT ~$110–$112 (recent raises + rising ins
ORLY Strong Bear Breakout With Candles Confirming DistributionORLY 28/02/2026
💰 93.32
🟢 Strong BEAR 33.33% at 2x
🟢(33.3%):🔴(66.7%) ⏳Clarity:46%
Retrace:-0.7% Bounce:3.6% 5x 💥 BO+
The bears have taken control of this chart with a clean structural breakdown. Multi-timeframe count shows 16 green versus 35 red across 112 signals. Higher timeframe trend confirms t
ORLY: bullish momentum continuesThis chart shows O'Reilly Automotive (ORLY) on a daily timeframe, displaying both technical indicators and recent price action.Reasons to BuyThe price has bounced off a recent low and is now trading above previous support levels, showing signs of recovery.
The stock is approaching the green moving
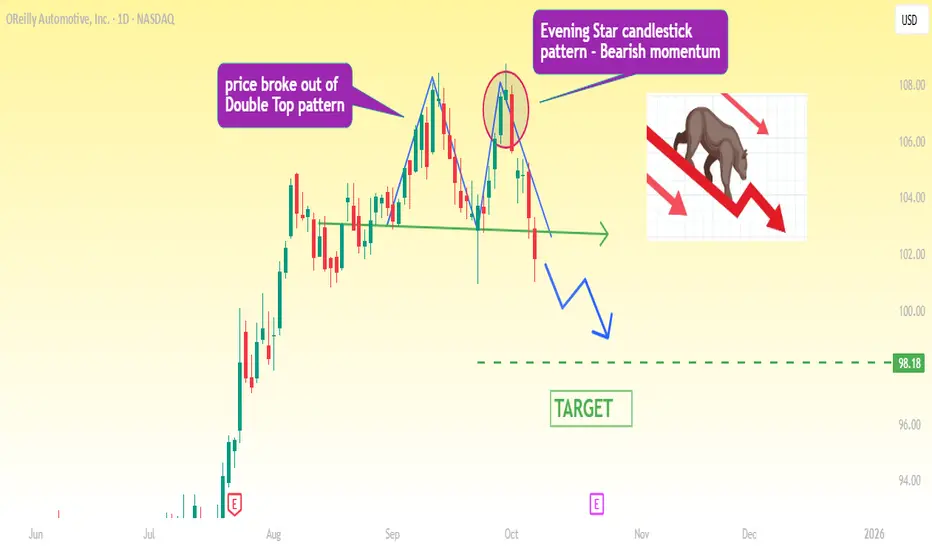
O'Reilly Breaks Down from Double Top + Evening Star Confirmation🧩 Pattern Overview
O'Reilly has broken down from a well-defined Double Top pattern , signaling a potential reversal in trend from bullish to bearish. The breakdown suggests that sellers have regained control after failing to push the price to new highs.
🌇 Candlestick Confirmation
Adding weig
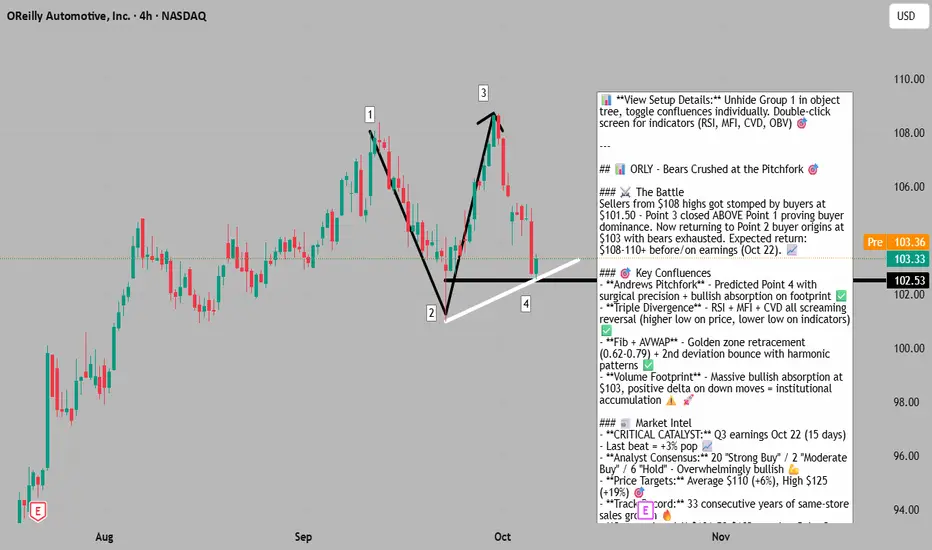
Bears Crushed at the Pitchfork - Bulls Loading📊 **To view my confluences and linework:**
Step 1️⃣: Grab the chart
Step 2️⃣: Unhide Group 1 in the object tree
Step 3️⃣: Hide and unhide specific confluences one by one
💡 **Pro tip:** Double-click the screen to reveal RSI, MFI, CVD, and OBV indicators alongside divergence markings! 🎯
---
Title:
ORLY. Huge profit target at these levels. Short Potential. I don't short much because it doesn't fit my strategy as well. But I would really look for shorts in this box if it sets up. Huge major fib levels we are testing for the first time. Looks dumpy.
I always get messages from mods to explain my trades. I often cant. It comes from almost 10 years o
See all ideas
Summarizing what the indicators are suggesting.
Neutral
Neutral
Neutral
An aggregate view of professional's ratings.
Neutral
Neutral
Neutral
Displays a symbol's price movements over previous years to identify recurring trends.
Maturity dateMar 12, 2036
Coupon5.10% (Fixed)
Maturity dateMar 14, 2037
Coupon5.55% (Fixed)
Maturity dateAug 19, 2034
Coupon5.00% (Fixed)
Maturity dateNov 20, 2026
Coupon5.75% (Fixed)
Maturity dateMar 15, 2031
Coupon1.75% (Fixed)
Maturity dateAug 14, 2031
Coupon5.05% (Fixed)
Maturity dateJun 15, 2032
Coupon4.70% (Fixed)
Maturity dateApr 1, 2030
Coupon4.20% (Fixed)
Maturity dateAug 14, 2029
Coupon4.80% (Fixed)
Maturity dateJun 1, 2029
Coupon3.90% (Fixed)
Maturity dateJun 1, 2028
Coupon4.35% (Fixed)
See all ORLY bonds
Frequently asked questions
The current price of ORLY is 86.28 USD — it has increased by 1.65% in the past 24 hours. Watch O'Reilly Automotive, Inc. stock price performance more closely on the chart.
Depending on the exchange, the stock ticker may vary. For instance, on NASDAQ exchange O'Reilly Automotive, Inc. stocks are traded under the ticker ORLY.
ORLY stock has risen by 0.81% compared to the previous week, the month change is a −1.14% fall, over the last year O'Reilly Automotive, Inc. has showed a −14.61% decrease.
We've gathered analysts' opinions on O'Reilly Automotive, Inc. future price: according to them, ORLY price has a max estimate of 120.00 USD and a min estimate of 94.00 USD. Watch ORLY chart and read a more detailed O'Reilly Automotive, Inc. stock forecast: see what analysts think of O'Reilly Automotive, Inc. and suggest that you do with its stocks.
ORLY reached its all-time high on Sep 30, 2025 with the price of 108.72 USD, and its all-time low was 0.15 USD and was reached on Apr 27, 1993. View more price dynamics on ORLY chart.
See other stocks reaching their highest and lowest prices.
ORLY stock is 1.09% volatile and has beta coefficient of 0.07. Track O'Reilly Automotive, Inc. stock price on the chart and check out the list of the most volatile stocks — is O'Reilly Automotive, Inc. there?
Today O'Reilly Automotive, Inc. has the market capitalization of 69.58 B, it has decreased by −0.32% over the last week.
Yes, you can track O'Reilly Automotive, Inc. financials in yearly and quarterly reports right on TradingView.
O'Reilly Automotive, Inc. is going to release the next earnings report on Oct 28, 2026. Keep track of upcoming events with our Earnings Calendar.
ORLY earnings for the last quarter are 0.86 USD per share, whereas the estimation was 0.86 USD resulting in a −0.29% surprise. The estimated earnings for the next quarter are 0.93 USD per share. See more details about O'Reilly Automotive, Inc. earnings.
O'Reilly Automotive, Inc. revenue for the last quarter amounts to 4.89 B USD, despite the estimated figure of 4.86 B USD. In the next quarter, revenue is expected to reach 5.01 B USD.
ORLY net income for the last quarter is 715.06 M USD, while the quarter before that showed 604.18 M USD of net income which accounts for 0.00% change. Track more O'Reilly Automotive, Inc. financial stats to get the full picture.
No, ORLY doesn't pay any dividends to its shareholders. But don't worry, we've prepared a list of high-dividend stocks for you.
As of Oct 9, 2026, the company has 92.92 K employees. See our rating of the largest employees — is O'Reilly Automotive, Inc. on this list?
EBITDA measures a company's operating performance, its growth signifies an improvement in the efficiency of a company. O'Reilly Automotive, Inc. EBITDA is 4.17 B USD, and current EBITDA margin is 22.35%. See more stats in O'Reilly Automotive, Inc. financial statements.
Like other stocks, ORLY shares are traded on stock exchanges, e.g. Nasdaq, Nyse, Euronext, and the easiest way to buy them is through an online stock broker. To do this, you need to open an account and follow a broker's procedures, then start trading. You can trade O'Reilly Automotive, Inc. stock right from TradingView charts — choose your broker and connect to your account.
Investing in stocks requires a comprehensive research: you should carefully study all the available data, e.g. company's financials, related news, and its technical analysis. So O'Reilly Automotive, Inc. technincal analysis shows the buy rating today, and its 1 week rating is sell. Since market conditions are prone to changes, it's worth looking a bit further into the future — according to the 1 month rating O'Reilly Automotive, Inc. stock shows the buy signal. See more of O'Reilly Automotive, Inc. technicals for a more comprehensive analysis.