*DAX* If this is not a reversal sign i don't know what is.Gap up candle with no major news outside the Bollinger band that turns red at the close.. if this is not a good sign of a reversal i don't know what is... in case it does not plays out i will start looking ONLY on Weekly candles and charts.
Gapup

CETX: DIAMOND HANDS SWING TRADESo yesterday i day traded this stock in the first 30 minutes of the open. My favorite day trade strategy formed and i was able to buy in at 3.35 and sell at 3.60 within 15-20 minutes for a nice 8% return.
However i got greedy in the afternoon and decided to reenter (with bigger size stupidly) for a sympathy bounce as price was flirting with support at the $2.85 range.
I didn't end up selling with the crowd, which i think i should have done at the moment, but i put a stop loss on and headed to work.
I noticed that i wasn't stopped out at work yesterday and seen that price is really trying to hold the $2.35 range.
Looking back at the chart i see that at that level and the $2.00 level there is quite a bit of resistance.
After reviewing this morning i decided to go with the diamond hands approach and only sell if price really destroys previous support levels.
The longer this plays out, the more confident i feel about this having another run up (similar to INVO this month or WIMI from October to present)
Price is really consolidating and holding the $2.00 area and forming a nice bullflag looking pattern.
With this stock being on the SSR list tomorrow, holding $2.00 level and I believe there are some retail shorts looking to ride this down to the gap at $1.66 I think tomorrow can be very interesting.
They also announce earnings on the 18th and beat expectations last earnings report. I also like their SmartDesk Product and surprised this is not more popular with the price point they offer it at.
Well i hope some luck is on our side tomorrow so i can get out before without playing earnings, but if this holds $2.00 area tomorrow and does not have massive volume i will probably hold through earnings.
Goodluck Traders! Please leave your comments below if your looking at this stock, or are like myself and hold a position. would love to hear others opinions on this one especially!

The Gap Up (1)Stock price has a gap up, how to confirm it is a true break out or a false break out? Maybe a tight consolidation is a method.
Tips:
This is forex, not a stock. But the tips should apply as well.
Before the gap 2017 May, there were several times the price tried to challenge the resistance line.
Once gap up, a false break out then followed by a tight consolidation, can say the resistance became support.
After the consolidation, price broke out using a way called red three soldier.Then the second break out can be treated as buy hint.

Multibagger Stock -Jagran Prakashan-- BREAKAWAY-GAP preceded by a valid ROUNDED-BOTTOM pattern formation by more than a year.
-- One-year Accumulation
-- Volume on the gapup day is a lifetime high.
-- Weekly gapup (very rare)
-- Bullish Engulfing pattern
-- Risk : Reward = 1:4
-- Resistance at every level (so be careful)
LTP - 60
Target - 75
Stop loss - 57

PLTR Gap Up SoonPLTR Reversal
Held and Bounced perfectly off 200EMA
Looking very oversold on all timeframes
RSI & SMI curling
Descending wedge on daily
Earnings on Tuesday - expecting a gap up!
PT1 33.6
PT2 36.8
PT3 40, ATH+!
SL Below 200EMA, or 30

A Valero FakedownFirst off, sorry for the odd orange lines, I couldn't make the chart 5 minute resolution for this one-day prediction. Instead I tried to predict where the most trading would commence for a given 15 minute timeframe by overlapping transparent lines on the 5 minute chart.
The basic premise is that Valero will end the day in the red after making a semi-H&S formation. I believe this is a "fakedown." Rather than continue to collapse (as it has done numerous times in the past) instead it will either gap up or fly up several dollars close to Monday's open. Such strange price action should catch quite a few investors off guard. That's the stock market for ya.
My reasoning: The recent deep gully since January has caused most potential sellers to sell in fear. What's left are hungry buyers who missed the correction and skittish sellers looking to take profit. Buying now may seem odd, especially given Valero's long-term downward trend, but oil prices have been anything but bearish and Valero is well-positioned to capitalize on that rally. Though prices may come back down in the next few days after this prediction, I believe Valero's future price will not disappoint. I will be keeping an eye on this today and make another Idea if it pans out on Monday.
Conflict of interest notice: I sold Valero calls earlier today and will be buying new calls EOD if Valero is close to the predicted price.

End of Crude oil / US OilEnd here is opposite side of the channel.Either break out / trend reversal might happen.
Go as per the trend .I have given detailed view of how to trade crude oil.links are given below .Do as per that

HOW TO INVEST IN SBI ? and WHY SBI IS NOT FOR TRADERS? COMPLETE PRICE ACTION :
SBI IS ONLY FOR INVESTORS WHO WISH TO INVEST AND FORGET.
AFTER 1 YEAR/2 YEARS YOU CAN SELL AND TAKE OUT PROFITS .
BUY WHEN THE PRICE HITS - SUPPORT LIN E +RSI BELOW 30
SELL WHEN THE PRICE HITS - RESISTANCE LINE OF THE CHANNEL + RSI ABOVE 75
USE ALONG WITH USE RSI- TEAMGAPUP FOR EXTRA CONFIRMATION.
Do the same only when both the conditions are meet.
May be if this year if there is no break out .You can use the same logic above.
Lets see if this could be a 12th year to follow the same channel
why its not for traders ?
Because it hardly takes 1year to 2 year to travel to the opposite direction,where day traders cannot be benefitted

$FTI - Green englufing candleHaven't seen this stock before. Green engulfing, recent gap ups, volume spike, back above 20ma. Would watch for a gap up tomorrow. Anybody know anything about this one?

what will happen to bank nifty tomorrow ?Bank nifty has been in traveling in the RISING WEDGE PATTERN for the past 3 months . we are at the crucial point.Either it as to break up or break down.we cant determine the gapup or gapdown.So we have to wait and watch. IF the candle takes support from the trend line tomorrow as mentioned above we can go long till the above mentioned targets. Now what to do if bank nifty falls,we will wait for the retracement to the same trend line. Thank you.

STOCKS TO BUY ON 18-01-2021 IDFC GO LONG18-01-2021
IDFC HAS THE POTENTIAL TO TOUCH 54.25
BUY ABOVE 45.8
CMP=44.7
TGT=54.25

Botanix: Strength to StrengthBotanix Pharmaceuticals Ltd (ASX:BOT) is a clinical stage cannabinoid therapeutics company. The company focus is the development of safe and effective topical treatments for serious skin conditions. It has an exclusive license to use a proprietary drug delivery system - Permetrex for direct skin delivery of active pharmaceuticals in all skin diseases. The company's product pipeline includes BTX1503 - Moderate to Severe Acne, BTX1308 - Plaque Psoriasis, BTX1204 - Atopic Dermatitis, and BTX 1701 - Mild Acne.
Bullish Outlook:
- Trending Bullish within Upward Channel
- Double Bottom off Support
- RSI not Overbought
- TB Fib Targets Achievable
- Positive news should see this continue trend
Trading.
"DISCLAIMER: NO ADVICE. The information presented here is general in nature and is for education purposes only. Nothing should be considered to be advice. You should consult with an appropriate professional for specific advice tailored to your situation."


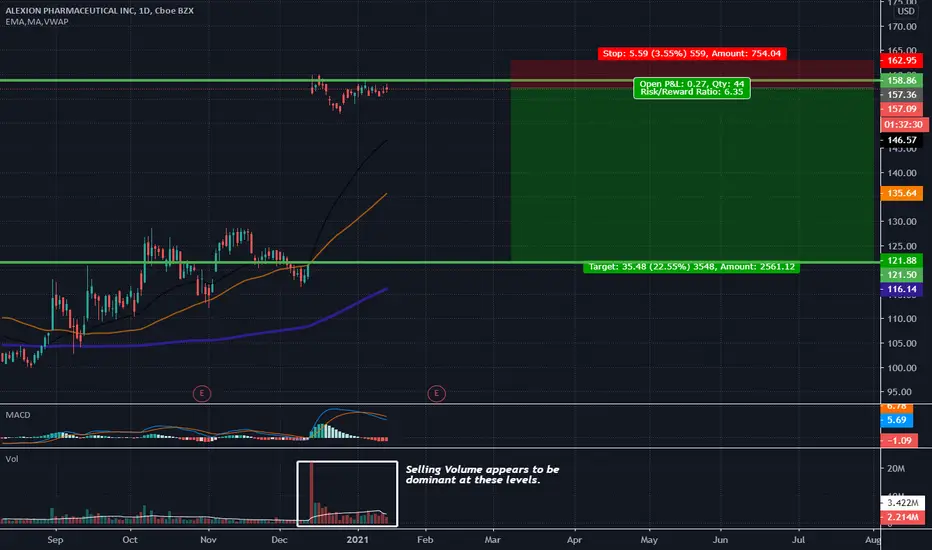
Potential Gap fill to take us down 20%Price looks extended into resistance, after a huge gap up we saw a huge spike in volume.
Now it appears that the sell side volume is taking over as we have not had many green days since we got here and the MACD has given us our bearish crossover.
The weekly does not make make it look any better as we seem to have a confirmed Gravestone Doji on our weekly chart:
I believe we could see a huge drop in the coming days possibly to fill the gap below.
Quick Tip - Stocks that gap upWe've been waiting for $PEIX to breakout for a while now. Been patient. Now, it has gapped up two days in a row. Stocks that gap up, tend to gap up again in a short period of time, and have big runs. I don't have a price target because this may go on for a while. But we will also keep an eye when it reverses, as it will want to fill those gaps. This is when a trailing stop comes in useful.

$FUBO - Nailed the bottom! First Target $32Called bottom yesterday, now we look to fill this first gap. $32 first target.

DIS 12/21/2020 LongDIS gapped up on heavy volume over a significant level that it was bumping up against & has spent six days digesting these higher prices.
I bought a half-sized position on Monday (12/21/20) when the market gapped lower due to a new COVID strain mutation in the U.K. I believe that the market is over COVID & has been for some time. Unless there is a negative development on the vaccine front, Pumpin' Powell is going to be able to continue inflating the asset bubble. The DIS pullback also coincided nicely with a bounce off of the 9-day EMA.
My initial stop is below the low of the gap-up day. I'm looking to add larger size on a break of Monday's highs circa $172. I would also be willing to add on a false break & quick reclaim of Monday's lows, at which point I would move stops up to just below the false break.

ETHUSD to see an uptrend(4Hr) | Gap up expected | MACD BullishMarket in last 24hrs
ETHUSD saw a slight uptrend with price started to ride the upper band
Price volatility was very high. The market moved ~10.69% between $593.74 and $536.38
Today’s Trend analysis
ETHUSD expected to see an uptrend with the price riding the upper band with gap up in price expected with Bollinger band expanding
Price at the time of publishing: $586.16
ETH’s market cap: $66.6 Billion
Oscillator indicators are mostly neutral. RSI at 65
Moving average indicators are suggesting an uptrend. Ichimoku Cloud is neutral
Volume indicators observed a change from decreasing with an increase in price to an increase in volume with an increase in price
Price expected to see an uptrend with the price riding the upper band with gap up in price expected with Bollinger band expanding. Most of the Oscillator indicators are neutral. MACD line moving above the signal line, with the histogram size increasing in the positive region suggesting bullish bias. RSI at 65, in the neutral region above the midline. CCI with a value of around 147 in the overbought region. Another interesting point to notice here is that the volume observed a change from decreasing with an increase in price to an increase in volume with an increase in price indicating a shift from sellers to buyers.
----------------------------------------------------------------------------------------
The analysis is based on signals from 28 technical indicators, out of which 17 are moving averages and the remaining 11 are oscillators. These indicator values are calculated using 4Hr candles.
Note: Above analysis would hold true if we do not encounter a sudden jump in trade volume .
----------------------------------------------------------------------------------------
If you find the analysis useful, please like and share our ideas with the community as well as follow to stay updated with new ideas!
- Mudrex


$ALGN Earnings Retest Bull Flag Forming$ALGN had a huge earnings gap a few days ago and, finally, it has returned to the base of that move. Buyers will have been waiting here for a LOOOONG time and if we can form a bull flag breakout higher, may just have the juice to kick off another big leg up again.

SELB Lots Of Technical Levels To Look AtSELB filled that gap down from its data miss a few weeks back and now testing a pretty consistent level of previous support/resistance.
"Selecta and IGAN Biosciences entered into a research license and option agreement to study Selecta’s ImmTOR™ immune tolerance platform in combination with IGAN’s immunoglobulin A protease for the treatment of IgA Nephropathy. We then saw the company and AskBio receive FDA Rare Pediatric Disease Designation for their gene therapy for methylmalonic Acidemia; several key milestones in a very short time span...Director Timothy Springer remains bullish on the company. He picked up another 3.6 million shares from October 21-23 at prices ranging from $2.4994 to $2.7147. Springer has been buying up shares for weeks. This latest round brings his position size to over 11 million shares in the company so far."
Original Quote Source: 5 Biotech Penny Stocks To Watch With Recent & Upcoming Events

$SPCE How To Best Position Yourself For Future DevelopmentsThis is a follow-up post from my previous $SPCE analysis on October 4th titled "$SPCE Love Space Travel, But You May Want To Wait Before Buying".
Technical Analysis
In my previous post, when $SPCE was priced at $20.77 before the moon towards the October 20th's Highs of $24.36, I talked about how at that point in time, $SPCE had 2 unfilled gaps at $24.02 and $16.43 respective, despite having a history of closing any of its gaps. Within that post, I also gave 2 possible scenarios that I foresaw would occur leading up to the October 22nd's window opening for Virgin Galactic's next crewed spaceflight test. If you are interested to see what exactly my previous analysis was about, you can refer to my previous post which I have linked down below in the 'Related Ideas' section.
Update 1: Since the post on October 4th, we saw $SPCE prices staying above the Symmetrical Triangle chart pattern after breaking out of it and re-testing the Slope of Lower Highs on October 13th. After rejecting the Slope of Lower Highs, it continued bulling and eventually filled 1 of the 2 unfilled gaps at $24.02 on October 20th. However, after filling the gap and reaching the Highs of $24.36, we saw an immediate rejection within the same 4H candle, creating a Shooting Star candlestick pattern. Later on during the session, we saw prices rejecting all the way down and closing at $20.44 for the day.
Update 2: What caused this huge 16% decline from the peak of $24.36? There are 2 reasons for this. The first reason is a technical one based on what I have mentioned earlier. After closing the $24.02 gap, $SPCE entered into a strong resistance zone of $24.26 to $24.85. On top of this, because of the meteoric rise, a Regular Bearish Divergence was also created. These technical factors combined created a retracement cum rejection from the strong resistance zone.
Update 3: However, based on this factor alone, it does not justify a 16% decline from the peak. This brings me to my 2nd reason which is short-seller Jim Chanos of Kynikos Associates' comment on the space sector. If you aren't aware of what happened, at an investor conference, Chanos expressed his bullishness on the space sector but later retracted his statement by saying that he was joking. This, combined with the technical factor I mentioned earlier, created a 16% decline from the peak of $24.36.
Entries, Price Targets, Stop Losses
Because of the highly speculative nature of $SPCE plays at this stage due to so many uncertainties surrounding it and so many things that can go wrong, I can't give an exact price target or stop loss at this juncture. But what I can say is that, if something does go wrong, even the most minute incident that is unfavorable for $SPCE, it is almost certain that we will see $SPCE back in the $16.43 range to close the last unfilled gap. What I can also say is that if you want to trade or invest in $SPCE - don't go all-in yet . The approach to take is to have a small enough position in $SPCE so that you feel that you have some skin in the game but not so much position such that even if $SPCE falls to the $14.00 to $16.00 range, you can still feel emotionless. Personally, I have taken this approach as well, where I have an entry at $20.91 and is mentally prepared to stay emotionless for both a meteoric crash towards $14.00 as well as a meteoric rise towards $30.00.
Disclaimer
I do not provide personal investment advice and I am not a qualified licensed investment advisor. I am an amateur investor.
All information found here, including any ideas, opinions, views, predictions, forecasts, commentaries, suggestions, or stock picks, expressed or implied herein, are for informational, entertainment, or educational purposes only and should not be construed as personal investment advice. While the information provided is believed to be accurate, it may include errors or inaccuracies.
I will not and cannot be held liable for any actions you take as a result of anything you read here.
Conduct your own due diligence, or consult a licensed financial advisor or broker before making any and all investment decisions. Any investments, trades, speculations, or decisions made on the basis of any information found on this site, expressed or implied herein, are committed at your own risk, financial or otherwise.
If this post has helped you out in making your investment/trading decision, give it a huge thumbs up, and follow for more updates regarding this ticker symbol!

NCR After big gap - closer for critical area of resistances NYSE:NCR
excellent risk-reward ratio in this trade
