Is AVGO’s drop over yet?Oracle AVGO — Price Analysis
Chart A (Daily):
Price had been oscillating within an 80-day channel, and after failing to reach the channel’s upper boundary due to repeated divergences, it finally broke below the bullish channel with two strong, high-volume daily candles—the highest selling volume seen on this chart in the past 68 days—and closed below the channel.
Chart B (4H):
This structure is also visible on the 4-hour chart as a wedge pattern, where price initially experienced a fake breakout to the upside and has now broken the lower boundary of the wedge.
Outlook:
This corrective move could potentially continue at least to the gap zone highlighted on the chart, which is a significant gap, and possibly extend further to the support zone at the lower end of the extended channel. Once price reaches these areas, we should watch for potential reactions.
Note: This analysis will be updated as the situation develops.
Follow me on TradingView for more analyses and live stock trades.
NASDAQ:AVGO
Gapzone

EURUSD Shot Position1) Short-Term Price Action (1H Chart)
EUR/USD FX:EURUSD has strongly broken out of its channel on the 1-hour timeframe and is now trading within the extended channel toward the gap zone.
2) Gap Zone & Key Levels
The gap zone aligns with the 50% level of the larger 4-hour channel.
This zone presents a high potential for price to reverse downward.
3) Reversal & Resistance Zones
The main reversal area could be the resistance zone, especially where it coincides with a strong supply zone.
Both the resistance and supply zones are key levels for potential selling opportunities.
4) Demand Zone & Short-Term Reaction
If price declines, it is likely to reach at least the demand zone, which may trigger a short-term bullish reaction.
5) Risk Disclaimer
This analysis reflects my personal view.
Always trade based on your own strategy and trading system, and strictly follow risk and money management rules.
I’d be happy if you follow me to catch all my market analyses and live stock trades in real time.

Uninspiring Technical Patterns Ahead of NFLX EarningsLike many others, NASDAQ:NFLX has shifted to a wide sideways trend ahead of its earnings report today after the close. There is no pre-earnings run here. Current volume and price trend are not patterns that inspire a good earnings surprise.
HFTs are always watching news ahead of open on high-profile stocks to get ahead of retail market orders. A gap is likely at tomorrow's open.

CLN2020: Gap RetestThe July delivery contract is seemingly in a decent spot for buyers. Having retested the bullish structural gap area, oil is now trading at a price where many players are waiting for it choose the direction, which will ultimately accelerate the consequent move as players book profits/losses. This can be interpreted as having greater control of risk, as a $1.5K risk is enough to "know" whether one is wrong being bullish here.

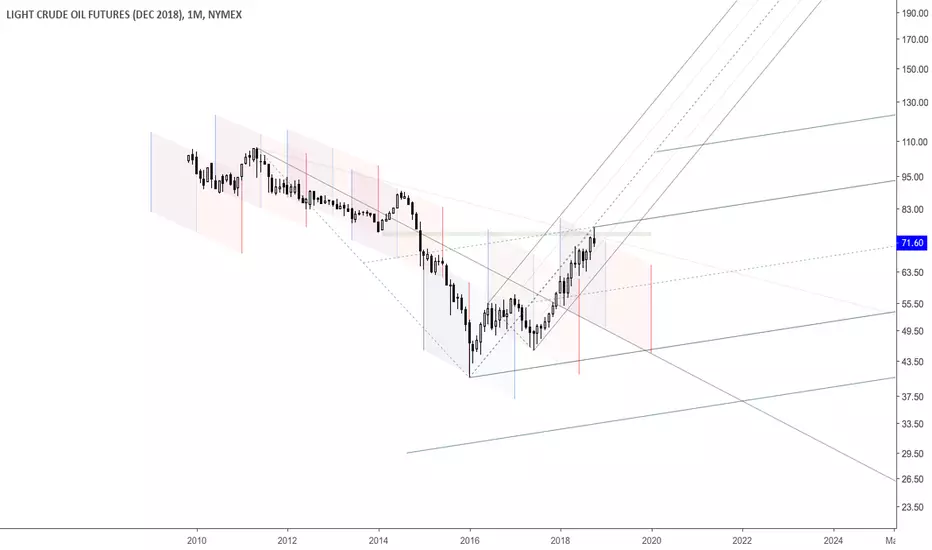
Oil's Cyclical Behavioral PatternsIt is worth noting that oil changes its major trend direction during the month of June or January. The chart above is an attempt to show this relationship throughout the lifetime of CLZ2018. Also, another important aspect highlighted is the fact that CLZ2018 just tested the major gap area left by the bears in November 2014. Though there are no signs of the major oil trend changing, the higher highs and higher lows structure being still intact, nonetheless there is an increased risk at this point of that happening. Staying tuned for further tells.
Weekly Outlook On DXYDXY got picked up at 150 day EMA. Odds are there will be a testing of that gap area around 98 if bulls manage to close above the D point. Bears see a larger high 2 double top sell setup, there's a 61.80% reaction on last bear leg. Though at this point there is no clear indication of a breakdown in lower timeframes, staying tuned for further tells might be the best option.

