AR Antero Resources Bullish Bets in the Options Market! PT: $40Macro Catalyst: Winter Storm Fern:
The severe storm has disrupted U.S. gas supply, cutting production by 9–15% and boosting demand. For AR, focused on Appalachian gas, this spells direct upside as exports and heating needs spike.
Technicals:
AR held support above $34, with recent highs at $35.51. Volume topped 3.69M shares. A bullish pennant pattern suggests a breakout past $35.50–36 could target $37–38, accelerating to $40 post-earnings. EPS growth hit +472% Q/Q, limiting downside (support at $32–30).
Options Flow: Heavy Bullish Bets:
Sentiment screams bullish: $105M call premiums vs. minimal puts, volumes 6.8x daily average. Key unusual activity on long-dated calls:
Massive blocks on Feb 2026 $37 strikes (35k+ contracts, $2.6M–$8.6M premium)
Mar 2026 $38/$39 strikes with sweeps (40k/3k contracts)
Recent Mar $39 calls at $0.85
IV at 41–48%, high heat score signals aggressive upside plays. Dark pool blocks (e.g., 1.17M shares ~$40M) show smart money accumulating quietly.
Analyst Consensus: Strong Buy with Upside!
15 analysts rate Buy overall (9 Buy, 7 Hold, 2 Strong Buy), average target $44.33 (~29% upside). Wells Fargo at $46, Siebert at $48; optimists see $60. Stable BBB- ratings from Fitch/S&P. Expect ~$500M FCF boost from recent acquisitions like HG Energy.
Outlook: $40 Feasible!
Volatility in gas prices and post-storm corrections are risks, plus options decay without quick moves.
But with insider buying, earnings positioning, and flow momentum, $40 looks realistic post-report – a ~16% gain aligning with key strikes!
GAS

NATGAS LOCAL SHORT|
✅NATGAS reacts from a higher-timeframe supply after an aggressive bullish impulse. Buy-side liquidity appears tapped, with weakening structure suggesting a corrective pullback toward the marked target zone. Time Frame 6H.
SHORT🔥
✅Like and subscribe to never miss a new idea!✅

Natural Gas – Trend Shift in Progress?After being bearish bearish for a while, Natural Gas has broken out of the descending red trendline, signaling a clear shift in momentum from bearish to bullish.
What stands out here is how price reacted after the breakout. Instead of selling off again, it held above the recent support zone and started building higher structure.
As long as this new bullish structure holds, the bias remains to the upside, with room for continuation toward higher levels. Any pullbacks that stay above support are, for me, opportunities to watch.
⚠️ Disclaimer: This is not financial advice. Always do your own research and manage risk properly.
📚 Stick to your trading plan regarding entries, risk, and management.
Good luck! 🍀
All Strategies Are Good; If Managed Properly!
~Richard Nasr

OIL INDIA BUY ON DIP WITH triangle support lineAs per my personal analysis OIL INDIA can be buy on dip.
Oil India Ltd is a Maharatna public sector oil & gas company engaged in upstream exploration, development, production and associated midstream activities.
• Current price range ~₹430–440 per share.
• 52-week range roughly ₹325–492, showing volatility and historical upside potential.
• Dividend yield ~2.5–2.7%.
• Valuation — P/E ~11-12x, PB ~1.25-1.3x, moderate leverage profile
As per technical it is in the early stage of ascending triangle which if it break out than upside is minimum 30-35% with SL can be placed at 10% lower side.
I am Not a SEBI Registered Research Analyst. Views shared are for educational purposes only. Please consult your financial advisor before investing.

The 2026 Gas Crisis: Texas Freezes and Europe Runs Dry
Going long on March Natural Gas futures at 2.95.
1) Weather Current models (ECMWF and GFS) show the formation of a blocking anticyclone. This is not just a short-term frost, but a prolonged cold that will linger in key consumption regions (Midwest, Northeast) at least until February 5–8.
2) Production Current models show the formation of a blocking anticyclone. This is not just a short-term frost, but a prolonged cold that will linger in key consumption regions at least until February 5–8. If the frost lasts for another 48–72 hours (as confirmed by the AO index), production could fall to 105 Bcf/d. Every lost unit (Bcf) under conditions of record demand is a direct driver of growth.
3) Export Corpus Christi (Train 5): Commissioning work began on the 5th line on January 14. This adds a constant demand of ~0.7 Bcf/d to the system (with potential up to 1.5 Bcf/d at full load). Exports will reach record levels in March.
4) Current Status of European UGS (Underground Gas Storage) Fill level: EU average is ~50.4% – 52% (according to GIE AGSI data). For comparison: at the same time in 2025, the level was above 65%. Due to prolonged cold weather and periods of low wind (Dunkelflaute), storage withdrawals in January are proceeding at rates 1.5–2 times higher than the norm. If Europe ends the winter with 20-25% in UGS, it will have to inject 35–40 billion m³ more gas in the summer than last year. This will create massive demand as early as March-April.
Blocking anticyclones (High-pressure blocking) over Greenland and Scandinavia look stable. This means that the cold pattern in Europe will last at least until February 5–10.
A negative AO "locks" heat over the Atlantic and "pushes" Arctic air masses onto the European continent. This leads to temperature anomalies 5–8°C below normal in Germany, France, and the Benelux countries.
The second cold wave (February) may turn out to be drier and frostier, which is critical for wind generation (Dunkelflaute), forcing power engineers to burn more gas.
We are moving along the lower bound of the historical range. At the current withdrawal rate (~607 million cubic meters per day), Europe risks reaching the 30% level as early as mid-February, which is a month earlier than usual. If current withdrawal rates persist, Europe will reach the 22-24% level by March 31 with a probability of 51%.
SUMMARY European UGS (Germany, France) have dropped to ~42%, the lowest figure in 5 years, and withdrawals are occurring at double speed. Total US demand (January 20–21) hit a historical high of 184 Bcf/d. With current production at 107 Bcf/d, the gap is being covered by massive withdrawals from UGS. The surplus of +106 Bcf (relative to the 5-year norm) that existed on Friday will be completely liquidated by the end of this week. The market is shifting from a state of "surplus" to a state of "massive deficit."
March is currently pricing in the risks that gas might not be sufficient for normal UGS filling in the summer of 2026.

Gas: Bear Trap Sprung. Get Ready for a Short Squeeze +10%Over the weekend, there was a GWDD jump from 344 to 359, which represents a 4.3% increase in expected consumption. 15 GWDD points in January are equivalent to an additional storage withdrawal of ~40–45 Bcf over the forecast period. The main cold is concentrated in the second week of the forecast. This is a golden time for traders, as this period is not yet priced into the market but is already visible to meteorological models.
Additionally, prices will be supported by production, which fell from 110 Bcf to 109.2 Bcf. Any further cooling in Texas could cause wellhead freeze-offs, which would instantly remove another 1-2 Bcf/d from the market; also, terminals are operating at 18.5–19.2 Bcf/d. This is a powerful foundation for the price.
Special attention should be paid to the latest COT report data (as of January 6, published Friday, January 9): the market is in a state of extreme speculative imbalance, with 1,000,000 short positions. Speculators aggressively opened new shorts (+41k contracts) exactly when the price approached the $3.15–$3.18 level. A net short position of 100,000 contracts means that a massive amount of money is bet on a warm winter. GWDD to 359 (+15 over the weekend) is exactly the news that the bears feared most. Given that many entered shorts late Friday, a +4-6% gap on Monday will lead to automatic triggering of stop-losses. Speculators are trapped in record shorts at the very bottom. Monday's opening promises to be volatile; it will not just be growth, but panic closing of short positions.
Those who sold on Friday at $3.20, hoping for $3.00, will see a 359/360 forecast. They have no opportunity for a smooth exit. They will close at market price, buying gas and pushing the price higher. Hedge funds have accumulated -100,000 net short contracts. This is a powder keg. The price increase at the opening will force them to close shorts, which will create a domino effect.
Entry point 3.30 or enter on the first pullback after the gap. Stop Loss $3.20 Take Profit $3.50, $3.58
Idea cancellation: If the 12Z evening run (today) or the 00Z morning run (Monday) shows sharp warming and the GWDD number falls below 352.

NATGAS Local Short! Sell!
Hello,Traders!
NATGAS is trading below a key horizontal supply, confirming bearish market structure after a strong sell-side displacement. Smart money distribution is evident, with price likely to retest the supply for mitigation before continuing toward lower liquidity pools. Time Frame 12H.
Sell!
Comment and subscribe to help us grow!
Check out other forecasts below too!
Disclosure: I am part of Trade Nation's Influencer program and receive a monthly fee for using their TradingView charts in my analysis.

CVX: The Perfect Storm (Macro Catalyst + Massive Channel)The news cycle is obsessed with the politics of the US & Venezuela, but the smart money is focused on the supply chain.
I created this chart to visualize how a massive fundamental catalyst (The Flags) is colliding with a decade-long technical structure (The Channel).
1. The Fundamental Catalyst (The Flags 🇺🇸🇻🇪) While the headlines are about "deals," the reality for the energy sector is about Market Access. Chevron ( NYSE:CVX ) is the primary US major with the "keys to the kingdom"—active OFAC licenses and operational Joint Ventures on the ground.
The Moat: While competitors are years away from navigating new contracts, CVX has a "Turnkey" advantage. The infrastructure is there. The pipes are connected.
The Shift: This opens the door to immediate heavy crude reserves for US Gulf Coast refineries, a massive tailwind for margins.
2. The Technical Structure (The Blue Channel)
📉 Politics is noise; Price is truth. Look at the geometry in the chart:
The Channel: Price has respected this massive Blue Ascending Channel for years. It defines the institutional trend.
The Coil: We have been compressing in a tight Triangle Consolidation (white lines) right at the breakout point.
The Target (TP Circle) : If we break out of this triangle, the standard technical measured move targets the upper rail of the channel. This aligns with the "TP" zone marked on the chart, projecting a move toward "Blue Sky" territory.
3. The Verdict Rarely do you see a "Perfect Storm" where a Macro Event (Venezuela reopening) aligns this cleanly with a Technical Setup (Triangle Breakout). The structure suggests the market is pricing in a "Supercycle" return for American energy access.
👇 The "Venezuela Reconstruction" Watchlist:
If the Venezuela thesis plays out, it's not just Chevron that moves. Here is the basket of related Energy, Services, and Refining stocks I am tracking for this cycle:
Majors: NYSE:CVX , NYSE:COP
Services (Boots on the Ground): NYSE:SLB , NSE:HAL , AMEX:OIH
Refiners (Heavy Crude Beneficiaries): NYSE:VLO , NYSE:MPC , NYSE:PSX , NYSE:DINO , NYSE:PBF
Sector ETF: AMEX:XLE
Which of these is your top pick for the reconstruction trade? Let me know in the comments!
Disclaimer: This analysis is for educational purposes regarding market reaction to geopolitical events. It is based on technical chart geometry and public news. Not investment advice.

GAS Buy/Long Signals (4H)Price is currently trading at a major key level, which is an important area to watch for a potential reaction. A strong bullish CH has formed on the chart, indicating a clear shift in market sentiment. The overall price structure is supportive of buy/long positions, and as long as this structure remains intact, our primary focus is on looking for long opportunities within this setup.
There are two well-defined entry zones marked on the chart, and positions should be built using a DCA strategy to optimize entries and manage risk effectively.
targets:2.030$ _ 2.151$_ 2.24$
Once the first target is reached, it is recommended to move the position to break-even to protect capital and secure a risk-free trade.
If you would like us to analyze a coin or altcoin for you, first like this post, then comment the name of your altcoin below.

NATGAS Will Grow! Buy!
Hello,Traders!
NATGAS reacted strongly from a higher-timeframe demand zone, showing clear absorption of sell-side liquidity. The impulsive bullish displacement suggests smart money accumulation, with structure now favoring a continuation toward the next upside liquidity pool.Time Frame 3H.
Buy!
Comment and subscribe to help us grow!
Check out other forecasts below too!
Disclosure: I am part of Trade Nation's Influencer program and receive a monthly fee for using their TradingView charts in my analysis.

Energy market cools down: oil and gas under pressureOver the past three months, global prices for oil (#BRENT/#WTI) and gas (#GAS) have declined noticeably. Benchmark oil grades Brent and WTI have lost around 11–12%, ending the year near multi-month lows. U.S. natural gas has also entered a correction after a strong rally at the start of the winter season.
Factors Behind the Decline:
#BRENT — U.S. production is at record levels, supplies from Brazil and other countries are rising, and some African oil remains unsold for extended periods. As a result, Brent struggles to stay above $60 , with any price rebound quickly sold off.
#WTI — Economic and fuel demand forecasts have weakened, while crude oil and fuel inventories continue to grow, making WTI more vulnerable to selling on pullbacks.
#GAS — In autumn, gas prices surged on colder weather forecasts and record exports, but later forecasts turned milder, production stayed high, and inventories remained sufficient — leading to a price correction.
Brent and WTI are ending the year amid a clear supply surplus: record U.S. output and rising supplies from other regions prevent prices from holding above recent levels, while OPEC+ has not yet moved toward aggressive production cuts. This suggests that the risk of a gradual further decline in oil prices may persist into early next year.
The gas market follows the same logic: high production, well-filled storage facilities, and a relatively mild winter create room for prices to move lower after the recent rally. Altogether, this makes #BRENT, #WTI, and #GAS vulnerable to a continuation of the correction unless there is an unexpected surge in demand or a sharp supply disruption.
FreshForex analysts note that in the coming months, the price trajectory of oil (#Brent/#WTI) and natural gas (#GAS) will largely depend on whether the supply surplus persists, how the global economy develops, and whether expectations of a mild winter are confirmed. In such an environment, investors and traders are advised to maintain strict risk management and closely monitor news from the commodity markets.


Natural Gas Week 50: -183 BCF Draw – Coldest Start in Years*Due to the platform's features, the charts are arranged in sequence from left to right, from the first to the ninth chart. The charts were created by our team and based on an analysis from Bloomberg and the EIA data. This analysis was conducted in cooperation with Anastasia Volkova, analyst of LSE.
Natural gas entered Week 50 with a historic shift, as the EIA reports a record 183 BCF storage withdrawal for Week 49 (December 5), crushing the 5-year average draw of -72 BCF and leaving inventories at 3,740 BCF-34 BCF below 2024 but still 56 BCF above the median. Cold weather and peak LNG exports earlier drove January futures above $5/MMBtu, but softening forecasts for mid-December have triggered profit-taking, easing near-term prices while 2026-27 contracts hold above the interquartile range.
Current prices compared to price dispersion 10 days before expiration by month since 2010
Last week, cold weather and record LNG flows provided strong support for prices. The situation has now evolved, with signs of a correction due to profit-taking and a softening of weather forecasts for the second half of December. However, fundamental drivers (a prolonged cold spell in key regions, peak LNG exports, and growing demand from the energy sector) remain in place and are keeping 2026 and 2027 contract prices above the interquartile range.
Forward curve compared to 2020-2025
The shape of the 2025 forward curve on nearby contracts is once again approaching the 2023–2024 ranges. Despite high volatility on nearby contracts, contracts with delivery in two years and beyond continue to show clear price stabilization at historically stable levels.
Current stocks and forecast for next week compared to 2020-2024
According to the forecast for week 49 (EIA report dated December 5), gas reserves in underground storage facilities will decrease by a record 183 BCF, which is 111 BCF below the average for the past five years. At the same time, reserves will reach 3,740 BCF, which is 34 BCF lower than in 2024, but 56 BCF higher than the five-year average.
HDD+CDD based on current NOAA data and forecast for the next two weeks compared to 1994-2024
Currently, the total HDD + CDD (heating and cooling degree days) indicators for all climatic regions of the United States are within the moderate range relative to the 30-year climate norm. According to meteorological model forecasts, degree days are expected to increase after December 11, reaching maximum levels by December 14-15, after which they will begin to decline, and by December 17-19, values may fall below seasonal norms.
HDD+CDD based on current NOAA data and forecast compared to 1994-2024 by region
As of December 10, another peak in degree days is expected in the coming week, with values exceeding the upper interquartile range in the central regions of EN, ES, WN, WS, and South Atlantic. After December 18, the weather is expected to stabilize and return to average levels and below.
Daily supply/demand difference compared to 2014-2024
On December 10, the difference between supply and demand in 2025 declines after abnormal growth and approaches the upper interquartile range for 2014–2024.
Number of days for delivery from warehouses
The graph shows the number of days of supply based solely on storage reserves, at current consumption levels. As of December 10, reserves are sufficient for approximately 27 days, which is three days less than in 2024, seven days below the average, and at the lower end of the 10-year range. With this level of reserves and consumption, even minor disruptions in production or spikes in demand could cause sharp price reactions, especially in late winter and early spring.
Filling level of European storage facilities
The overall fill rate of European gas storage facilities as of December 10 continues to decline and stands at 71.5% (-4.4% over the week), which is 10.5% below the average fill rate and 10% lower than last year.
Electricity generation by source
Compared to last week, gas generation in the US48 energy balance fell to 38.4% of the total (-5% over the week) on December 10, 2025. The share of nuclear generation remains around 18-19% and is below the 5-year low. The share of coal generation has grown and remains at an average of 19-20%. The share of wind (11.3%) and solar (4.0%) has increased slightly compared to last week.

NATGAS BULLISH CORRECTION AHEAD|LONG|
✅NATGAS draws back into a discounted pocket after purging sell-side liquidity, with price now poised to rebalance toward the inefficiency left above the last impulsive leg. Time Frame 1D.
LONG🚀
✅Like and subscribe to never miss a new idea!✅

NATGAS Free Signal! Sell!
Hello,Traders!
NATGAS price is reacting from a clear horizontal supply area after an aggressive displacement down, suggesting smart-money orderflow remains bearish. A retest into the imbalance aligns with premium pricing before continuation lower.
--------------------
Stop Loss: 4.724$
Take Profit: 4.527$
Entry: 4.623$
Time Frame: 3H
--------------------
Sell!
Comment and subscribe to help us grow!
Check out other forecasts below too!
Disclosure: I am part of Trade Nation's Influencer program and receive a monthly fee for using their TradingView charts in my analysis.

We would buy quite a lot of NATGAS when $2 levels are reachedWe hope the price will go down so we can buy cheaper

Hitting prior highs…Ok so I’m thinking we break this top as a fake out for bulls to get momentarily trapped. We will break the high earlier this month then bulls will pile in, price will pullback over the next day or two then we will continue our way toward $5 and above. Major move happened last week and I think there may be some refuel and exhaustion at the start of the week. I started a short to scalp but will be closing it immediately upon profit. Looking to pile in and rebuy when this contract retraces to 4.6ish.

NATGAS Free Signal! Sell!
Hello,Traders!
NATGAS is reacting inside a major horizontal supply zone after sweeping local buy-side liquidity. With displacement shifting bearish, a move toward the discounted target zone below becomes likely.
--------------------
Stop Loss: 4.693$
Take Profit: 4.549$
Entry Level: 4.636$
Time Frame: 4H
--------------------
Sell!
Comment and subscribe to help us grow!
Check out other forecasts below too!
Disclosure: I am part of Trade Nation's Influencer program and receive a monthly fee for using their TradingView charts in my analysis.

Natural Gas: Correction Ahead?Pullback expected after five weeks of growth; key levels 4.283 and 4.194 in focus.
This analysis is based on the Initiative Analysis (IA) method.
Hello, traders and investors!
After five weeks of steady growth, natural gas now appears to be preparing for a correction.
On the daily timeframe, a sideways range has formed, and the seller’s formal target inside this range has already been reached.
On the 4-hour timeframe, we also see a sideways structure, but seller initiative is active. The current seller target is 4.194.
A large volume cluster has formed at the upper boundary of the range, and the price is now breaking downward from that area. This zone becomes a broad seller area at the top of the range.
It’s important to watch how the price reacts around 4.283, which represents 50% of the trading range. For now, the expectation remains the same: a move toward 4.194.
A good area to look for short entries would be around 4.392, if the price gives a pullback into that zone.
Wishing you profitable trades!

A lot happening…Greater uptrend channel still in tact. New downtrend channel in formation but will probably be negated due to the shifting 4 hour timeframe. I think this contract will settle around 4.5 at expiration and the next contract (Jan) will drop like a rock on the switch. I am buying shorts for Jan 4.7 and above. And buying longs for this contract anything below 4.3


NATGAS Bearish Breakout! Sell!
Hello,Traders!
NATGAS broke down from the bearish wedge, signalling displacement and a shift in order flow. After sweeping internal liquidity, price is expected to expand lower toward the marked target demand zone. Time Frame 4H.
Sell!
Comment and subscribe to help us grow!
Check out other forecasts below too!
Disclosure: I am part of Trade Nation's Influencer program and receive a monthly fee for using their TradingView charts in my analysis.

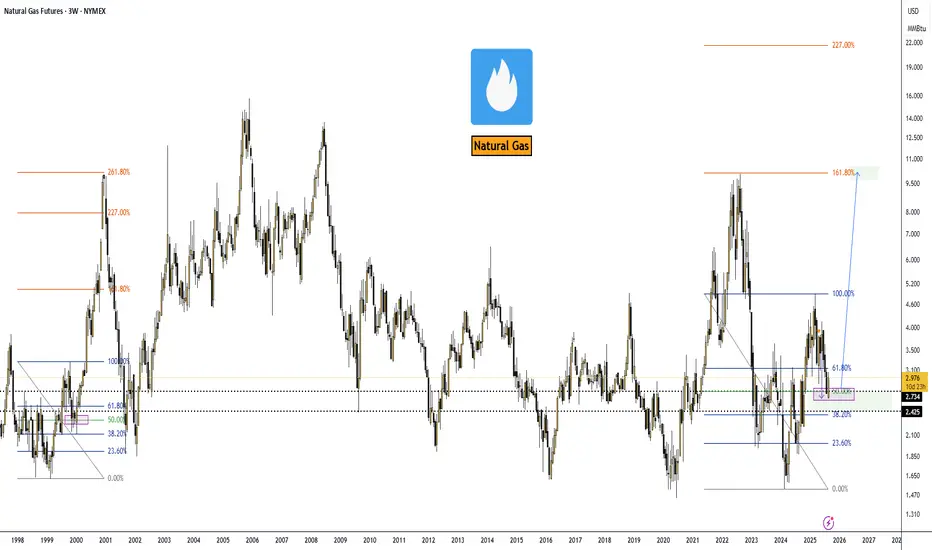
Natural Gas Market Outlook — September 01, 2025.VANTAGE:NG #NaturalGas #NatGas (NYMEX:NG1!) 🔵 Natural Gas Market Outlook — September 01, 2025.
Alright, here’s the skinny on NatGas. Back on April 28, 2025, I was calling for a dip into the $2.74 zone—and guess what? We tagged it right on schedule.
Now the game flips: I’m hunting long entries with the first serious target sitting at $10.00.
Could we overshoot? Absolutely. If momentum really gets cooking, the Fibo 227% extension lines up at roughly $21.00. But let’s not get greedy yet—$10 stays the main milestone for the next big leg.
Macro Drivers
➖ Exports: LNG shipments are the elephant in the room. Europe’s still thirsty, Asia’s paying up, and U.S. cargos are cashing in.
➖ Production: Flat. Shale guys aren’t rushing to flood the market unless we break above $3.20+.
➖ Geopolitics: Russia’s LNG rerouting and Middle East jitters keep a bid under global gas.
➖ Utilities & Consumers: Domestic demand is softer thanks to renewables transitions, but that’s a sideshow compared to export flows.
Big Picture
EIA pegs Henry Hub at $3.60 in 2025 and $4.30 in 2026, but frankly, that’s conservative. With demand from data centers, electrification, and global LNG growth, upside is more likely than not.
Trade View
➡️ I’m treating $2.74 as the cycle low. Any dips near that level look like golden tickets for long positioning into 2026. First pit stop: $10.00. If bulls get rowdy, keep an eye on $21.00 as the stretch target.
➡️ Bottom line: NatGas just gave us the reset we were waiting for. From here, risk/reward favors the long side. Strap in—it’s gonna be a volatile ride, but that’s where the money gets made.