GBP/JPY M30 | Bearish Drop OffMomentum: Bearish Drop
Price may push back up toward the sell entry, which acts as pullback resistance and aligns with the descending trendline, showing clear bearish pressure.
Sell Entry: 206.51
Pullback resistance
Stop Loss: 206.89
Pullback resistance
Take Profit: 205.91
Pullback support / 78.6% Fibonacci retracement
High Risk Investment Warning
Stratos Markets Limited (tradu.com ), Stratos Europe Ltd (tradu.com ):
CFDs are complex instruments and come with a high risk of losing money rapidly due to leverage. 70% of retail investor accounts lose money when trading CFDs with this provider. You should consider whether you understand how CFDs work and whether you can afford to take the high risk of losing your money.
Stratos Global LLC (tradu.com ): Losses can exceed deposits.
Please be advised that the information presented on TradingView is provided to Tradu (‘Company’, ‘we’) by a third-party provider (‘TFA Global Pte Ltd’). Please be reminded that you are solely responsible for the trading decisions on your account. Any information and/or content is intended entirely for research, educational and informational purposes only and does not constitute investment or consultation advice or investment strategy. The information is not tailored to the investment needs of any specific person and therefore does not involve a consideration of any of the investment objectives, financial situation or needs of any viewer that may receive it. Past performance is not a reliable indicator of future results. Actual results may differ materially from those anticipated in forward-looking or past performance statements. We assume no liability as to the accuracy or completeness of any of the information and/or content provided herein and the Company cannot be held responsible for any omission, mistake nor for any loss or damage including without limitation to any loss of profit which may arise from reliance on any information supplied by TFA Global Pte Ltd.
Gbp-jpy

Bullish continuation setup?GBP/JPY has bounced off the pivot, which is a pullback suppor,t and oculd rise to the 1st resistanc,e which acts as a swing high resistance.
Pivot: 205.30
1st Support: 204.27
1st Resistance: 207.15
Disclaimer:
The opinions given above constitute general market commentary and do not constitute the opinion or advice of IC Markets or any form of personal or investment advice.
Any opinions, news, research, analyses, prices, other information, or links to third-party sites contained on this website are provided on an "as-is" basis, are intended to be informative only, and are not advice, a recommendation, research, a record of our trading prices, an offer of, or solicitation for, a transaction in any financial instrument and thus should not be treated as such. The information provided does not involve any specific investment objectives, financial situation, or needs of any specific person who may receive it. Please be aware that past performance is not a reliable indicator of future performance and/or results. Past performance or forward-looking scenarios based upon the reasonable beliefs of the third-party provider are not a guarantee of future performance. Actual results may differ materially from those anticipated in forward-looking or past performance statements. IC Markets makes no representation or warranty and assumes no liability as to the accuracy or completeness of the information provided, nor any loss arising from any investment based on a recommendation, forecast, or any information supplied by any third party.

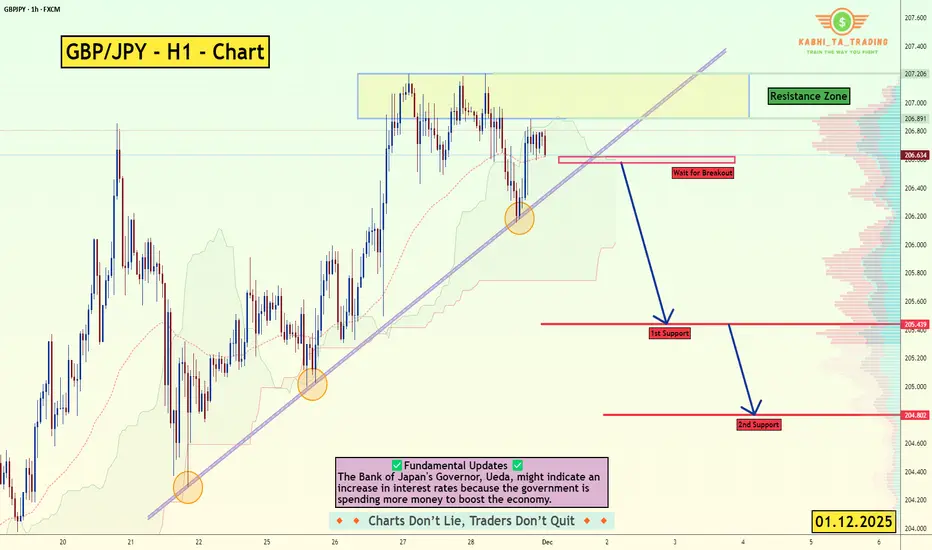
GBP/JPY - H1 - Japan Signals Rate Hike? (01.12.2025)📝 Technical Description FX:GBPJPY
GBP/JPY has been respecting the ascending trendline for several sessions, with multiple successful retests. However, price is now struggling inside the Resistance Zone, showing signs of exhaustion. A clean break below the trendline will confirm a short-term reversal toward lower support levels.
This setup requires patience → Wait for a breakout confirmation before execution
📊 Trading Plan (My View)🔻 Bearish Scenario (Primary Setup)
Wait for a clear trendline breakout and retest around 206.63–206.80 zone.
Once confirmed, expect a drop toward the next support areas.
🎯 Targets
1st Support: 205.439
2nd Support: 204.802
⚠️ Today’s Fundamental Update – 01 Dec 2025
1️⃣ Bank of Japan Policy Signal - BoJ Governor Ueda hinted at the possibility of interest rate increases, as government spending rises to support economic growth.
➡ This typically strengthens the JPY, adding downward pressure on GBP/JPY.
#gbpjpy #forex #forexanalysis #technicalanalysis #priceaction
#trendlinebreak #jpystrength #bojnews #fxsignals #tradingview
#chartpatterns #fundamentalanalysis #bearishsetup
⚠️ Disclaimer
This chart is for education only, not financial advice.
Always manage risk and use proper stop-loss.
❤️ Support the Work
If this analysis helps you, 👉 Please LIKE 👍, COMMENT 💬 & FOLLOW 🔔
Your support keeps the charts coming daily!
GBPJPY: BUY IT!Hello Traders
This is the 1Y channel!
we are around a strong static level and mid of a bullish channel!
As it is obvious!
If we see a smooth correction! We will enter the trade!
Have fun!

GBPJPY Strongly bullish long-termThe GBPJPY pair has been trading within a 6-year Channel Up and is currently on its 3rd Bullish Leg.
With the 1W MA100 (green trend-line) in firm Support, we expect this rally to continue long-term (even at a slower pace as per 1W RSI comparison with previous Legs) and rise by at least +36% in total (minimum on both previous Legs), targeting 240.00.
---
** Please LIKE 👍, FOLLOW ✅, SHARE 🙌 and COMMENT ✍ if you enjoy this idea! Also share your ideas and charts in the comments section below! This is best way to keep it relevant, support us, keep the content here free and allow the idea to reach as many people as possible. **
---
💸💸💸💸💸💸
👇 👇 👇 👇 👇 👇

GBPJPY rejected at the top of its 6-month Channel Up.The GBPJPY pair has been trading within a 6-month Channel Up and yesterday got rejected exactly on its top, making a Higher High. That completed a +3.92% rise, similar to all previous Bullish Legs of this pattern.
As a result, we technically view yesterday's rejection as the start of the new Bearish Leg. All previous corrections hit at least the 1D MA50 (blue trend-line) and we expect that to happen at 202.400 at least.
As for the most optimal buy, that will be on the 1D MA100 (green trend-line), which marked all previous four bottoms (Higher Lows) and initiated the Bullish Legs. The 1D RSI testing its Support Zone, is an additional buy indicator. We expect the next Bullish Leg to reach at least 208.250 (+3.92%).
---
** Please LIKE 👍, FOLLOW ✅, SHARE 🙌 and COMMENT ✍ if you enjoy this idea! Also share your ideas and charts in the comments section below! This is best way to keep it relevant, support us, keep the content here free and allow the idea to reach as many people as possible. **
---
💸💸💸💸💸💸
👇 👇 👇 👇 👇 👇

Bullish momentum to extend?GBP/JPY is falling towards the pivot and could bounce to the 1st resitance which acts as a swing high resistance.
Pivot: 202.63
1st Support: 201.83
1st Resistance: 204.84
Disclaimer:
The opinions given above constitute general market commentary and do not constitute the opinion or advice of IC Markets or any form of personal or investment advice.
Any opinions, news, research, analyses, prices, other information, or links to third-party sites contained on this website are provided on an "as-is" basis, are intended to be informative only, and are not advice, a recommendation, research, a record of our trading prices, an offer of, or solicitation for, a transaction in any financial instrument and thus should not be treated as such. The information provided does not involve any specific investment objectives, financial situation, or needs of any specific person who may receive it. Please be aware that past performance is not a reliable indicator of future performance and/or results. Past performance or forward-looking scenarios based upon the reasonable beliefs of the third-party provider are not a guarantee of future performance. Actual results may differ materially from those anticipated in forward-looking or past performance statements. IC Markets makes no representation or warranty and assumes no liability as to the accuracy or completeness of the information provided, nor any loss arising from any investment based on a recommendation, forecast, or any information supplied by any third party.

Bearish drop off?GBP/JPY is reacting off the resistance level, which is a pullback resistance zone, and could drop from this level toward our take-profit target.
Entry: 204.05
Why we like it:
Price is rejecting a pullback resistance level.
Stop Loss: 205.31
Why we like it:
It is positioned above a swing-high resistance level.
Take Profit: 201.94
Why we like it:
There is a pullback support level that aligns with the 38.2% Fibonacci retracement.
Enjoying your TradingView experience? Review us!
Please be advised that the information presented on TradingView is provided to Vantage (‘Vantage Global Limited’, ‘we’) by a third-party provider (‘Everest Fortune Group’). Please be reminded that you are solely responsible for the trading decisions on your account. There is a very high degree of risk involved in trading. Any information and/or content is intended entirely for research, educational and informational purposes only and does not constitute investment or consultation advice or investment strategy. The information is not tailored to the investment needs of any specific person and therefore does not involve a consideration of any of the investment objectives, financial situation or needs of any viewer that may receive it. Kindly also note that past performance is not a reliable indicator of future results. Actual results may differ materially from those anticipated in forward-looking or past performance statements. We assume no liability as to the accuracy or completeness of any of the information and/or content provided herein and the Company cannot be held responsible for any omission, mistake nor for any loss or damage including without limitation to any loss of profit which may arise from reliance on any information supplied by Everest Fortune Group.

Bullish momentum to extend?GBP/JPY has bounced off the pivot and could rise toward the first resistance level, which acts as a swing high resistance.
Pivot: 202.63
1st Support: 201.7
1st Resistance: 204.84
Disclaimer:
The opinions given above constitute general market commentary and do not constitute the opinion or advice of IC Markets or any form of personal or investment advice.
Any opinions, news, research, analyses, prices, other information, or links to third-party sites contained on this website are provided on an "as-is" basis, are intended to be informative only, and are not advice, a recommendation, research, a record of our trading prices, an offer of, or solicitation for, a transaction in any financial instrument and thus should not be treated as such. The information provided does not involve any specific investment objectives, financial situation, or needs of any specific person who may receive it. Please be aware that past performance is not a reliable indicator of future performance and/or results. Past performance or forward-looking scenarios based upon the reasonable beliefs of the third-party provider are not a guarantee of future performance. Actual results may differ materially from those anticipated in forward-looking or past performance statements. IC Markets makes no representation or warranty and assumes no liability as to the accuracy or completeness of the information provided, nor any loss arising from any investment based on a recommendation, forecast, or any information supplied by any third party.

GBPJPY H4 | Potential Bullish ReversalBased on the H4 chart analysis, we can see that the price has bounced off the buy entry, which is an overlap support, and could rise from this level to the take profit.
Buy entry is at 200.45, whichis an overlap support.
Stop loss is at 199.01, whichis a pullback support.
Take profit is at 202.03, whichis a pullback resistance.
Stratos Markets Limited (tradu.com ):
CFDs are complex instruments and come with a high risk of losing money rapidly due to leverage. 68% of retail investor accounts lose money when trading CFDs with this provider. You should consider whether you understand how CFDs work and whether you can afford to take the high risk of losing your money.
Stratos Europe Ltd (tradu.com ):
CFDs are complex instruments and come with a high risk of losing money rapidly due to leverage. 70% of retail investor accounts lose money when trading CFDs with this provider. You should consider whether you understand how CFDs work and whether you can afford to take the high risk of losing your money.

GBPJPY H4 | Major Resistance AheadGBP/JPY is rising towards the sell entry, which is an overlap resistance that aligns with the 50% Fibonacci retracement and could reverse from this level to the downside.
Sell entry is at 201.07, which is a swing low support.
Stop loss is at 203.04, which is a pullback resistance.
Take profit is at 197.77, which is a swing low support.
Stratos Markets Limited (tradu.com ):
CFDs are complex instruments and come with a high risk of losing money rapidly due to leverage. 68% of retail investor accounts lose money when trading CFDs with this provider. You should consider whether you understand how CFDs work and whether you can afford to take the high risk of losing your money.
Stratos Europe Ltd (tradu.com ):
CFDs are complex instruments and come with a high risk of losing money rapidly due to leverage. 70% of retail investor accounts lose money when trading CFDs with this provider. You should consider whether you understand how CFDs work and whether you can afford to take the high risk of losing your money.

GBPJPY H1 | Potential Bullish BouceBased on the H1 chart analysis, we could see the price fall to the buy entry, which is an overlap support that is slightly above the 51.8% Fibonacci retracement and could bounce from this level to the upside.
Buy entry is at 201.84, whic is an overlap support that is slightly above the 51.8% Fibonacci retracement.
Srop loss is at 200.70, which is a swing low support.
Take profit is at 203.23, which is an overlap resistance.
Stratos Markets Limited (tradu.com ):
CFDs are complex instruments and come with a high risk of losing money rapidly due to leverage. 68% of retail investor accounts lose money when trading CFDs with this provider. You should consider whether you understand how CFDs work and whether you can afford to take the high risk of losing your money.
Stratos Europe Ltd (tradu.com ):
CFDs are complex instruments and come with a high risk of losing money rapidly due to leverage. 70% of retail investor accounts lose money when trading CFDs with this provider. You should consider whether you understand how CFDs work and whether you can afford to take the high risk of losing your money.

GBPJPY H4 | Potential Bearish Drop in PlayBased on the H4 chart analysis, we can see that the price has rejected off the sell entry which is a pullback resistance and could drop from this level to the take profit.
Sell entry is at 201.96, which is a pullback resistance.
Stop loss is at 203.22, which is a pullbakc resistance.
Take profit is at 200.45, which is a pullback support that lines up with the 161.8% Fibonacci extension.
Stratos Markets Limited (tradu.com):
CFDs are complex instruments and come with a high risk of losing money rapidly due to leverage. 68% of retail investor accounts lose money when trading CFDs with this provider. You should consider whether you understand how CFDs work and whether you can afford to take the high risk of losing your money.
Stratos Europe Ltd (tradu.com ):
CFDs are complex instruments and come with a high risk of losing money rapidly due to leverage. 70% of retail investor accounts lose money when trading CFDs with this provider. You should consider whether you understand how CFDs work and whether you can afford to take the high risk of losing your money.

GBPJPY H1 | Falling Toward the 61.8% Fibonacci SupportBased on the H1 chart analysis, we could see the price fall towards the buy entry, which is a pullback support that aligns with the 61.8% Fibonacci retracement and could bounce from this level to the upside.
Buy entry is at 201.63, which is a pullback support that lines up with the 61.8% Fibonacci retracement.
Stop loss is at 201.08, which is a swing low support.
Take profit is at 202.80, whichis a pullback resistance.
Stratos Markets Limited (tradu.com ):
CFDs are complex instruments and come with a high risk of losing money rapidly due to leverage. 68% of retail investor accounts lose money when trading CFDs with this provider. You should consider whether you understand how CFDs work and whether you can afford to take the high risk of losing your money.
Stratos Europe Ltd (tradu.com ):
CFDs are complex instruments and come with a high risk of losing money rapidly due to leverage. 70% of retail investor accounts lose money when trading CFDs with this provider. You should consider whether you understand how CFDs work and whether you can afford to take the high risk of losing your money.

GBPJPY Eyes 202.900 Resistance as Correction Meets Downtrend!Hey Traders, in tomorrow’s trading session we are monitoring GBPJPY for a potential selling opportunity around the 202.900 zone. The pair remains within a broader downtrend and is currently in a corrective phase, approaching a key resistance area near 202.900 that aligns with the descending trend structure.
Structure:
Price has been forming lower highs and lower lows, maintaining bearish momentum. The current retracement toward 202.900 could provide an attractive area for sellers to re-enter the market in line with the dominant trend.
Key level in focus:
202.900 — a strong resistance confluence area, combining structural and technical significance.
Fundamentals:
Ongoing concerns over global risk sentiment and the potential for renewed JPY strength amid rising geopolitical tensions could further support downside pressure on GBPJPY.
Next move:
Monitoring price action closely around 202.900 — a rejection or bearish confirmation at this level could trigger the next leg lower within the prevailing downtrend.
Trade safe,
Joe.

GBPJPY H1 | Bullish Bounce Off Pullback SupportBased on the h1 chart analysis, we could see the price fall to the buy entry which is a pullback support that is slightly below the 61.8% Fibonacci retracement and could bounce from this level to the take profit.
Buy entry is at 201.44, which is a pullback support that is slightly below the 61.8% Fibonacci retracement.
Stop loss is at 200.67, which is a swing low support.
Take profit is at 202.79, which is a pullback resistance.
High Risk Investment Warning
Trading Forex/CFDs on margin carries a high level of risk and may not be suitable for all investors. Leverage can work against you.
Stratos Markets Limited (tradu.com ):
CFDs are complex instruments and come with a high risk of losing money rapidly due to leverage. 65% of retail investor accounts lose money when trading CFDs with this provider. You should consider whether you understand how CFDs work and whether you can afford to take the high risk of losing your money.
Stratos Europe Ltd (tradu.com ):
CFDs are complex instruments and come with a high risk of losing money rapidly due to leverage. 66% of retail investor accounts lose money when trading CFDs with this provider. You should consider whether you understand how CFDs work and whether you can afford to take the high risk of losing your money.
Stratos Global LLC (tradu.com ):
Losses can exceed deposits.
Please be advised that the information presented on TradingView is provided to Tradu (‘Company’, ‘we’) by a third-party provider (‘TFA Global Pte Ltd’). Please be reminded that you are solely responsible for the trading decisions on your account. There is a very high degree of risk involved in trading. Any information and/or content is intended entirely for research, educational and informational purposes only and does not constitute investment or consultation advice or investment strategy. The information is not tailored to the investment needs of any specific person and therefore does not involve a consideration of any of the investment objectives, financial situation or needs of any viewer that may receive it. Kindly also note that past performance is not a reliable indicator of future results. Actual results may differ materially from those anticipated in forward-looking or past performance statements. We assume no liability as to the accuracy or completeness of any of the information and/or content provided herein and the Company cannot be held responsible for any omission, mistake nor for any loss or damage including without limitation to any loss of profit which may arise from reliance on any information supplied by TFA Global Pte Ltd.
The speaker(s) is neither an employee, agent nor representative of Tradu and is therefore acting independently. The opinions given are their own, constitute general market commentary, and do not constitute the opinion or advice of Tradu or any form of personal or investment advice. Tradu neither endorses nor guarantees offerings of third-party speakers, nor is Tradu responsible for the content, veracity or opinions of third-party speakers, presenters or participants.

GBPJPY H1 | Heading Into 50% Fibonacci ResistanceGBP?JPY is rising towards the sell entry, which is a pullback resistance that aligns with the 50% Fibonacci retracement and could reverse from this level to the take profit.
Sell entry is at 202.58, which is a pullback resistance that aligns with the 50% Fibonacci retracement.
Stop loss is at 203.42, which is a multi-swing high resistance.
Take profit is at 201.43, which is a swing low support.
High Risk Investment Warning
Trading Forex/CFDs on margin carries a high level of risk and may not be suitable for all investors. Leverage can work against you.
Stratos Markets Limited (tradu.com ):
CFDs are complex instruments and come with a high risk of losing money rapidly due to leverage. 65% of retail investor accounts lose money when trading CFDs with this provider. You should consider whether you understand how CFDs work and whether you can afford to take the high risk of losing your money.
Stratos Europe Ltd (tradu.com ):
CFDs are complex instruments and come with a high risk of losing money rapidly due to leverage. 66% of retail investor accounts lose money when trading CFDs with this provider. You should consider whether you understand how CFDs work and whether you can afford to take the high risk of losing your money.
Stratos Global LLC (tradu.com ):
Losses can exceed deposits.
Please be advised that the information presented on TradingView is provided to Tradu (‘Company’, ‘we’) by a third-party provider (‘TFA Global Pte Ltd’). Please be reminded that you are solely responsible for the trading decisions on your account. There is a very high degree of risk involved in trading. Any information and/or content is intended entirely for research, educational and informational purposes only and does not constitute investment or consultation advice or investment strategy. The information is not tailored to the investment needs of any specific person and therefore does not involve a consideration of any of the investment objectives, financial situation or needs of any viewer that may receive it. Kindly also note that past performance is not a reliable indicator of future results. Actual results may differ materially from those anticipated in forward-looking or past performance statements. We assume no liability as to the accuracy or completeness of any of the information and/or content provided herein and the Company cannot be held responsible for any omission, mistake nor for any loss or damage including without limitation to any loss of profit which may arise from reliance on any information supplied by TFA Global Pte Ltd.
The speaker(s) is neither an employee, agent nor representative of Tradu and is therefore acting independently. The opinions given are their own, constitute general market commentary, and do not constitute the opinion or advice of Tradu or any form of personal or investment advice. Tradu neither endorses nor guarantees offerings of third-party speakers, nor is Tradu responsible for the content, veracity or opinions of third-party speakers, presenters or participants.

GBP/JPY | Breakout Alert! (16.10.2025)The GBP/JPY pair on the M30 timeframe presents a Potential Buying Opportunity due to a recent Formation of a Wedge Breakout Pattern.
This suggests a shift in momentum towards the upside and a higher likelihood of further advances in the coming hours.
Possible Long Trade:
Entry: Consider Entering A Long Position around Trendline Of The Pattern.
Target Levels:
1st Resistance – 204.11
2nd Resistance – 201.77
#GBPJPY #Forex #TradingSetup #TechnicalAnalysis #Breakout #SupportAndResistance #Ichimoku #FX #Bullish #TradePlan
🎁 Please hit the like button and
🎁 Leave a comment to support for My Post !
Your likes and comments are incredibly motivating and will encourage me to share more analysis with you.
Disclaimer: This is for educational and analytical purposes only. Trading involves significant risk and is not suitable for everyone. Do your own research (DYOR) and always manage your risk. Never trade with money you cannot afford to lose. "Charts Don't Lie, Traders Don't Quit."
Best Regards, KABHI_TA_TRADING
Thank you.

GBPJPY H4 | Sharp Bearish ReversalGBP/JPY is reacting off the sell entry, whichis a pullback resistance that lines up with the 23.6% Fibonacci retracement and could drop from this level to veto the downside.
Sell entry is at 202.51, which is a pullback resistance that aligns with the 23.6% Fibonacci retracement
Stop loss is at 204.01, which is a pullback resistance that lines up with he 61.8% Fibonacci retracement.
Take profit is at 200.41, whichis a pullback support that aligns with the 61.8% Fibonacci retracement.
High Risk Investment Warning
Trading Forex/CFDs on margin carries a high level of risk and may not be suitable for all investors. Leverage can work against you.
Stratos Markets Limited (tradu.com ):
CFDs are complex instruments and come with a high risk of losing money rapidly due to leverage. 65% of retail investor accounts lose money when trading CFDs with this provider. You should consider whether you understand how CFDs work and whether you can afford to take the high risk of losing your money.
Stratos Europe Ltd (tradu.com ):
CFDs are complex instruments and come with a high risk of losing money rapidly due to leverage. 66% of retail investor accounts lose money when trading CFDs with this provider. You should consider whether you understand how CFDs work and whether you can afford to take the high risk of losing your money.
Stratos Global LLC (tradu.com ):
Losses can exceed deposits.
Please be advised that the information presented on TradingView is provided to Tradu (‘Company’, ‘we’) by a third-party provider (‘TFA Global Pte Ltd’). Please be reminded that you are solely responsible for the trading decisions on your account. There is a very high degree of risk involved in trading. Any information and/or content is intended entirely for research, educational and informational purposes only and does not constitute investment or consultation advice or investment strategy. The information is not tailored to the investment needs of any specific person and therefore does not involve a consideration of any of the investment objectives, financial situation or needs of any viewer that may receive it. Kindly also note that past performance is not a reliable indicator of future results. Actual results may differ materially from those anticipated in forward-looking or past performance statements. We assume no liability as to the accuracy or completeness of any of the information and/or content provided herein and the Company cannot be held responsible for any omission, mistake nor for any loss or damage including without limitation to any loss of profit which may arise from reliance on any information supplied by TFA Global Pte Ltd.
The speaker(s) is neither an employee, agent nor representative of Tradu and is therefore acting independently. The opinions given are their own, constitute general market commentary, and do not constitute the opinion or advice of Tradu or any form of personal or investment advice. Tradu neither endorses nor guarantees offerings of third-party speakers, nor is Tradu responsible for the content, veracity or opinions of third-party speakers, presenters or participants.

GBPJPY starting a new multi-year Bear Cycle.The GBPJPY pair gave us recently (October 02, see chart below) an excellent buy signal on the 1D MA100, which instantly hit our 201.200 Target:
This time we view the market on the longest scale possible, the 1M time-frame, where since August 1990 High, it has been declining under the pressure of a Lower Highs trend-line.
The price is approaching that Lower Highs trend-line again after more than 18 years and in our perspective, sell any rally is the way to go long-term as it has much greater return potential than risk.
The first two Bearish Legs of this pattern (Bear Cycles) have declined by around -55%, the next one was shorter at -37.35%. As a result, we expect a minimum of -37.35% decline from the Lower Highs trend-line, which gives us a long-term Target of 136.000.
It is worth pointing out that the 1M Golden Cross that was priced in December 2023, is a formation that last time it emerged (December 2005), preceded a market Top. Also notice the presence of the 1M RSI Resistance Zone, which is holding since 1990 and when the RSI double tops there, it has been the most reliable Sell Signal.
-------------------------------------------------------------------------------
** Please LIKE 👍, FOLLOW ✅, SHARE 🙌 and COMMENT ✍ if you enjoy this idea! Also share your ideas and charts in the comments section below! This is best way to keep it relevant, support us, keep the content here free and allow the idea to reach as many people as possible. **
-------------------------------------------------------------------------------
💸💸💸💸💸💸
👇 👇 👇 👇 👇 👇

GBPJPY H1 | Signs of a Bearish ReversalBased on the H1 chart analysis, we can see that the price is reacting off the sell entry, which is a pullback resistance, and could drop from this level to the take profit.
Sell entry is at 202.22, whichis a pullback resistance.
Stop loss is at 203.41, which is a swing high resistance.
Take profit is at 200.49, whichis a pullback support that line sup with the 78.6% Fibonacci projection.
High Risk Investment Warning
Trading Forex/CFDs on margin carries a high level of risk and may not be suitable for all investors. Leverage can work against you.
Stratos Markets Limited (tradu.com):
CFDs are complex instruments and come with a high risk of losing money rapidly due to leverage. 65% of retail investor accounts lose money when trading CFDs with this provider. You should consider whether you understand how CFDs work and whether you can afford to take the high risk of losing your money.
Stratos Europe Ltd (tradu.com ):
CFDs are complex instruments and come with a high risk of losing money rapidly due to leverage. 66% of retail investor accounts lose money when trading CFDs with this provider. You should consider whether you understand how CFDs work and whether you can afford to take the high risk of losing your money.
Stratos Global LLC (tradu.com ):
Losses can exceed deposits.
Please be advised that the information presented on TradingView is provided to Tradu (‘Company’, ‘we’) by a third-party provider (‘TFA Global Pte Ltd’). Please be reminded that you are solely responsible for the trading decisions on your account. There is a very high degree of risk involved in trading. Any information and/or content is intended entirely for research, educational and informational purposes only and does not constitute investment or consultation advice or investment strategy. The information is not tailored to the investment needs of any specific person and therefore does not involve a consideration of any of the investment objectives, financial situation or needs of any viewer that may receive it. Kindly also note that past performance is not a reliable indicator of future results. Actual results may differ materially from those anticipated in forward-looking or past performance statements. We assume no liability as to the accuracy or completeness of any of the information and/or content provided herein and the Company cannot be held responsible for any omission, mistake nor for any loss or damage including without limitation to any loss of profit which may arise from reliance on any information supplied by TFA Global Pte Ltd.
The speaker(s) is neither an employee, agent nor representative of Tradu and is therefore acting independently. The opinions given are their own, constitute general market commentary, and do not constitute the opinion or advice of Tradu or any form of personal or investment advice. Tradu neither endorses nor guarantees offerings of third-party speakers, nor is Tradu responsible for the content, veracity or opinions of third-party speakers, presenters or participants.

GBPJPY H1 | Bullish Bounce OffBased on the H1 chart analysis, we can see that the price has bounced off the buy entry, which is a pullback support, and could rise from this level to the upside.
Buy entry is at 202.81, which is a pullback support.
Stop loss is at 202.11, which is an overlap support.
Take profit is at 204.05, which is a pullback resistance that lines up with the 61.8% Fibonacci retracement.
High Risk Investment Warning
Trading Forex/CFDs on margin carries a high level of risk and may not be suitable for all investors. Leverage can work against you.
Stratos Markets Limited (tradu.com ):
CFDs are complex instruments and come with a high risk of losing money rapidly due to leverage. 65% of retail investor accounts lose money when trading CFDs with this provider. You should consider whether you understand how CFDs work and whether you can afford to take the high risk of losing your money.
Stratos Europe Ltd (tradu.com ):
CFDs are complex instruments and come with a high risk of losing money rapidly due to leverage. 66% of retail investor accounts lose money when trading CFDs with this provider. You should consider whether you understand how CFDs work and whether you can afford to take the high risk of losing your money.
Stratos Global LLC (tradu.com ):
Losses can exceed deposits.
Please be advised that the information presented on TradingView is provided to Tradu (‘Company’, ‘we’) by a third-party provider (‘TFA Global Pte Ltd’). Please be reminded that you are solely responsible for the trading decisions on your account. There is a very high degree of risk involved in trading. Any information and/or content is intended entirely for research, educational and informational purposes only and does not constitute investment or consultation advice or investment strategy. The information is not tailored to the investment needs of any specific person and therefore does not involve a consideration of any of the investment objectives, financial situation or needs of any viewer that may receive it. Kindly also note that past performance is not a reliable indicator of future results. Actual results may differ materially from those anticipated in forward-looking or past performance statements. We assume no liability as to the accuracy or completeness of any of the information and/or content provided herein and the Company cannot be held responsible for any omission, mistake nor for any loss or damage including without limitation to any loss of profit which may arise from reliance on any information supplied by TFA Global Pte Ltd.
The speaker(s) is neither an employee, agent nor representative of Tradu and is therefore acting independently. The opinions given are their own, constitute general market commentary, and do not constitute the opinion or advice of Tradu or any form of personal or investment advice. Tradu neither endorses nor guarantees offerings of third-party speakers, nor is Tradu responsible for the content, veracity or opinions of third-party speakers, presenters or participants.

GBPJPY H1 | Potential Bearish Reversal at 50% Fib ResistanceBased on the H1 chart analysis, we could see the price rise to the sell entry, which is a pullback resistance that lines up with the 50% Fibonacci retracement and could reverse from this level to the downside.
Sell entry is at 203.74, which is a pullback resistance that aligns with the 50% Fibonacci retracement.
Stop loss is at 205.02, whichis a swing high resistance.
Take profit is at 201.25, which is a pullback support that aligns with the 50% Fibonacci retracement.
High Risk Investment Warning
Trading Forex/CFDs on margin carries a high level of risk and may not be suitable for all investors. Leverage can work against you.
Stratos Markets Limited (tradu.com ):
CFDs are complex instruments and come with a high risk of losing money rapidly due to leverage. 65% of retail investor accounts lose money when trading CFDs with this provider. You should consider whether you understand how CFDs work and whether you can afford to take the high risk of losing your money.
Stratos Europe Ltd (tradu.com ):
CFDs are complex instruments and come with a high risk of losing money rapidly due to leverage. 66% of retail investor accounts lose money when trading CFDs with this provider. You should consider whether you understand how CFDs work and whether you can afford to take the high risk of losing your money.
Stratos Global LLC (tradu.com ):
Losses can exceed deposits.
Please be advised that the information presented on TradingView is provided to Tradu (‘Company’, ‘we’) by a third-party provider (‘TFA Global Pte Ltd’). Please be reminded that you are solely responsible for the trading decisions on your account. There is a very high degree of risk involved in trading. Any information and/or content is intended entirely for research, educational and informational purposes only and does not constitute investment or consultation advice or investment strategy. The information is not tailored to the investment needs of any specific person and therefore does not involve a consideration of any of the investment objectives, financial situation or needs of any viewer that may receive it. Kindly also note that past performance is not a reliable indicator of future results. Actual results may differ materially from those anticipated in forward-looking or past performance statements. We assume no liability as to the accuracy or completeness of any of the information and/or content provided herein and the Company cannot be held responsible for any omission, mistake nor for any loss or damage including without limitation to any loss of profit which may arise from reliance on any information supplied by TFA Global Pte Ltd.
The speaker(s) is neither an employee, agent nor representative of Tradu and is therefore acting independently. The opinions given are their own, constitute general market commentary, and do not constitute the opinion or advice of Tradu or any form of personal or investment advice. Tradu neither endorses nor guarantees offerings of third-party speakers, nor is Tradu responsible for the content, veracity or opinions of third-party speakers, presenters or participants.
