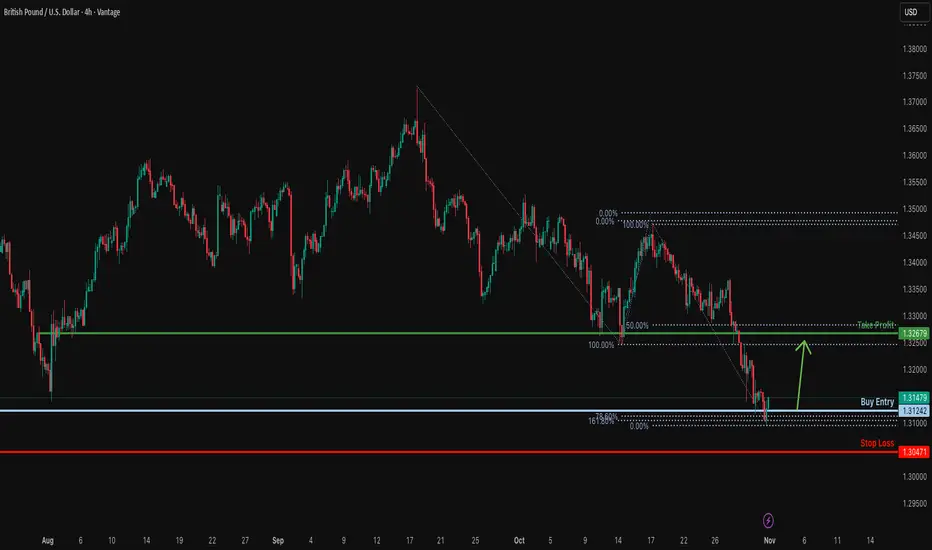
Bullish reversal off Fibonacci confluence?GBP/USD is reacting off the support level, which is a pullback support that is slightly above the 161.8% Fibonacci extension and the 78.6% Fibonacci projection, and could rise from this level to our take profit.
Entry: 1.3124
Why why we like it:
There is a pullback support that is slightly above the 161.8% Fibonacci extension and the 78.6% Fibonacci projection.
Stop loss: 1.3047
Why we like it:
There is a pullback support level.
Take profit: 1.3267
Why we like it:
There is an overlap resistance that is slightly below the 50% Fibonacci retracement.
Enjoying your TradingView experience? Review us!
Please be advised that the information presented on TradingView is provided to Vantage (‘Vantage Global Limited’, ‘we’) by a third-party provider (‘Everest Fortune Group’). Please be reminded that you are solely responsible for the trading decisions on your account. There is a very high degree of risk involved in trading. Any information and/or content is intended entirely for research, educational and informational purposes only and does not constitute investment or consultation advice or investment strategy. The information is not tailored to the investment needs of any specific person and therefore does not involve a consideration of any of the investment objectives, financial situation or needs of any viewer that may receive it. Kindly also note that past performance is not a reliable indicator of future results. Actual results may differ materially from those anticipated in forward-looking or past performance statements. We assume no liability as to the accuracy or completeness of any of the information and/or content provided herein and the Company cannot be held responsible for any omission, mistake nor for any loss or damage including without limitation to any loss of profit which may arise from reliance on any information supplied by Everest Fortune Group.
Gbp-usd
Bullish bounce off swing low support?The Cable (GBP/USD) has bounced off the pivot, which has been identified as a swing low support, and could rise to the 1st resistance that lines up with the 50% Fibonacci retracemnt.
Pivot: 1.3161
1st Support: 1.3051
1st Resistance: 1.3321
Disclaimer:
The above opinions given constitute general market commentary, and do not constitute the opinion or advice of IC Markets or any form of personal or investment advice.
Any opinions, news, research, analyses, prices, other information, or links to third-party sites contained on this website are provided on an "as-is" basis, are intended only to be informative, is not an advice nor a recommendation, nor research, or a record of our trading prices, or an offer of, or solicitation for a transaction in any financial instrument and thus should not be treated as such. The information provided does not involve any specific investment objectives, financial situation and needs of any specific person who may receive it. Please be aware, that past performance is not a reliable indicator of future performance and/or results. Past Performance or Forward-looking scenarios based upon the reasonable beliefs of the third-party provider are not a guarantee of future performance. Actual results may differ materially from those anticipated in forward-looking or past performance statements. IC Markets makes no representation or warranty and assumes no liability as to the accuracy or completeness of the information provided, nor any loss arising from any investment based on a recommendation, forecast or any information supplied by any third-party.

GBPUSD H1 | Heading Into Pullback ResistanceGBP/USD is rising towards the sell entry which is a pullback resistance that aligns with the 50% Fibonacci retracement and could reverse from this level to the take profit.
Sell entry is at 1.3310, which is a pullback resistance that aligns with the 50% Fibonacci retracement.
Stop loss is at 1.3339, which is a pullback resistance that lines up with the 78.6% Fibonacci retracement.
Take profit is at 1.3256, whichis a multi swing low support.
Stratos Markets Limited (tradu.com):
CFDs are complex instruments and come with a high risk of losing money rapidly due to leverage. 68% of retail investor accounts lose money when trading CFDs with this provider. You should consider whether you understand how CFDs work and whether you can afford to take the high risk of losing your money.
Stratos Europe Ltd (tradu.com ):
CFDs are complex instruments and come with a high risk of losing money rapidly due to leverage. 70% of retail investor accounts lose money when trading CFDs with this provider. You should consider whether you understand how CFDs work and whether you can afford to take the high risk of losing your money.

Bearish continuation?GBP/USD is rising towards the resistance level, which is a pullback resistance that aligns with the 50% Fibonacci retracement and could reverse from this level to our take profit.
Entry: 1.3308
Why we like it:
There is a pullback resistance level that aligns with the 50% Fibonacci retracement.
Stop loss: 1.3344
Why we like it:
There is a pullback resistance level that lines up with the 78.6% Fibonacci retracement.
Take profit: 1.3260
Why we like it:
There is a multi-swing low support.
Enjoying your TradingView experience? Review us!
Please be advised that the information presented on TradingView is provided to Vantage (‘Vantage Global Limited’, ‘we’) by a third-party provider (‘Everest Fortune Group’). Please be reminded that you are solely responsible for the trading decisions on your account. There is a very high degree of risk involved in trading. Any information and/or content is intended entirely for research, educational and informational purposes only and does not constitute investment or consultation advice or investment strategy. The information is not tailored to the investment needs of any specific person and therefore does not involve a consideration of any of the investment objectives, financial situation or needs of any viewer that may receive it. Kindly also note that past performance is not a reliable indicator of future results. Actual results may differ materially from those anticipated in forward-looking or past performance statements. We assume no liability as to the accuracy or completeness of any of the information and/or content provided herein and the Company cannot be held responsible for any omission, mistake nor for any loss or damage including without limitation to any loss of profit which may arise from reliance on any information supplied by Everest Fortune Group.

Heading into pullback resistance?The Cable (GBP/USD) is rising towards the pivot and oculd reverse to the 1st support whic acts as a pullback support.
Pivot: 1.3385
1st Support: 1.3295
1st Resistance: 1.3431
Disclaimer:
The above opinions given constitute general market commentary, and do not constitute the opinion or advice of IC Markets or any form of personal or investment advice.
Any opinions, news, research, analyses, prices, other information, or links to third-party sites contained on this website are provided on an "as-is" basis, are intended only to be informative, is not an advice nor a recommendation, nor research, or a record of our trading prices, or an offer of, or solicitation for a transaction in any financial instrument and thus should not be treated as such. The information provided does not involve any specific investment objectives, financial situation and needs of any specific person who may receive it. Please be aware, that past performance is not a reliable indicator of future performance and/or results. Past Performance or Forward-looking scenarios based upon the reasonable beliefs of the third-party provider are not a guarantee of future performance. Actual results may differ materially from those anticipated in forward-looking or past performance statements. IC Markets makes no representation or warranty and assumes no liability as to the accuracy or completeness of the information provided, nor any loss arising from any investment based on a recommendation, forecast or any information supplied by any third-party.

Falling towards multi swing low support?The Cable (GBP/USD) is falling towards the pivot, which is a multi swing low support and oculd bounce to the 1st resistance.
Pivot: 1.3177
1st Support: 1.3009
1st Resistance: 1.3483
Disclaimer:
The above opinions given constitute general market commentary, and do not constitute the opinion or advice of IC Markets or any form of personal or investment advice.
Any opinions, news, research, analyses, prices, other information, or links to third-party sites contained on this website are provided on an "as-is" basis, are intended only to be informative, is not an advice nor a recommendation, nor research, or a record of our trading prices, or an offer of, or solicitation for a transaction in any financial instrument and thus should not be treated as such. The information provided does not involve any specific investment objectives, financial situation and needs of any specific person who may receive it. Please be aware, that past performance is not a reliable indicator of future performance and/or results. Past Performance or Forward-looking scenarios based upon the reasonable beliefs of the third-party provider are not a guarantee of future performance. Actual results may differ materially from those anticipated in forward-looking or past performance statements. IC Markets makes no representation or warranty and assumes no liability as to the accuracy or completeness of the information provided, nor any loss arising from any investment based on a recommendation, forecast or any information supplied by any third-party.

Bearish continuation setup?GBP/USD is rising towards the resistance level which is a pullback resistance that aligns with the 61.8% Fibonacci retracement and could reverse from this level to our take profit.
Entry: 1.3332
Why we like it:
There is a pullback resistance that aligns with the 61.8% Fibonacci retracement.
Stop loss: 1.3372
Why we like it:
There is a pullback resistance that lines up with the 50% Fibonacci retracement.
Take profit: 1.3260
Why we like it:
There is a pullback support level.
Enjoying your TradingView experience? Review us!
Please be advised that the information presented on TradingView is provided to Vantage (‘Vantage Global Limited’, ‘we’) by a third-party provider (‘Everest Fortune Group’). Please be reminded that you are solely responsible for the trading decisions on your account. There is a very high degree of risk involved in trading. Any information and/or content is intended entirely for research, educational and informational purposes only and does not constitute investment or consultation advice or investment strategy. The information is not tailored to the investment needs of any specific person and therefore does not involve a consideration of any of the investment objectives, financial situation or needs of any viewer that may receive it. Kindly also note that past performance is not a reliable indicator of future results. Actual results may differ materially from those anticipated in forward-looking or past performance statements. We assume no liability as to the accuracy or completeness of any of the information and/or content provided herein and the Company cannot be held responsible for any omission, mistake nor for any loss or damage including without limitation to any loss of profit which may arise from reliance on any information supplied by Everest Fortune Group.

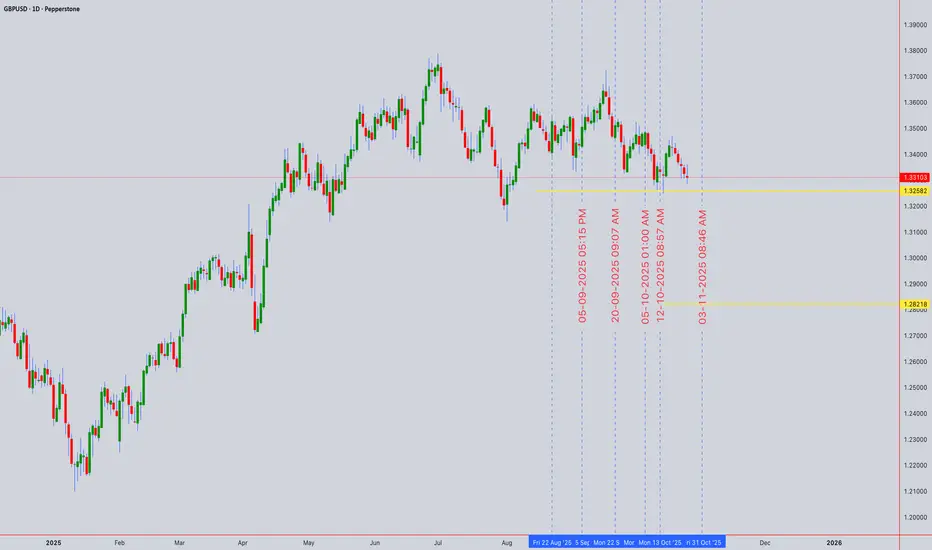
ULTIMATE TECHNICAL FORECAST: INTRADAY & SWING TRADE BLUEPRINT💷 GBPUSD (1.33103) - ULTIMATE TECHNICAL FORECAST: INTRADAY & SWING TRADE BLUEPRINT 💷
October 27-31, 2025 | Advanced Multi-Timeframe Deep Dive Analysis
🎯 EXECUTIVE MARKET OVERVIEW 🎯
Current Spot Price: 1.33103 | Analysis Date: Oct 25, 2025 | Scope: 5M-1D All Timeframes | Strategy Type: Intraday Scalp + Swing Trade
━━━━━━━━━━━━━━━━━━━━━━━━━━━━━━━━━
📊 1. COMPREHENSIVE TREND ANALYSIS & DOW THEORY FRAMEWORK 📊
🔍 Daily (1D) Timeframe - Primary Structural Trend
The daily chart exhibits strong bullish momentum with consolidation setup . Dow Theory validates higher highs and higher lows forming—confirmed uptrend structure intact. Elliott Wave analysis identifies completion of 5-wave impulse targeting 1.3450+ levels. RSI reading 52-58 (neutral-bullish momentum, no overbought exhaustion). VWAP at 1.3295 provides dynamic support during pullbacks.
⏰ 4H Timeframe - Swing Trade Foundation
Four-hourly shows bullish pennant formation near 1.3320-1.3350 resistance zone . Bollinger Bands tightening before directional breakout expected within 48 hours. RSI climbing 55-62 range (bullish acceleration without overbought signals). Ichimoku Cloud configuration: price above Kijun-sen & Chikou Span above price—textbook bullish alignment. Target extension: 1.3400-1.3450.
🔥 1H to 5M Intraday Structure - Micro Setup Confirmation
One-hour chart displays inverted cup-and-handle pattern completing near 1.3350. Perfect harmonic setup: Bullish Crab pattern identified at 1.3280 (D-point = swing entry opportunity). 30-minute timeframe shows clean EMA50 > EMA200 with price consolidating above both moving averages. Volume profile confirms institutional buying absorption between 1.3300-1.3320 range.
━━━━━━━━━━━━━━━━━━━━━━━━━━━━━━━━━
🎯 2. PRECISE ENTRY & EXIT ROADMAP + WYCKOFF METHODOLOGY 🎯
SWING TRADE ENTRIES (4H/1D): Buy breakout above 1.3350 with protective stop @ 1.3270 (Risk:Reward 1:3.5 minimum). Wyckoff Spring Pattern completed—institutional accumulation phase ending, markup phase commencing.
INTRADAY SCALP ENTRIES (5M/15M/30M): Multiple entry zones: (1) EMA crossover confirmation on 30M + RSI < 35 rejection = 1.3305-1.3315 entry | (2) Harmonic Crab PRZ completion = 1.3280-1.3290 aggressive entry | (3) VWAP bounce = 1.3295 support entry.
PRIMARY PROFIT TARGETS: 1D: 1.3450 | 4H: 1.3410 | 1H: 1.3375 | 15M: 1.3350 | Intraday scalp: 1.3330 (quick 25-30 pip gains).
STOP LOSS PLACEMENT PROTOCOL: Swing traders: 1.3260 (below double bottom structure) | Intraday: 1.3275 (tight 20-25 pip stops) | Scale stops with trailing risk management on breakouts.
💡 Elite Tip: Use Ichimoku Kijun-sen (26-period) as dynamic trailing stop—lock profits incrementally above 1.3350 breakout.
━━━━━━━━━━━━━━━━━━━━━━━━━━━━━━━━━
⚡ 3. REVERSAL IDENTIFICATION & CANDLESTICK PATTERN RECOGNITION ⚡
✅ BULLISH REVERSAL CONFIRMATIONS:
Piercing Line pattern on 30M chart signals buyer dominance at support. Inside Bar formations on 5M/15M indicate consolidation before directional breakout. Morning Star visible on 1H—textbook reversal signal. Inverted hammer near 1.3280 confirms seller rejection, bull continuation thesis. Ichimoku Chikou Span successfully broke above price action = confirmed reversal completion.
⛔ BEARISH REVERSAL WARNINGS & RESISTANCE REJECTION ZONES:
If price fails to sustain above 1.3350 with declining volume spike, Evening Star pattern potential on 4H. Gann resistance at 1.3390 acts as strong rejection zone. RSI divergence monitoring critical: if lower highs appear while price makes higher highs, exhaustion signal triggers short setup. VWAP rejection combined with upper Bollinger Band touching = sell signal activation.
⚠️ Critical Decision Level: 1.3345-1.3355 acts as BREAKOUT THRESHOLD. Clean close above = Bullish Continuation | Multiple rejections = Reversal to 1.3280
━━━━━━━━━━━━━━━━━━━━━━━━━━━━━━━━━
🚀 4. BREAKOUT DYNAMICS & ADVANCED PATTERN FORMATIONS 🚀
✅ PRIMARY BULLISH BREAKOUT SCENARIO (70% PROBABILITY):
Bullish pennant breakout above 1.3350 on 4H timeframe with volume confirmation (need 25%+ spike above 20-period MA). Elliott Wave target: 1.3450-1.3550 (5th wave extension in new markup cycle). Bollinger Band upper band at 1.3420 = natural extended target. Cup-and-handle completion projects 1.3400+ move within 5-7 trading days.
🔷 HARMONIC PATTERN PRECISION LEVELS:
Bullish Crab pattern (XA:BC 0.618) D-point entry: 1.3280 with target 1.3450+ (161.8% extension). Bat pattern on daily timeframe suggesting potential for extended 1.3550 level (extreme scenario). Butterfly pattern confluence identifies 1.3380 as intermediate resistance-turn zone.
⚠️ BEARISH PATTERN - RISING WEDGE TRAP (30% PROBABILITY):
If momentum fails at 1.3350, 4H chart displays rising wedge formation that could collapse bearishly to 1.3220. Stochastic divergence on 1H indicates potential pullback. Bollinger Band squeeze suggests breakout imminent within 36-48 hours in either direction. Monitor volume for declining participation—wedge failure precursor.
━━━━━━━━━━━━━━━━━━━━━━━━━━━━━━━━━
📈 5. VOLATILITY METRICS & PRICE ACTION DYNAMICS 📈
🌊 Bollinger Bands - Volatility Expansion Analysis:
Band width compressing dramatically on 1D (225 pips) - tightest in 14 days. This band contraction historically precedes major volatility breakout (Average True Range expansion expected). Intraday Bollinger Bands (5M/15M) showing normal expansion—price oscillating within middle band indicating equilibrium phase. Midband (SMA 20) at 1.3320 acts as equilibrium pivot.
📍 SUPPORT & RESISTANCE ARCHITECTURE:
CRITICAL SUPPORT LEVELS: 1.3320 (Weekly pivot) | 1.3300 (VWAP daily) | 1.3280 (Harmonic D-point) | 1.3260 (Double bottom structure)
MAJOR RESISTANCE ZONES: 1.3350 (Pennant apex breakout zone) | 1.3390 (Gann angle resistance) | 1.3420 (Bollinger upper band) | 1.3450 (Elliott wave target)
VWAP PROFILE: Daily VWAP: 1.3300 (holding strong support) | Weekly VWAP: 1.3285 (secondary support level)
📊 Moving Average Convergence & Trend Confirmation:
EMA 50 > EMA 200 across ALL timeframes (primary bullish signal alignment). SMA 20 above SMA 50 on 1H/4H = sustained buy pressure. 5M chart: Recent EMA50/EMA200 crossover just completed—intraday uptrend initiation signal. Price maintaining superior positioning above all key MAs confirms Wyckoff accumulation phase is concluding, markup phase beginning.
🎯 OVERBOUGHT/OVERSOLD MOMENTUM METRICS:
RSI Status: 55-62 range (neutral-bullish, healthy, NOT overbought—room for upside run). Stochastic on 15M: 48-58 zone with positive momentum trajectory. Ichimoku RSI indicator below midline—powerful upside potential remaining. CCI on 5M near +85 (strong momentum without extreme overbought exhaustion). Fast Stochastic below 80 = safe bullish continuation setup.
━━━━━━━━━━━━━━━━━━━━━━━━━━━━━━━━━
🎓 6. ADVANCED TECHNICAL THEORY SYNTHESIS & FRAMEWORKS 🎓
⭐ ELLIOTT WAVE ARCHITECTURE: 5-wave impulse completion identified | Currently Wave 1 (up) of new larger cycle | Target minimum: 1.3450 | Fibonacci projection: 161.8% extension = 1.3550 maximum target within 10 trading days
⭐ GANN THEORY APPLICATION: 45-degree angle support @ 1.3295 | Square of Nine resistance @ 1.3390 | Time-Price intersection: 7-8 trading days for next major swing completion | Gann fan resistance @ 1.3410
⭐ WYCKOFF METHOD STAGE: Spring pattern successfully tested support zone | Markup phase INITIATED | Schiff accumulation completion signals (Volume analysis, Price action dynamics) | Expected rally: 1.3350-1.3450 over 5-7 trading days | Watch for climactic buying volume surge confirming institutional participation
⭐ DOW THEORY CONFIRMATION: Higher highs (1.3380+) | Higher lows (1.3280+) | Volume confirming uptrend | Trend remains in full bullish alignment
━━━━━━━━━━━━━━━━━━━━━━━━━━━━━━━━━
✨ COMPLETE TRADING BATTLE PLAN ✨
🔥 PRIMARY BULLISH SCENARIO (70% Probability):
Entry Zone: 1.3345-1.3350 (breakout) or 1.3305-1.3315 (pullback entry)
Stop Loss: 1.3265 | Target 1: 1.3380 | Target 2: 1.3420 | Target 3: 1.3450
Risk/Reward: 1:3.5+ | Hold Duration: Swing (3-5 days) + Intraday scalp (1-3 hours)
Conviction Level: 70% | Setup Quality: Premium
⚠️ SECONDARY BEARISH SCENARIO (30% Probability - Contingency):
Trigger: Double rejection at 1.3350 + Declining volume + Rising wedge collapse
Entry: 1.3340 short | Stop: 1.3360 | Target: 1.3280 (pullback expectation)
Probability: 30% | Pattern: Rising wedge breakdown
⏱️ OPTIMAL TIMEFRAME HIERARCHY: 4H (swing base structure) + 1H (entry confirmation) + 15M/5M (execution precision)
💰 POSITION SIZING RULES: Risk max 1-2% portfolio per trade | Scale entries on 50% pullbacks | Trail stops above VWAP
🔔 CRITICAL PRICE ALERTS: Buy alert @ 1.3350 | Stop loss alarm @ 1.3265 | Partial profit alert @ 1.3380 | Full target @ 1.3450
📱 EXECUTION STRATEGY: Aggressive breakout entries (20% position) + Patient pullback entries (80% position) = balanced risk approach
━━━━━━━━━━━━━━━━━━━━━━━━━━━━━━━━━
⚖️ IMPORTANT DISCLAIMER: This analysis is for educational & informational purposes only. NOT financial advice. Trade at your own risk using proper risk management protocols. Past performance does not guarantee future results. Always consult licensed financial advisors before trading.
GBPUSD H1 | Bullish Rebound from Strong Support LevelGBP/USD is reacting off the buy entry whic is a multi swing low support and oculd potentially rise from this level to the take profit.
Buy entry is at 1.3315, which is a multi-swing low support.
Stop loss is at 1.3283, whic is a pullback support that aligns with rhe 127.2% Fibonacci extension.
Take profit is at 1.3362, which is an overlap resistance.
Stratos Markets Limited (tradu.com ):
CFDs are complex instruments and come with a high risk of losing money rapidly due to leverage. 68% of retail investor accounts lose money when trading CFDs with this provider. You should consider whether you understand how CFDs work and whether you can afford to take the high risk of losing your money.
Stratos Europe Ltd (tradu.com ):
CFDs are complex instruments and come with a high risk of losing money rapidly due to leverage. 70% of retail investor accounts lose money when trading CFDs with this provider. You should consider whether you understand how CFDs work and whether you can afford to take the high risk of losing your money.

Bearish drop off?GBP/USD has rejected off the resistance level which is a pullback resistance that aligns with the 38.2% Fibonacci retracement and could drop from this level to our take profit.
Entry: 1.3363
Why we like it:
There is a pullback resistance that aligns with the 38.2% Fibonacci retracement.
Stop loss: 1.3438
Why we like it:
There is a pullback resistance level that aligns with the 78.6% Fibonacci retracement.
Take profit: 1.3260
Why we like it:
There is a multi-swing low support level that aligns with the 161.8% Fibonacci extension.
Enjoying your TradingView experience? Review us!
Please be advised that the information presented on TradingView is provided to Vantage (‘Vantage Global Limited’, ‘we’) by a third-party provider (‘Everest Fortune Group’). Please be reminded that you are solely responsible for the trading decisions on your account. There is a very high degree of risk involved in trading. Any information and/or content is intended entirely for research, educational and informational purposes only and does not constitute investment or consultation advice or investment strategy. The information is not tailored to the investment needs of any specific person and therefore does not involve a consideration of any of the investment objectives, financial situation or needs of any viewer that may receive it. Kindly also note that past performance is not a reliable indicator of future results. Actual results may differ materially from those anticipated in forward-looking or past performance statements. We assume no liability as to the accuracy or completeness of any of the information and/or content provided herein and the Company cannot be held responsible for any omission, mistake nor for any loss or damage including without limitation to any loss of profit which may arise from reliance on any information supplied by Everest Fortune Group.

GBPUSD Channel Down targeting at least 1.3250The GBPUSD pair has been trading within a 1-month Channel Down pattern since the September 23 rejection on its 4H MA200 (orange trend-line). In fact, we are currently on the third Bearish Leg of this pattern, all of which have been initiated by 4H MA200 rejections.
We expect the price to target at least 1.3250, where it might technically rebound due to the presence of the 1D MA200 (red trend-line). If it breaks though, we can see a -2.07% standard Bearish Leg extension to 1.32000, which would make a perfect technical Lower Low at the bottom of the Channel Down.
-------------------------------------------------------------------------------
** Please LIKE 👍, FOLLOW ✅, SHARE 🙌 and COMMENT ✍ if you enjoy this idea! Also share your ideas and charts in the comments section below! This is best way to keep it relevant, support us, keep the content here free and allow the idea to reach as many people as possible. **
-------------------------------------------------------------------------------
💸💸💸💸💸💸
👇 👇 👇 👇 👇 👇

Bullish bounce for the Cable?The price is falling towards the pivot which is a pullback support that aligns with the 50% Fibonacci retracement and could bounce to the 1st resistance, which acts as an overlap resistance.
Pivot: 1.3344
1st Support: 1.3310
1st Resistance: 1.3393
Disclaimer:
The above opinions given constitute general market commentary, and do not constitute the opinion or advice of IC Markets or any form of personal or investment advice.
Any opinions, news, research, analyses, prices, other information, or links to third-party sites contained on this website are provided on an "as-is" basis, are intended only to be informative, is not an advice nor a recommendation, nor research, or a record of our trading prices, or an offer of, or solicitation for a transaction in any financial instrument and thus should not be treated as such. The information provided does not involve any specific investment objectives, financial situation and needs of any specific person who may receive it. Please be aware, that past performance is not a reliable indicator of future performance and/or results. Past Performance or Forward-looking scenarios based upon the reasonable beliefs of the third-party provider are not a guarantee of future performance. Actual results may differ materially from those anticipated in forward-looking or past performance statements. IC Markets makes no representation or warranty and assumes no liability as to the accuracy or completeness of the information provided, nor any loss arising from any investment based on a recommendation, forecast or any information supplied by any third-party.

GBP/USD – Sell Entry (H1 – Channel Pattern)
The GBP/USD Pair, Price has been trading within a Channel Pattern on the H1 chart, forming consistent lower highs and lower lows. Price action is now testing the lower boundary of the pattern, signalling a possible breakdown.
✅Market Context:
1️⃣Downward structure building inside the pattern.
2️⃣Sellers are showing strength near support levels.
3️⃣Breakdown below the trendline indicates momentum continuation toward lower zones.
✅Trade Plan:
Entry: Sell after confirmed breakdown below the support (Candle close below trendline or retest of the breakout).
💰Take Profit (TP): At the Key Zone – major support area identified ahead.
🛑Stop Loss (SL): Above the pattern structure / recent swing high.
✅Psychological Discipline:
1️⃣Stick to plan – No Revenge Trades.
2️⃣Accept losing trades as part of the strategy.
3️⃣Risk only 1–2% of your account balance per trade.
💬 Support the community: If you found this useful, drop a 👍 like and share your thoughts in the comments!
⚠️ Disclaimer: This analysis is for educational purposes only and does not constitute financial advice. Forex trading involves high risk. Trade only with capital you can afford to lose and always do your own research.

GBP/USD - Fundamental Drive Ahead! (21.10.2025)🧠 Setup Overview:
GBP/USD has broken below its rising trendline after testing the 1.3470 resistance zone multiple times. The pair is under fundamental selling pressure, fueled by risk aversion and renewed U.S. dollar strength.
Fundamental Drivers:
1️⃣ U.S. markets gained as President Trump decided not to impose very high tariffs on Chinese goods, which temporarily boosted sentiment.
2️⃣ However, investors are now digesting U.S. credit risks and US–China trade tensions, both adding safe-haven demand to the USD.
3️⃣ Meanwhile, the UK economy faces uncertainty from softer consumer spending and weak housing data — further limiting GBP’s upside potential.
📉 Technical Plan:
Bias: Bearish below 1.3400
Structure: Trendline breakdown confirmed
Cloud Resistance: Adds confluence to downside momentum
Next Levels to Watch:
🟥 1st Support: 1.3349
🟥 2nd Support: 1.3310
📊 If price closes below 1.3349 on the 30-min chart, further selling pressure may extend toward 1.3310 and possibly deeper if fundamentals align.
#GBPUSD #Forex #TechnicalAnalysis #PriceAction #Ichimoku #TrendlineBreak #FXMarket #BearishSetup #TradingView #KABHI_TA_TRADING
⚠️ Disclaimer:
This analysis is for educational purposes only — not financial advice. Always manage your risk and use proper position sizing before entering any trade.
📣 Support My Work
If you found this analysis useful — LIKE 👍, COMMENT 💬, and FOLLOW 🔔 to stay updated with daily Forex setups!

GBPUSD H1 | Bearish Continuation SetupCable (GBP/USD) has rejected off the sell entry which is a pullback resistance and could potentially drop from this level to the downside.
Sell entry is at 1.3390, which is a pullback resistance.
Stop loss is at 1.3439, whichis a pullback resistance.
Take profit is at 1.3327, which is an overlap support that is slightly below the 61.8% Fibonacci retracement.
High Risk Investment Warning
Trading Forex/CFDs on margin carries a high level of risk and may not be suitable for all investors. Leverage can work against you.
Stratos Markets Limited (tradu.com ):
CFDs are complex instruments and come with a high risk of losing money rapidly due to leverage. 65% of retail investor accounts lose money when trading CFDs with this provider. You should consider whether you understand how CFDs work and whether you can afford to take the high risk of losing your money.
Stratos Europe Ltd (tradu.com ):
CFDs are complex instruments and come with a high risk of losing money rapidly due to leverage. 66% of retail investor accounts lose money when trading CFDs with this provider. You should consider whether you understand how CFDs work and whether you can afford to take the high risk of losing your money.
Stratos Global LLC (tradu.com ):
Losses can exceed deposits.
Please be advised that the information presented on TradingView is provided to Tradu (‘Company’, ‘we’) by a third-party provider (‘TFA Global Pte Ltd’). Please be reminded that you are solely responsible for the trading decisions on your account. There is a very high degree of risk involved in trading. Any information and/or content is intended entirely for research, educational and informational purposes only and does not constitute investment or consultation advice or investment strategy. The information is not tailored to the investment needs of any specific person and therefore does not involve a consideration of any of the investment objectives, financial situation or needs of any viewer that may receive it. Kindly also note that past performance is not a reliable indicator of future results. Actual results may differ materially from those anticipated in forward-looking or past performance statements. We assume no liability as to the accuracy or completeness of any of the information and/or content provided herein and the Company cannot be held responsible for any omission, mistake nor for any loss or damage including without limitation to any loss of profit which may arise from reliance on any information supplied by TFA Global Pte Ltd.
The speaker(s) is neither an employee, agent nor representative of Tradu and is therefore acting independently. The opinions given are their own, constitute general market commentary, and do not constitute the opinion or advice of Tradu or any form of personal or investment advice. Tradu neither endorses nor guarantees offerings of third-party speakers, nor is Tradu responsible for the content, veracity or opinions of third-party speakers, presenters or participants.

GBPUSD: Breakout and Potential RetraceHey Traders, in today's trading session we are monitoring GBPUSD for a buying opportunity around 1.33600 zone, GBPUSD was trading in a downtrend and successfully managed to break it out. Currently is in a correction phase in which it is approaching the retrace area at 1.33600 support and resistance zone.
Trade safe, Joe.

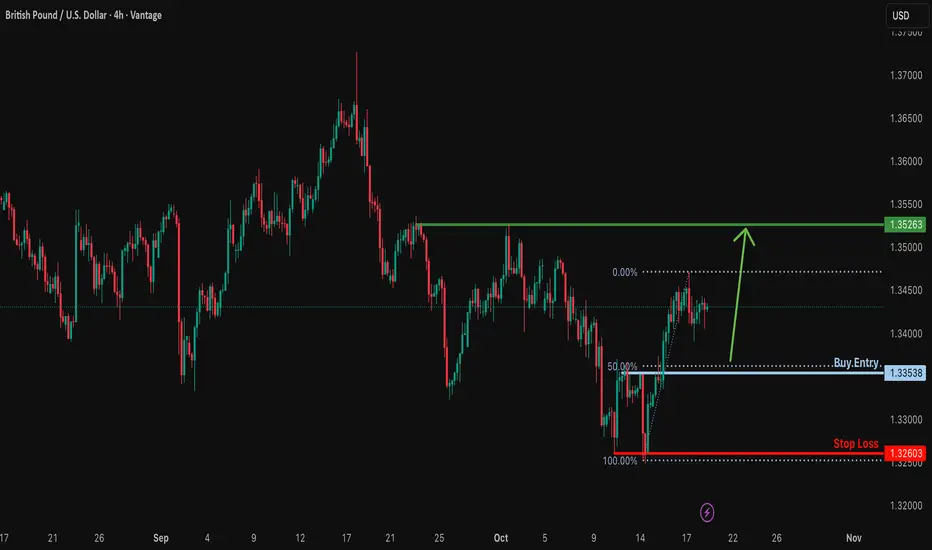
Falling towards 50% Fibonacci support?GBP/USD is fallig towards the support level which is a pullback support that aligns with the 50% Fibonacci retracement and could bounce from this level to our take profit.
Entry: 1.3353
Why we like it:
There is a pullback support that lines up with the 50% Fibonacci retracement.
Stop loss: 1.3260
Why we like it:
There is a multi swing low support.
Take profit: 1.3526
Why we like it:
There is a multi swing high resistance level.
Enjoying your TradingView experience? Review us!
Please be advised that the information presented on TradingView is provided to Vantage (‘Vantage Global Limited’, ‘we’) by a third-party provider (‘Everest Fortune Group’). Please be reminded that you are solely responsible for the trading decisions on your account. There is a very high degree of risk involved in trading. Any information and/or content is intended entirely for research, educational and informational purposes only and does not constitute investment or consultation advice or investment strategy. The information is not tailored to the investment needs of any specific person and therefore does not involve a consideration of any of the investment objectives, financial situation or needs of any viewer that may receive it. Kindly also note that past performance is not a reliable indicator of future results. Actual results may differ materially from those anticipated in forward-looking or past performance statements. We assume no liability as to the accuracy or completeness of any of the information and/or content provided herein and the Company cannot be held responsible for any omission, mistake nor for any loss or damage including without limitation to any loss of profit which may arise from reliance on any information supplied by Everest Fortune Group.
GBPUSD H4 | Falling Towards Pullback SupportGBP/USD is falling towards the buy entry which is a pullback support that aligns with the 50% Fibonacci retracement and the 100% Fibonacci projection and could bounce from this level to the upside.
Buy entry is at 1.3361, which is a pullback support that aligns with the 50% Fibonacci retracement and the 100% Fibonacci projection.
Stop loss is at 1.3274, which is a pullback support.
Take profit is at 1.3533, which is an overlap resistance that aligns with the 61.8% Fibonacci retracement.
High Risk Investment Warning
Trading Forex/CFDs on margin carries a high level of risk and may not be suitable for all investors. Leverage can work against you.
Stratos Markets Limited (tradu.com ):
CFDs are complex instruments and come with a high risk of losing money rapidly due to leverage. 65% of retail investor accounts lose money when trading CFDs with this provider. You should consider whether you understand how CFDs work and whether you can afford to take the high risk of losing your money.
Stratos Europe Ltd (tradu.com ):
CFDs are complex instruments and come with a high risk of losing money rapidly due to leverage. 66% of retail investor accounts lose money when trading CFDs with this provider. You should consider whether you understand how CFDs work and whether you can afford to take the high risk of losing your money.
Stratos Global LLC (tradu.com ):
Losses can exceed deposits.
Please be advised that the information presented on TradingView is provided to Tradu (‘Company’, ‘we’) by a third-party provider (‘TFA Global Pte Ltd’). Please be reminded that you are solely responsible for the trading decisions on your account. There is a very high degree of risk involved in trading. Any information and/or content is intended entirely for research, educational and informational purposes only and does not constitute investment or consultation advice or investment strategy. The information is not tailored to the investment needs of any specific person and therefore does not involve a consideration of any of the investment objectives, financial situation or needs of any viewer that may receive it. Kindly also note that past performance is not a reliable indicator of future results. Actual results may differ materially from those anticipated in forward-looking or past performance statements. We assume no liability as to the accuracy or completeness of any of the information and/or content provided herein and the Company cannot be held responsible for any omission, mistake nor for any loss or damage including without limitation to any loss of profit which may arise from reliance on any information supplied by TFA Global Pte Ltd.
The speaker(s) is neither an employee, agent nor representative of Tradu and is therefore acting independently. The opinions given are their own, constitute general market commentary, and do not constitute the opinion or advice of Tradu or any form of personal or investment advice. Tradu neither endorses nor guarantees offerings of third-party speakers, nor is Tradu responsible for the content, veracity or opinions of third-party speakers, presenters or participants.

Bearish reversal?The Cable (GBP/USD) is rising towards the pivot which is a pullback resistance that aligns with the 61.8% Fibonacci retracement and could reverse to the 1st support.
Pivot: 1.3523
1st Support: 1.3036
1st Resistance: 1.3740
Disclaimer:
The above opinions given constitute general market commentary, and do not constitute the opinion or advice of IC Markets or any form of personal or investment advice.
Any opinions, news, research, analyses, prices, other information, or links to third-party sites contained on this website are provided on an "as-is" basis, are intended only to be informative, is not an advice nor a recommendation, nor research, or a record of our trading prices, or an offer of, or solicitation for a transaction in any financial instrument and thus should not be treated as such. The information provided does not involve any specific investment objectives, financial situation and needs of any specific person who may receive it. Please be aware, that past performance is not a reliable indicator of future performance and/or results. Past Performance or Forward-looking scenarios based upon the reasonable beliefs of the third-party provider are not a guarantee of future performance. Actual results may differ materially from those anticipated in forward-looking or past performance statements. IC Markets makes no representation or warranty and assumes no liability as to the accuracy or completeness of the information provided, nor any loss arising from any investment based on a recommendation, forecast or any information supplied by any third-party.

GBPUSD H4 | Bullish Bounce Off Pullback SupportGBP/USD is falling towards the buy entry, which is a pullback support that aligns with the 50% Fibonacci retracement and could bounce from this level to the upside.
Buy entry is at 1.3361, which is a pullback support that aligns with the 50% Fibonacci retracement.
Stop loss is at 1.3274, which is a multi-swing low support.
Take profit is at 1.3535, which is an overlap resistance that lines up with the 61.8% Fibonacci retracement.
High Risk Investment Warning
Trading Forex/CFDs on margin carries a high level of risk and may not be suitable for all investors. Leverage can work against you.
Stratos Markets Limited (tradu.com ):
CFDs are complex instruments and come with a high risk of losing money rapidly due to leverage. 65% of retail investor accounts lose money when trading CFDs with this provider. You should consider whether you understand how CFDs work and whether you can afford to take the high risk of losing your money.
Stratos Europe Ltd (tradu.com ):
CFDs are complex instruments and come with a high risk of losing money rapidly due to leverage. 66% of retail investor accounts lose money when trading CFDs with this provider. You should consider whether you understand how CFDs work and whether you can afford to take the high risk of losing your money.
Stratos Global LLC (tradu.com ):
Losses can exceed deposits.
Please be advised that the information presented on TradingView is provided to Tradu (‘Company’, ‘we’) by a third-party provider (‘TFA Global Pte Ltd’). Please be reminded that you are solely responsible for the trading decisions on your account. There is a very high degree of risk involved in trading. Any information and/or content is intended entirely for research, educational and informational purposes only and does not constitute investment or consultation advice or investment strategy. The information is not tailored to the investment needs of any specific person and therefore does not involve a consideration of any of the investment objectives, financial situation or needs of any viewer that may receive it. Kindly also note that past performance is not a reliable indicator of future results. Actual results may differ materially from those anticipated in forward-looking or past performance statements. We assume no liability as to the accuracy or completeness of any of the information and/or content provided herein and the Company cannot be held responsible for any omission, mistake nor for any loss or damage including without limitation to any loss of profit which may arise from reliance on any information supplied by TFA Global Pte Ltd.
The speaker(s) is neither an employee, agent nor representative of Tradu and is therefore acting independently. The opinions given are their own, constitute general market commentary, and do not constitute the opinion or advice of Tradu or any form of personal or investment advice. Tradu neither endorses nor guarantees offerings of third-party speakers, nor is Tradu responsible for the content, veracity or opinions of third-party speakers, presenters or participants.

Bullish momentum to extend?Cable (GBP/USD) has bounced off the pivot and could rise to the multi swing high resistance.
Pivot: 1.3354
1st Support: 1.3312
1st Resistance: 1.3486
Disclaimer:
The above opinions given constitute general market commentary, and do not constitute the opinion or advice of IC Markets or any form of personal or investment advice.
Any opinions, news, research, analyses, prices, other information, or links to third-party sites contained on this website are provided on an "as-is" basis, are intended only to be informative, is not an advice nor a recommendation, nor research, or a record of our trading prices, or an offer of, or solicitation for a transaction in any financial instrument and thus should not be treated as such. The information provided does not involve any specific investment objectives, financial situation and needs of any specific person who may receive it. Please be aware, that past performance is not a reliable indicator of future performance and/or results. Past Performance or Forward-looking scenarios based upon the reasonable beliefs of the third-party provider are not a guarantee of future performance. Actual results may differ materially from those anticipated in forward-looking or past performance statements. IC Markets makes no representation or warranty and assumes no liability as to the accuracy or completeness of the information provided, nor any loss arising from any investment based on a recommendation, forecast or any information supplied by any third-party.

Potential bullish rise?GBP/USD has reacted off the support level, which is a pullback support and could rise from this level to our take profit.
Entry: 1.3284
Why we like it:
There is a pullback support level.
Stop loss: 1.3260
Why we like it:
There is a multi-swing low support level.
Take profit: 1.3353
Why we like it:
There is an overlap resistance level.
Enjoying your TradingView experience? Review us!
Please be advised that the information presented on TradingView is provided to Vantage (‘Vantage Global Limited’, ‘we’) by a third-party provider (‘Everest Fortune Group’). Please be reminded that you are solely responsible for the trading decisions on your account. There is a very high degree of risk involved in trading. Any information and/or content is intended entirely for research, educational and informational purposes only and does not constitute investment or consultation advice or investment strategy. The information is not tailored to the investment needs of any specific person and therefore does not involve a consideration of any of the investment objectives, financial situation or needs of any viewer that may receive it. Kindly also note that past performance is not a reliable indicator of future results. Actual results may differ materially from those anticipated in forward-looking or past performance statements. We assume no liability as to the accuracy or completeness of any of the information and/or content provided herein and the Company cannot be held responsible for any omission, mistake nor for any loss or damage including without limitation to any loss of profit which may arise from reliance on any information supplied by Everest Fortune Group.

GBP/USD - Breakout Pattern (14.10.2025)The GBP/USD pair on the M30 timeframe presents a Potential Buying Opportunity due to a recent Formation of a Breakout Pattern.
This suggests a shift in momentum towards the upside and a higher likelihood of further advances in the coming hours.
Possible Long Trade:
Entry: Consider Entering A Long Position around Trendline Of The Pattern.
Target Levels:
1st Resistance – 1.3434
2nd Resistance – 1.3484
🎁 Please hit the like button and
🎁 Leave a comment to support for My Post !
Your likes and comments are incredibly motivating and will encourage me to share more analysis with you.
#GBPUSD #Forex #Trading #TechnicalAnalysis #PriceAction #ForexSignals #BreakoutTrading #Ichimoku #FXTrading #BullishSetup #TradingView
⚠️ Disclaimer:
This analysis is for educational purposes only and not financial advice. Always use proper risk management and conduct your own research before trading.
Best Regards, KABHI_TA_TRADING
Thank you.
