Falling towards major support?GBP/USD is falling towards the support level, which is an overlap support that is slightly above the 50% Fibonacci retracement and could bounce from this level to our take profit.
Entry: 1.3386
Why we like it:
There is an overlap support that is slightly above the 50% Fibonacci retracement.
Stop loss: 1.3266
Why we like it:
There is a pullback support that is slightly above the 78.6% Fibonacci retracement.
Take profit: 1.3520
Why we like it:
There is a pullback resistance.
Enjoying your TradingView experience? Review us!
Please be advised that the information presented on TradingView is provided to Vantage (‘Vantage Global Limited’, ‘we’) by a third-party provider (‘Everest Fortune Group’). Please be reminded that you are solely responsible for the trading decisions on your account. There is a very high degree of risk involved in trading. Any information and/or content is intended entirely for research, educational and informational purposes only and does not constitute investment or consultation advice or investment strategy. The information is not tailored to the investment needs of any specific person and therefore does not involve a consideration of any of the investment objectives, financial situation or needs of any viewer that may receive it. Kindly also note that past performance is not a reliable indicator of future results. Actual results may differ materially from those anticipated in forward-looking or past performance statements. We assume no liability as to the accuracy or completeness of any of the information and/or content provided herein and the Company cannot be held responsible for any omission, mistake nor for any loss or damage including without limitation to any loss of profit which may arise from reliance on any information supplied by Everest Fortune Group.
GBP

GBPJPY H4 | Falling towards 50% Fibonacci supportBased on the H4 chart analysis, we could see the price fall to the buy entry, which is a pullback support that aligns with the 50% Fibonacci retracement and could bounce to the take profit.
Buy entry is at 197.51, which is a pullback support that lines up with the 50% Fibonacci retracement.
Stop loss is at 196.36, which is a pullback support that is slightly above the 78.6% Fibonacci retracement.
Take profit is at 198.91, which is a pullback resistance.
High Risk Investment Warning
Trading Forex/CFDs on margin carries a high level of risk and may not be suitable for all investors. Leverage can work against you.
Stratos Markets Limited (tradu.com ):
CFDs are complex instruments and come with a high risk of losing money rapidly due to leverage. 65% of retail investor accounts lose money when trading CFDs with this provider. You should consider whether you understand how CFDs work and whether you can afford to take the high risk of losing your money.
Stratos Europe Ltd (tradu.com ):
CFDs are complex instruments and come with a high risk of losing money rapidly due to leverage. 66% of retail investor accounts lose money when trading CFDs with this provider. You should consider whether you understand how CFDs work and whether you can afford to take the high risk of losing your money.
Stratos Global LLC (tradu.com ):
Losses can exceed deposits.
Please be advised that the information presented on TradingView is provided to Tradu (‘Company’, ‘we’) by a third-party provider (‘TFA Global Pte Ltd’). Please be reminded that you are solely responsible for the trading decisions on your account. There is a very high degree of risk involved in trading. Any information and/or content is intended entirely for research, educational and informational purposes only and does not constitute investment or consultation advice or investment strategy. The information is not tailored to the investment needs of any specific person and therefore does not involve a consideration of any of the investment objectives, financial situation or needs of any viewer that may receive it. Kindly also note that past performance is not a reliable indicator of future results. Actual results may differ materially from those anticipated in forward-looking or past performance statements. We assume no liability as to the accuracy or completeness of any of the information and/or content provided herein and the Company cannot be held responsible for any omission, mistake nor for any loss or damage including without limitation to any loss of profit which may arise from reliance on any information supplied by TFA Global Pte Ltd.
The speaker(s) is neither an employee, agent nor representative of Tradu and is therefore acting independently. The opinions given are their own, constitute general market commentary, and do not constitute the opinion or advice of Tradu or any form of personal or investment advice. Tradu neither endorses nor guarantees offerings of third-party speakers, nor is Tradu responsible for the content, veracity or opinions of third-party speakers, presenters or participants.

GBPAUD intraday dips continue to attract buyers.GBPAUD - 24h expiry
Price action is forming a bullish flag which has a bias to break to the upside.
Intraday dips continue to attract buyers and there is no clear indication that this sequence for trading is coming to an end.
20 4hour EMA is at 2.0862.
The sequence for trading is higher highs and lows.
There is no clear indication that the upward move is coming to an end.
We look to Buy at 2.0871 (stop at 2.0811)
Our profit targets will be 2.1051 and 2.1091
Resistance: 2.1006 / 2.1050 / 2.1100
Support: 2.0880 / 2.0820 / 2.0783
Risk Disclaimer
The trade ideas beyond this page are for informational purposes only and do not constitute investment advice or a solicitation to trade. This information is provided by Signal Centre, a third-party unaffiliated with OANDA, and is intended for general circulation only. OANDA does not guarantee the accuracy of this information and assumes no responsibilities for the information provided by the third party. The information does not take into account the specific investment objectives, financial situation, or particular needs of any particular person. You should take into account your specific investment objectives, financial situation, and particular needs before making a commitment to trade, including seeking, under a separate engagement, as you deem fit.
You accept that you assume all risks in independently viewing the contents and selecting a chosen strategy.
Where the research is distributed in Singapore to a person who is not an Accredited Investor, Expert Investor or an Institutional Investor, Oanda Asia Pacific Pte Ltd (“OAP“) accepts legal responsibility for the contents of the report to such persons only to the extent required by law. Singapore customers should contact OAP at 6579 8289 for matters arising from, or in connection with, the information/research distributed.

Bullish bounce?GBP/JPY is falling towards the pivot and could bounce to the 1st resistance which acts as a pullback resistance.
Pivot: 197.49
1st Support: 196.40
1st Resistance: 198.90
Risk Warning:
Trading Forex and CFDs carries a high level of risk to your capital and you should only trade with money you can afford to lose. Trading Forex and CFDs may not be suitable for all investors, so please ensure that you fully understand the risks involved and seek independent advice if necessary.
Disclaimer:
The above opinions given constitute general market commentary, and do not constitute the opinion or advice of IC Markets or any form of personal or investment advice.
Any opinions, news, research, analyses, prices, other information, or links to third-party sites contained on this website are provided on an "as-is" basis, are intended only to be informative, is not an advice nor a recommendation, nor research, or a record of our trading prices, or an offer of, or solicitation for a transaction in any financial instrument and thus should not be treated as such. The information provided does not involve any specific investment objectives, financial situation and needs of any specific person who may receive it. Please be aware, that past performance is not a reliable indicator of future performance and/or results. Past Performance or Forward-looking scenarios based upon the reasonable beliefs of the third-party provider are not a guarantee of future performance. Actual results may differ materially from those anticipated in forward-looking or past performance statements. IC Markets makes no representation or warranty and assumes no liability as to the accuracy or completeness of the information provided, nor any loss arising from any investment based on a recommendation, forecast or any information supplied by any third-party.

Bullish bounce off pullback support?GBP/CHF is falling towards the pivot and could bounce to the 1st resistance.
Pivot: 1.0791
1st Support: 1.0718
1st Resistance: 1.0873
Risk Warning:
Trading Forex and CFDs carries a high level of risk to your capital and you should only trade with money you can afford to lose. Trading Forex and CFDs may not be suitable for all investors, so please ensure that you fully understand the risks involved and seek independent advice if necessary.
Disclaimer:
The above opinions given constitute general market commentary, and do not constitute the opinion or advice of IC Markets or any form of personal or investment advice.
Any opinions, news, research, analyses, prices, other information, or links to third-party sites contained on this website are provided on an "as-is" basis, are intended only to be informative, is not an advice nor a recommendation, nor research, or a record of our trading prices, or an offer of, or solicitation for a transaction in any financial instrument and thus should not be treated as such. The information provided does not involve any specific investment objectives, financial situation and needs of any specific person who may receive it. Please be aware, that past performance is not a reliable indicator of future performance and/or results. Past Performance or Forward-looking scenarios based upon the reasonable beliefs of the third-party provider are not a guarantee of future performance. Actual results may differ materially from those anticipated in forward-looking or past performance statements. IC Markets makes no representation or warranty and assumes no liability as to the accuracy or completeness of the information provided, nor any loss arising from any investment based on a recommendation, forecast or any information supplied by any third-party.

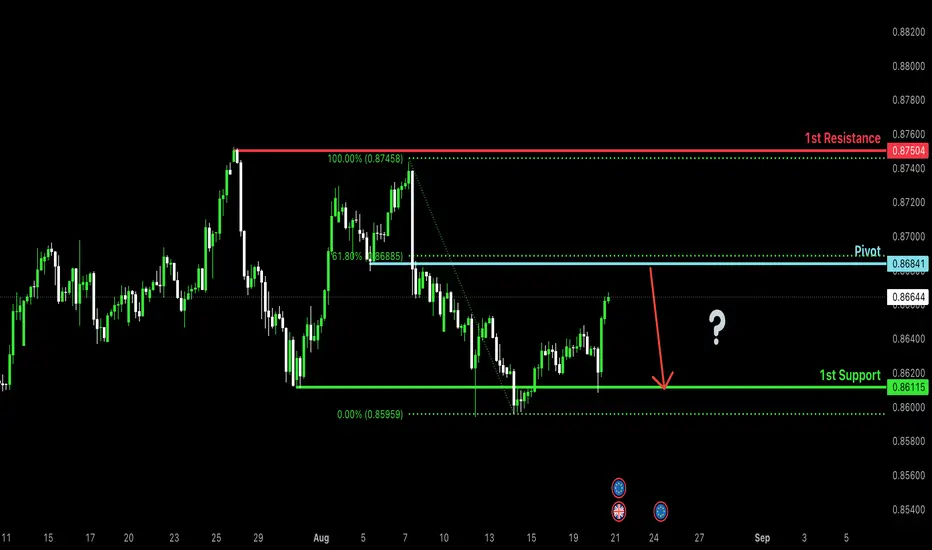
Bearish reversal off 61.8% Fibonacci resistance?EUR/GBP is rising towards the pivot, which acts as a pullback resistance that lines up with the 61.8% Fibonacci retracement and could reverse to the 1st support.
Pivot: 0.8684
1st Support: 0.8611
1st Resistance: 0.8750
Risk Warning:
Trading Forex and CFDs carries a high level of risk to your capital and you should only trade with money you can afford to lose. Trading Forex and CFDs may not be suitable for all investors, so please ensure that you fully understand the risks involved and seek independent advice if necessary.
Disclaimer:
The above opinions given constitute general market commentary, and do not constitute the opinion or advice of IC Markets or any form of personal or investment advice.
Any opinions, news, research, analyses, prices, other information, or links to third-party sites contained on this website are provided on an "as-is" basis, are intended only to be informative, is not an advice nor a recommendation, nor research, or a record of our trading prices, or an offer of, or solicitation for a transaction in any financial instrument and thus should not be treated as such. The information provided does not involve any specific investment objectives, financial situation and needs of any specific person who may receive it. Please be aware, that past performance is not a reliable indicator of future performance and/or results. Past Performance or Forward-looking scenarios based upon the reasonable beliefs of the third-party provider are not a guarantee of future performance. Actual results may differ materially from those anticipated in forward-looking or past performance statements. IC Markets makes no representation or warranty and assumes no liability as to the accuracy or completeness of the information provided, nor any loss arising from any investment based on a recommendation, forecast or any information supplied by any third-party.
Bullish bounce off?EUR/GBP is falling towards the support level which is a pullback support and could bounce from this level to our take profit.
Entry: 0.8652
Why we like it:
There is a pullback support level.
Stop loss: 0.8600
Why we lilk eit:
There is a multi swing low support.
Take profit: 0.8716
Why we like it:
There is a pullback resistance level.
Enjoying your TradingView experience? Review us!
Please be advised that the information presented on TradingView is provided to Vantage (‘Vantage Global Limited’, ‘we’) by a third-party provider (‘Everest Fortune Group’). Please be reminded that you are solely responsible for the trading decisions on your account. There is a very high degree of risk involved in trading. Any information and/or content is intended entirely for research, educational and informational purposes only and does not constitute investment or consultation advice or investment strategy. The information is not tailored to the investment needs of any specific person and therefore does not involve a consideration of any of the investment objectives, financial situation or needs of any viewer that may receive it. Kindly also note that past performance is not a reliable indicator of future results. Actual results may differ materially from those anticipated in forward-looking or past performance statements. We assume no liability as to the accuracy or completeness of any of the information and/or content provided herein and the Company cannot be held responsible for any omission, mistake nor for any loss or damage including without limitation to any loss of profit which may arise from reliance on any information supplied by Everest Fortune Group.

GBPUSD at 1.35250 Resistance as DXY Eyes 98.100 SupportHey Traders, in today's trading session we are monitoring GBPUSD for a selling opportunity around 1.35250 zone, GBPUSD is moving within a descending channel, with price correcting higher toward the 1.35250 resistance zone — an area that previously acted as support.
Meanwhile, the U.S. Dollar Index (DXY) remains in an uptrend and is approaching the 98.100 support area, which may influence GBPUSD direction if buyers step in.
Watching how GBPUSD reacts at 1.35250 in relation to DXY’s behavior could provide insight into whether the current correction ends or extends further.
Trade safe, Joe.

GBPJPY H4 | Bearish drop offGBP/JPY is reacting off the sell entry, which acts as a pullback support, and a break below this level could lead the price to drop the downside.
Sell entry is at 198.96, which is a pullback support.
Stop loss is at 200.07, which is a multi-swing high resistance.
Take profit is 197.57, which is a pullback support that lines up with the 50% Fibonacci retracement.
High Risk Investment Warning
Trading Forex/CFDs on margin carries a high level of risk and may not be suitable for all investors. Leverage can work against you.
Stratos Markets Limited (tradu.com ):
CFDs are complex instruments and come with a high risk of losing money rapidly due to leverage. 65% of retail investor accounts lose money when trading CFDs with this provider. You should consider whether you understand how CFDs work and whether you can afford to take the high risk of losing your money.
Stratos Europe Ltd (tradu.com ):
CFDs are complex instruments and come with a high risk of losing money rapidly due to leverage. 66% of retail investor accounts lose money when trading CFDs with this provider. You should consider whether you understand how CFDs work and whether you can afford to take the high risk of losing your money.
Stratos Global LLC (tradu.com ):
Losses can exceed deposits.
Please be advised that the information presented on TradingView is provided to Tradu (‘Company’, ‘we’) by a third-party provider (‘TFA Global Pte Ltd’). Please be reminded that you are solely responsible for the trading decisions on your account. There is a very high degree of risk involved in trading. Any information and/or content is intended entirely for research, educational and informational purposes only and does not constitute investment or consultation advice or investment strategy. The information is not tailored to the investment needs of any specific person and therefore does not involve a consideration of any of the investment objectives, financial situation or needs of any viewer that may receive it. Kindly also note that past performance is not a reliable indicator of future results. Actual results may differ materially from those anticipated in forward-looking or past performance statements. We assume no liability as to the accuracy or completeness of any of the information and/or content provided herein and the Company cannot be held responsible for any omission, mistake nor for any loss or damage including without limitation to any loss of profit which may arise from reliance on any information supplied by TFA Global Pte Ltd.
The speaker(s) is neither an employee, agent nor representative of Tradu and is therefore acting independently. The opinions given are their own, constitute general market commentary, and do not constitute the opinion or advice of Tradu or any form of personal or investment advice. Tradu neither endorses nor guarantees offerings of third-party speakers, nor is Tradu responsible for the content, veracity or opinions of third-party speakers, presenters or participants.

Potential bearish drop?The Cable (GBP/USD) has rejected off the pivot, which acts as a pullback resistance, and could drop from this level to the 1st support, which is an overlap support.
Pivot: 1.3522
1st Support: 1.3402
1st Resistance: 1.3587
Risk Warning:
Trading Forex and CFDs carries a high level of risk to your capital and you should only trade with money you can afford to lose. Trading Forex and CFDs may not be suitable for all investors, so please ensure that you fully understand the risks involved and seek independent advice if necessary.
Disclaimer:
The above opinions given constitute general market commentary, and do not constitute the opinion or advice of IC Markets or any form of personal or investment advice.
Any opinions, news, research, analyses, prices, other information, or links to third-party sites contained on this website are provided on an "as-is" basis, are intended only to be informative, is not an advice nor a recommendation, nor research, or a record of our trading prices, or an offer of, or solicitation for a transaction in any financial instrument and thus should not be treated as such. The information provided does not involve any specific investment objectives, financial situation and needs of any specific person who may receive it. Please be aware, that past performance is not a reliable indicator of future performance and/or results. Past Performance or Forward-looking scenarios based upon the reasonable beliefs of the third-party provider are not a guarantee of future performance. Actual results may differ materially from those anticipated in forward-looking or past performance statements. IC Markets makes no representation or warranty and assumes no liability as to the accuracy or completeness of the information provided, nor any loss arising from any investment based on a recommendation, forecast or any information supplied by any third-party.

We got CAN CPIs, let's see how GB CPIs will lookWe just received a surprise reading on the Canadian CPIs, which were on the lower side. Let's see what happens with the British ones.
Let's dig in.
FX_IDC:USDCAD
MARKETSCOM:USDCAD
FX_IDC:GBPUSD
MARKETSCOM:GBPUSD
MARKETSCOM:DOLLARINDEX
Let us know what you think in the comments below.
Thank you.
75.2% of retail investor accounts lose money when trading CFDs with this provider. You should consider whether you understand how CFDs work and whether you can afford to take the high risk of losing your money. Past performance is not necessarily indicative of future results. The value of investments may fall as well as rise and the investor may not get back the amount initially invested. This content is not intended for nor applicable to residents of the UK. Cryptocurrency CFDs and spread bets are restricted in the UK for all retail clients.

GBPUSD H4 | Bullish bounce GBP/USD is falling towards the buy entry which is a pullback support and could bounce from this level to the upside.
Buy entry is at 1.3461, which is a pullback support.
Stop loss is at 1.3379, which is an overlap support that lines up with the 50% Fibonacci retracement.
Take profit is at 1.3580, which is a multi swing high resistance.
High Risk Investment Warning
Trading Forex/CFDs on margin carries a high level of risk and may not be suitable for all investors. Leverage can work against you.
Stratos Markets Limited (tradu.com ):
CFDs are complex instruments and come with a high risk of losing money rapidly due to leverage. 65% of retail investor accounts lose money when trading CFDs with this provider. You should consider whether you understand how CFDs work and whether you can afford to take the high risk of losing your money.
Stratos Europe Ltd (tradu.com ):
CFDs are complex instruments and come with a high risk of losing money rapidly due to leverage. 66% of retail investor accounts lose money when trading CFDs with this provider. You should consider whether you understand how CFDs work and whether you can afford to take the high risk of losing your money.
Stratos Global LLC (tradu.com ):
Losses can exceed deposits.
Please be advised that the information presented on TradingView is provided to Tradu (‘Company’, ‘we’) by a third-party provider (‘TFA Global Pte Ltd’). Please be reminded that you are solely responsible for the trading decisions on your account. There is a very high degree of risk involved in trading. Any information and/or content is intended entirely for research, educational and informational purposes only and does not constitute investment or consultation advice or investment strategy. The information is not tailored to the investment needs of any specific person and therefore does not involve a consideration of any of the investment objectives, financial situation or needs of any viewer that may receive it. Kindly also note that past performance is not a reliable indicator of future results. Actual results may differ materially from those anticipated in forward-looking or past performance statements. We assume no liability as to the accuracy or completeness of any of the information and/or content provided herein and the Company cannot be held responsible for any omission, mistake nor for any loss or damage including without limitation to any loss of profit which may arise from reliance on any information supplied by TFA Global Pte Ltd.
The speaker(s) is neither an employee, agent nor representative of Tradu and is therefore acting independently. The opinions given are their own, constitute general market commentary, and do not constitute the opinion or advice of Tradu or any form of personal or investment advice. Tradu neither endorses nor guarantees offerings of third-party speakers, nor is Tradu responsible for the content, veracity or opinions of third-party speakers, presenters or participants.

GBPAUD – 4H FVG Rejection Could Trigger Bearish Move
On the 4H chart, GBPAUD is approaching a Fair Value Gap (FVG) zone near 2.0900 , where I expect sellers to step in. Price has already shown exhaustion signs, and if rejection happens, the downside path looks more probable.
With the 200 EMA still hovering below, a clean rejection from FVG could open the way for a move down to 2.0610 (expected target). If bearish momentum extends, the next level to watch will be around 2.0472 (Fib extension support) .
📉 Bias – Bearish from FVG rejection
📍 Key Resistance – 2.0900 FVG zone
🎯 Target Levels – 2.0610 → 2.0472

Bullish continuation?GBP/NZD is falling towards the support level which is an overlap support that is slightly below the 38.2% Fibonacci retracement and could bounce from this level to our take profit.
Entry: 2.2654
Why we like it:
There is an overlap support that is slightly below the 38.2% Fibonacci retracement.
Stop loss: 2.2554
Why we like it:
There is an overlap support level that is slightly above the 61.8% Fibonacci retracement.
Take profit: 2.2875
Why we like it:
There is a swing high resistance.
Enjoying your TradingView experience? Review us!
Please be advised that the information presented on TradingView is provided to Vantage (‘Vantage Global Limited’, ‘we’) by a third-party provider (‘Everest Fortune Group’). Please be reminded that you are solely responsible for the trading decisions on your account. There is a very high degree of risk involved in trading. Any information and/or content is intended entirely for research, educational and informational purposes only and does not constitute investment or consultation advice or investment strategy. The information is not tailored to the investment needs of any specific person and therefore does not involve a consideration of any of the investment objectives, financial situation or needs of any viewer that may receive it. Kindly also note that past performance is not a reliable indicator of future results. Actual results may differ materially from those anticipated in forward-looking or past performance statements. We assume no liability as to the accuracy or completeness of any of the information and/or content provided herein and the Company cannot be held responsible for any omission, mistake nor for any loss or damage including without limitation to any loss of profit which may arise from reliance on any information supplied by Everest Fortune Group.

GBPUSD – DAILY FORECAST Q3 | W34 | D18 | Y25📊 GBPUSD – DAILY FORECAST
Q3 | W34 | D18 | Y25
Daily Forecast 🔍📅
Here’s a short diagnosis of the current chart setup 🧠📈
Higher time frame order blocks have been identified — these are our patient points of interest 🎯🧭.
It’s crucial to wait for a confirmed break of structure 🧱✅ before forming a directional bias.
This keeps us disciplined and aligned with what price action is truly telling us.
📈 Risk Management Protocols
🔑 Core principles:
Max 1% risk per trade
Only execute at pre-identified levels
Use alerts, not emotion
Stick to your RR plan — minimum 1:2
🧠 You’re not paid for how many trades you take, you’re paid for how well you manage risk.
🧠 Weekly FRGNT Insight
"Trade what the market gives, not what your ego wants."
Stay mechanical. Stay focused. Let the probabilities work.
FX:GBPUSD

EURGBP – DAILY FORECAST Q3 | W34 | D18 | Y25📊 EURGBP – DAILY FORECAST
Q3 | W34 | D18 | Y25
Daily Forecast 🔍📅
Here’s a short diagnosis of the current chart setup 🧠📈
Higher time frame order blocks have been identified — these are our patient points of interest 🎯🧭.
It’s crucial to wait for a confirmed break of structure 🧱✅ before forming a directional bias.
This keeps us disciplined and aligned with what price action is truly telling us.
📈 Risk Management Protocols
🔑 Core principles:
Max 1% risk per trade
Only execute at pre-identified levels
Use alerts, not emotion
Stick to your RR plan — minimum 1:2
🧠 You’re not paid for how many trades you take, you’re paid for how well you manage risk.
🧠 Weekly FRGNT Insight
"Trade what the market gives, not what your ego wants."
Stay mechanical. Stay focused. Let the probabilities work.
FX:EURGBP

Bearish reversal off pullback resistance?The Cable (GBP/USD) is rising towards the pivot, which has been identified as a pullback resistance and could reverse to the 1st support.
Pivot: 1.3613
1st Support: 1.3366
1st Resistance: 1.3789
Risk Warning:
Trading Forex and CFDs carries a high level of risk to your capital and you should only trade with money you can afford to lose. Trading Forex and CFDs may not be suitable for all investors, so please ensure that you fully understand the risks involved and seek independent advice if necessary.
Disclaimer:
The above opinions given constitute general market commentary, and do not constitute the opinion or advice of IC Markets or any form of personal or investment advice.
Any opinions, news, research, analyses, prices, other information, or links to third-party sites contained on this website are provided on an "as-is" basis, are intended only to be informative, is not an advice nor a recommendation, nor research, or a record of our trading prices, or an offer of, or solicitation for a transaction in any financial instrument and thus should not be treated as such. The information provided does not involve any specific investment objectives, financial situation and needs of any specific person who may receive it. Please be aware, that past performance is not a reliable indicator of future performance and/or results. Past Performance or Forward-looking scenarios based upon the reasonable beliefs of the third-party provider are not a guarantee of future performance. Actual results may differ materially from those anticipated in forward-looking or past performance statements. IC Markets makes no representation or warranty and assumes no liability as to the accuracy or completeness of the information provided, nor any loss arising from any investment based on a recommendation, forecast or any information supplied by any third-party.

GBP/JPY - Triangle Breakout (18.08.2025)The GBP/JPY pair on the M30 timeframe presents a Potential Buying Opportunity due to a recent Formation of a Triangle Breakout Pattern. This suggests a shift in momentum towards the upside and a higher likelihood of further advances in the coming hours.
Possible Long Trade:
Entry: Consider Entering A Long Position around Trendline Of The Pattern.
Target Levels:
1st Resistance – 200.79
2nd Resistance – 201.24
🎁 Please hit the like button and
🎁 Leave a comment to support for My Post !
Your likes and comments are incredibly motivating and will encourage me to share more analysis with you.
Best Regards, KABHI_TA_TRADING
Thank you.
Disclosure: I am part of Trade Nation's Influencer program and receive a monthly fee for using their TradingView charts in my analysis.

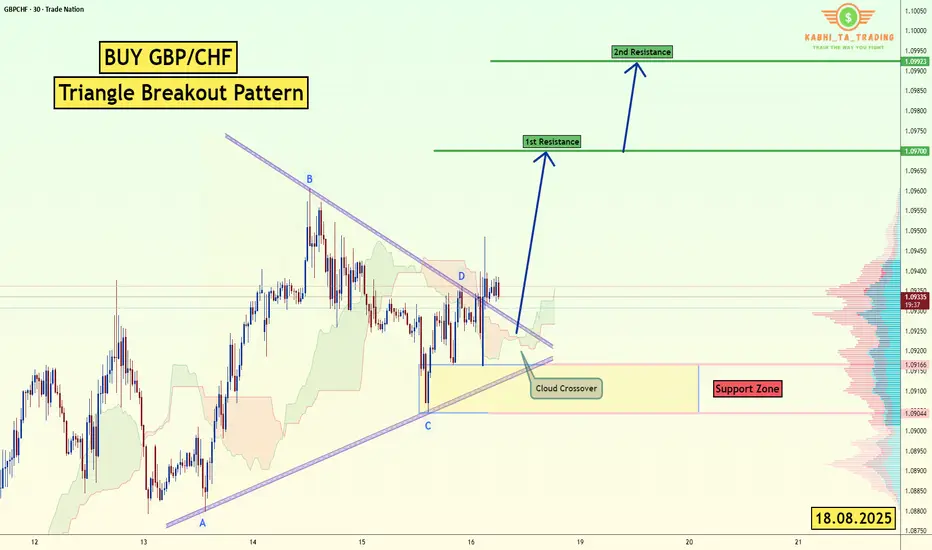
GBP/CHF - Triangle Breakout (18.08.2025) The GBP/CHF pair on the M30 timeframe presents a Potential Buying Opportunity due to a recent Formation of a Triangle Breakout Pattern. This suggests a shift in momentum towards the upside and a higher likelihood of further advances in the coming hours.
Possible Long Trade:
Entry: Consider Entering A Long Position around Trendline Of The Pattern.
Target Levels:
1st Resistance – 1.0970
2nd Resistance – 1.0993
🎁 Please hit the like button and
🎁 Leave a comment to support for My Post !
Your likes and comments are incredibly motivating and will encourage me to share more analysis with you.
Best Regards, KABHI_TA_TRADING
Thank you.
Disclosure: I am part of Trade Nation's Influencer program and receive a monthly fee for using their TradingView charts in my analysis.
# GBPUSD Technical Analysis & Forecast# GBPUSD Technical Analysis & Forecast
**Asset**: GBP/USD
**Reference Price**: 1.35557 (August 16th, 2025, 12:50 AM UTC+4)
**Analysis Date**: August 17, 2025
## Executive Summary
GBPUSD is positioned at a critical juncture with multiple technical confluences suggesting potential bullish continuation. The pair has shown resilience above key support levels and appears to be forming a corrective structure that may lead to higher targets.
---
## 1. ELLIOTT WAVE ANALYSIS
### Primary Count (Daily/Weekly)
- **Current Position**: Gray Wave 3 (Impulsive phase)
- **Sub-wave**: Orange Wave 5 active
- **Structure**: Bullish trend in impulsive mode
- **Completion Status**: Gray Wave 2 likely complete
### Intraday Perspective (1H-4H)
- **Pattern**: Double Three (WXY) corrective structure
- **Key Level**: Equal Legs zone providing support
- **Blue Box Area**: Critical support confluence around 1.3480-1.3520
- **Invalidation**: Break below red X connector invalidates bullish count
### Wave Targets
- **Immediate**: 1.3650-1.3700 (completion of current sub-wave)
- **Extended**: 1.3850-1.4000 (major resistance confluence)
---
## 2. HARMONIC ANALYSIS
### Active Patterns
**ABCD Pattern**
- **Status**: Potential completion near current levels
- **D Point**: Expected around 1.3480-1.3520
- **Target**: 1.3680-1.3750 (127.2% extension)
**Gartley Pattern (4H)**
- **Completion**: 78.6% retracement area
- **Support Zone**: 1.3500-1.3550
- **Targets**: 1.3650 (38.2%), 1.3720 (61.8%)
**Butterfly Formation (Daily)**
- **Status**: Monitoring for completion
- **Critical Zone**: 1.3480-1.3520
- **Upside Potential**: 1.3780-1.3850
---
## 3. WYCKOFF ANALYSIS
### Current Phase Assessment
**Phase**: Accumulation (Phase C - Spring Test)
- **Characteristics**: Testing of support with reduced volume
- **Smart Money Activity**: Accumulation at lower levels
- **Market Maker Position**: Building long positions
### Key Wyckoff Levels
- **Support**: 1.3480 (Last Point of Support - LPS)
- **Resistance**: 1.3650 (Automatic Rally - AR)
- **Breakout Target**: 1.3750+ (Sign of Strength - SOS)
---
## 4. W.D. GANN ANALYSIS
### Square of 9 Analysis
**Current Position**: 1.35557
- **Next Resistance**: 1.3650 (144° angle)
- **Major Resistance**: 1.3780 (180° angle)
- **Support**: 1.3480 (90° angle from previous high)
### Time Cycles
**Active Cycles**:
- 30-day cycle: Peak expected around August 25-28, 2025
- 90-day cycle: Major turn window September 15-20, 2025
### Gann Angles (Daily Chart)
- **1x1 Angle**: Rising from 1.3200 low
- **2x1 Angle**: Critical support at 1.3450
- **1x2 Angle**: Resistance at 1.3720
### Price Forecasting
**Natural Resistance Levels** (Square of 9):
- 1.3610 (Minor)
- 1.3680 (Moderate)
- 1.3750 (Strong)
- 1.3850 (Major)
---
## 5. ICHIMOKU KINKO HYO
### Cloud Analysis (Daily)
- **Cloud Status**: Bullish (green cloud)
- **Price Position**: Above cloud indicating uptrend
- **Tenkan-sen**: 1.3520 (dynamic support)
- **Kijun-sen**: 1.3480 (key support)
### Key Levels
- **Cloud Top**: 1.3450
- **Cloud Bottom**: 1.3380
- **Senkou Span B**: 1.3420 (26-period ahead)
### Signals
- **Bullish Crossover**: Tenkan above Kijun
- **Future Cloud**: Remains bullish through September
---
## 6. JAPANESE CANDLESTICK ANALYSIS
### Recent Patterns (4H/Daily)
**Doji Star Formation**:
- **Location**: Near 1.3550 resistance
- **Implication**: Indecision, potential reversal higher
- **Confirmation**: Needed above 1.3580
**Hammer Pattern (Daily)**:
- **Formation**: August 15th low
- **Support**: 1.3480 area
- **Bullish Bias**: If sustained above 1.3520
### Pattern Projections
- **Engulfing Pattern**: Target 1.3650-1.3680
- **Three White Soldiers**: Potential if break above 1.3580
---
## 7. TECHNICAL INDICATORS ANALYSIS
### RSI (Relative Strength Index)
**Multi-Timeframe RSI Status**:
- **Daily**: 52.3 (Neutral with upward bias)
- **4H**: 48.7 (Slightly oversold, bullish divergence forming)
- **1H**: 45.2 (Oversold, bounce expected)
### Bollinger Bands
- **Daily**: Price at lower band, squeeze formation
- **4H**: Expansion phase beginning
- **Target**: Upper band at 1.3720-1.3750
### VWAP (Volume Weighted Average Price)
- **Daily VWAP**: 1.3530 (current resistance)
- **Weekly VWAP**: 1.3480 (key support)
- **Deviation Bands**: +1σ at 1.3620, +2σ at 1.3680
---
## 8. MOVING AVERAGES CONFLUENCE
### Simple Moving Averages (SMA)
- **20 SMA**: 1.3540 (immediate resistance)
- **50 SMA**: 1.3520 (dynamic support)
- **200 SMA**: 1.3450 (major support)
### Exponential Moving Averages (EMA)
- **12 EMA**: 1.3565 (short-term resistance)
- **26 EMA**: 1.3535 (key pivot)
- **100 EMA**: 1.3480 (confluence support)
### Weighted Moving Average (WMA)
- **21 WMA**: 1.3550 (resistance to break)
- **Golden Cross**: Potential if 50 WMA crosses above 200 WMA
---
## 9. MULTI-TIMEFRAME ANALYSIS
### 5-Minute Chart
- **Trend**: Sideways consolidation
- **Support**: 1.3540
- **Resistance**: 1.3570
- **Breakout Direction**: Awaiting catalyst
### 15-Minute Chart
- **Pattern**: Ascending triangle
- **Breakout Target**: 1.3590-1.3610
- **Volume**: Decreasing on pullbacks (bullish)
### 30-Minute Chart
- **Trend**: Bullish flag formation
- **Measured Move**: 1.3650 target
- **Key Level**: 1.3555 support
### 1-Hour Chart
- **Elliott Wave**: Corrective Wave 4 completion
- **Harmonic**: ABCD pattern near D point
- **Target**: 1.3620-1.3650
### 4-Hour Chart
- **Primary Trend**: Bullish
- **Correction**: Complex WXY structure
- **Upside Target**: 1.3750-1.3800
### Daily Chart
- **Major Trend**: Upward
- **Pattern**: Bull flag continuation
- **Long-term Target**: 1.3850-1.4000
### Weekly Chart
- **Structure**: Impulsive Wave 3
- **Support**: 1.3400-1.3450
- **Resistance**: 1.3800-1.3850
### Monthly Chart
- **Trend**: Long-term bullish
- **Key Resistance**: 1.4000-1.4200
- **Major Support**: 1.3200-1.3300
---
## 10. TRADING STRATEGY & OUTLOOK
### Intraday Strategy (5M-1H)
**Setup**: Buy dips approach
- **Entry Zone**: 1.3540-1.3560
- **Stop Loss**: 1.3520
- **Target 1**: 1.3590
- **Target 2**: 1.3620
### Swing Trading Strategy (4H-Daily)
**Setup**: Breakout continuation
- **Entry**: Above 1.3580 (confirmed breakout)
- **Stop Loss**: 1.3510
- **Target 1**: 1.3680
- **Target 2**: 1.3750
- **Target 3**: 1.3850
### Position Trading (Weekly-Monthly)
**Setup**: Long-term bullish bias
- **Accumulation Zone**: 1.3480-1.3550
- **Major Target**: 1.3850-1.4000
- **Risk Management**: Trail stops below key moving averages
---
## 11. KEY LEVELS SUMMARY
### Critical Support Levels
1. **1.3520** - Immediate support (Tenkan-sen, 50 SMA)
2. **1.3480** - Major support (Blue Box, Kijun-sen, 100 EMA)
3. **1.3450** - Cloud top, 200 SMA confluence
4. **1.3400** - Weekly support level
### Critical Resistance Levels
1. **1.3580** - Immediate resistance (breakout level)
2. **1.3620** - VWAP +1σ, harmonic target
3. **1.3680** - Bollinger upper band, Gann resistance
4. **1.3750** - Major confluence resistance
5. **1.3850** - Elliott Wave target, monthly resistance
---
## 12. RISK ASSESSMENT
### Bullish Scenario (Probability: 65%)
- **Catalyst**: Break above 1.3580
- **Target**: 1.3750-1.3850
- **Timeline**: 2-3 weeks
### Bearish Scenario (Probability: 35%)
- **Invalidation**: Break below 1.3480
- **Target**: 1.3400-1.3350
- **Timeline**: 1-2 weeks
### Key Events to Watch
1. Central bank communications
2. Economic data releases
3. Risk sentiment shifts
4. Technical breakout confirmations
---
## CONCLUSION
GBPUSD is positioned for potential upside continuation based on multiple technical confluence factors. The Elliott Wave analysis suggests we're in an impulsive upward structure, while harmonic patterns indicate completion of corrective phases. Gann analysis supports higher targets with favorable time cycles approaching.
**Recommended Bias**: Cautiously Bullish
**Primary Strategy**: Buy dips near support, target higher levels
**Risk Management**: Strict stops below key support confluences
The technical picture favors patient bulls who can capitalize on the current consolidation phase for potential moves toward 1.3750-1.3850 in the coming weeks.
For those interested in further developing their trading skills based on these types of analyses, consider exploring the mentoring program offered by Shunya dot Trade.(world wide web shunya dot trade)
I welcome your feedback on this analysis, as it will inform and enhance my future work.
Regards,
Shunya.Trade
world wide web shunya dot trade
⚠️ Disclaimer: This post is educational content and does not constitute investment advice, financial advice, or trading recommendations. The views expressed here are based on technical analysis and are shared solely for informational purposes. The stock market is subject to risks, including capital loss, and readers should exercise due diligence before investing. We do not take responsibility for decisions made based on this content. Consult a certified financial advisor for personalized guidance.
GBPUSD – WEEKLY FORECAST Q3 | W34 | Y25📊 GBPUSD – WEEKLY FORECAST
Q3 | W32 | Y25
Weekly Forecast 🔍📅
Here’s a short diagnosis of the current chart setup 🧠📈
Higher time frame order blocks have been identified — these are our patient points of interest 🎯🧭.
It’s crucial to wait for a confirmed break of structure 🧱✅ before forming a directional bias.
This keeps us disciplined and aligned with what price action is truly telling us.
📈 Risk Management Protocols
🔑 Core principles:
Max 1% risk per trade
Only execute at pre-identified levels
Use alerts, not emotion
Stick to your RR plan — minimum 1:2
🧠 You’re not paid for how many trades you take, you’re paid for how well you manage risk.
🧠 Weekly FRGNT Insight
"Trade what the market gives, not what your ego wants."
Stay mechanical. Stay focused. Let the probabilities work.
FRGNT
FX:GBPUSD

British Pound can rise to 1.3680 points, exiting from wedgeHello traders, I want share with you my opinion about British Pound. The market dynamic for the British pound has undergone a significant reversal, shifting from a well-defined downward channel to a new bullish phase following a strong breakout from the buyer zone. This change in control has established a new upward trend, which has since been developing within the confines of a large upward wedge. The price action within this wedge has been constructive, with the asset making a series of higher highs and higher lows. Currently, the pair is undergoing a corrective pull-back after testing the seller zone near the top of the formation, and it is now approaching a key confluence of support around the 1.3535 level, where the ascending support line of the wedge is located. The primary working hypothesis is a long scenario, which anticipates that this correction will find strong support in this area, leading to a new upward impulse. The scenario further projects that this new impulse will not only carry the price to the wedge's resistance line but will have enough momentum to force a breakout to the upside, signalling an acceleration of the trend. Therefore, the TP for this breakout scenario is logically placed at the 1.3680 level, a target that represents a potential measured move following the resolution of the multi-week wedge pattern. Please share this idea with your friends and click Boost 🚀
Disclaimer: As part of ThinkMarkets’ Influencer Program, I am sponsored to share and publish their charts in my analysis.

GBPCAD - Bulls in Control, But Supply Zone Ahead🏹 GBPCAD has been climbing within a steep bullish channel , approaching a key supply zone around 1.8750. As long as the channel holds, buyers remain in control.
However, if price rejects this supply area and breaks below the 1.8670 support, the bears could take over, potentially triggering a deeper correction.
📌Price is now at a decisive point — a breakout above supply could open the door for fresh highs, while a rejection and channel break could mark the start of a bearish phase.
⚖️ Bulls need a clean break above supply for further upside, while bears are eyeing a channel break for a reversal.
📚 Always follow your trading plan regarding entry, risk management, and trade management.
Good luck!
All Strategies Are Good; If Managed Properly!
~Richard Nasr
Disclosure: I am part of Trade Nation's Influencer program and receive a monthly fee for using their TradingView charts in my analysis.
