EUR/GBP - Triangle Breakout (16.10.2025)📊 Setup Overview:
EUR/GBP has formed a Symmetrical Triangle and is now breaking below the lower trendline support, signaling a bearish continuation setup. The recent cloud cross confirms bearish momentum, aligning perfectly with the price structure for a potential downside move.
📈 Trade Plan: Bias: Bearish
Sell Entry Zone: Below 0.8680 (after breakout confirmation)
1st Target: 0.8655 ✅
2nd Target: 0.8640 🎯
Invalidation: Above 0.8715 resistance zone
🧩 Supporting Factors:
Clear Triangle Breakout pattern breakdown
Cloud cross confirming bearish momentum
Price trading below Ichimoku Cloud, showing downside pressure
Volume profile supports potential drop toward the next demand zone
#EURGBP #Forex #PriceAction #TechnicalAnalysis #TradingView #ChartPatterns #TriangleBreakout #Ichimoku #BearishSetup #ForexSignals #FXTrading #ChartsDontLie
⚠️ Disclaimer:
This chart is for educational and analytical purposes only, not financial advice. Always manage your risk wisely and confirm setups with your own analysis before trading.
💬 Support the Analysis:
If you found this helpful — Like 👍, Comment 💬, and Follow ✅ for daily Forex setups, pattern breakdowns, and chart updates!
GBP

GBPJPY H4 | Sharp Bearish ReversalGBP/JPY is reacting off the sell entry, whichis a pullback resistance that lines up with the 23.6% Fibonacci retracement and could drop from this level to veto the downside.
Sell entry is at 202.51, which is a pullback resistance that aligns with the 23.6% Fibonacci retracement
Stop loss is at 204.01, which is a pullback resistance that lines up with he 61.8% Fibonacci retracement.
Take profit is at 200.41, whichis a pullback support that aligns with the 61.8% Fibonacci retracement.
High Risk Investment Warning
Trading Forex/CFDs on margin carries a high level of risk and may not be suitable for all investors. Leverage can work against you.
Stratos Markets Limited (tradu.com ):
CFDs are complex instruments and come with a high risk of losing money rapidly due to leverage. 65% of retail investor accounts lose money when trading CFDs with this provider. You should consider whether you understand how CFDs work and whether you can afford to take the high risk of losing your money.
Stratos Europe Ltd (tradu.com ):
CFDs are complex instruments and come with a high risk of losing money rapidly due to leverage. 66% of retail investor accounts lose money when trading CFDs with this provider. You should consider whether you understand how CFDs work and whether you can afford to take the high risk of losing your money.
Stratos Global LLC (tradu.com ):
Losses can exceed deposits.
Please be advised that the information presented on TradingView is provided to Tradu (‘Company’, ‘we’) by a third-party provider (‘TFA Global Pte Ltd’). Please be reminded that you are solely responsible for the trading decisions on your account. There is a very high degree of risk involved in trading. Any information and/or content is intended entirely for research, educational and informational purposes only and does not constitute investment or consultation advice or investment strategy. The information is not tailored to the investment needs of any specific person and therefore does not involve a consideration of any of the investment objectives, financial situation or needs of any viewer that may receive it. Kindly also note that past performance is not a reliable indicator of future results. Actual results may differ materially from those anticipated in forward-looking or past performance statements. We assume no liability as to the accuracy or completeness of any of the information and/or content provided herein and the Company cannot be held responsible for any omission, mistake nor for any loss or damage including without limitation to any loss of profit which may arise from reliance on any information supplied by TFA Global Pte Ltd.
The speaker(s) is neither an employee, agent nor representative of Tradu and is therefore acting independently. The opinions given are their own, constitute general market commentary, and do not constitute the opinion or advice of Tradu or any form of personal or investment advice. Tradu neither endorses nor guarantees offerings of third-party speakers, nor is Tradu responsible for the content, veracity or opinions of third-party speakers, presenters or participants.

Bullish momentum to extend?Cable (GBP/USD) has bounced off the pivot and could rise to the multi swing high resistance.
Pivot: 1.3354
1st Support: 1.3312
1st Resistance: 1.3486
Disclaimer:
The above opinions given constitute general market commentary, and do not constitute the opinion or advice of IC Markets or any form of personal or investment advice.
Any opinions, news, research, analyses, prices, other information, or links to third-party sites contained on this website are provided on an "as-is" basis, are intended only to be informative, is not an advice nor a recommendation, nor research, or a record of our trading prices, or an offer of, or solicitation for a transaction in any financial instrument and thus should not be treated as such. The information provided does not involve any specific investment objectives, financial situation and needs of any specific person who may receive it. Please be aware, that past performance is not a reliable indicator of future performance and/or results. Past Performance or Forward-looking scenarios based upon the reasonable beliefs of the third-party provider are not a guarantee of future performance. Actual results may differ materially from those anticipated in forward-looking or past performance statements. IC Markets makes no representation or warranty and assumes no liability as to the accuracy or completeness of the information provided, nor any loss arising from any investment based on a recommendation, forecast or any information supplied by any third-party.

GBPJPY starting a new multi-year Bear Cycle.The GBPJPY pair gave us recently (October 02, see chart below) an excellent buy signal on the 1D MA100, which instantly hit our 201.200 Target:
This time we view the market on the longest scale possible, the 1M time-frame, where since August 1990 High, it has been declining under the pressure of a Lower Highs trend-line.
The price is approaching that Lower Highs trend-line again after more than 18 years and in our perspective, sell any rally is the way to go long-term as it has much greater return potential than risk.
The first two Bearish Legs of this pattern (Bear Cycles) have declined by around -55%, the next one was shorter at -37.35%. As a result, we expect a minimum of -37.35% decline from the Lower Highs trend-line, which gives us a long-term Target of 136.000.
It is worth pointing out that the 1M Golden Cross that was priced in December 2023, is a formation that last time it emerged (December 2005), preceded a market Top. Also notice the presence of the 1M RSI Resistance Zone, which is holding since 1990 and when the RSI double tops there, it has been the most reliable Sell Signal.
-------------------------------------------------------------------------------
** Please LIKE 👍, FOLLOW ✅, SHARE 🙌 and COMMENT ✍ if you enjoy this idea! Also share your ideas and charts in the comments section below! This is best way to keep it relevant, support us, keep the content here free and allow the idea to reach as many people as possible. **
-------------------------------------------------------------------------------
💸💸💸💸💸💸
👇 👇 👇 👇 👇 👇

GBPJPY H1 | Signs of a Bearish ReversalBased on the H1 chart analysis, we can see that the price is reacting off the sell entry, which is a pullback resistance, and could drop from this level to the take profit.
Sell entry is at 202.22, whichis a pullback resistance.
Stop loss is at 203.41, which is a swing high resistance.
Take profit is at 200.49, whichis a pullback support that line sup with the 78.6% Fibonacci projection.
High Risk Investment Warning
Trading Forex/CFDs on margin carries a high level of risk and may not be suitable for all investors. Leverage can work against you.
Stratos Markets Limited (tradu.com):
CFDs are complex instruments and come with a high risk of losing money rapidly due to leverage. 65% of retail investor accounts lose money when trading CFDs with this provider. You should consider whether you understand how CFDs work and whether you can afford to take the high risk of losing your money.
Stratos Europe Ltd (tradu.com ):
CFDs are complex instruments and come with a high risk of losing money rapidly due to leverage. 66% of retail investor accounts lose money when trading CFDs with this provider. You should consider whether you understand how CFDs work and whether you can afford to take the high risk of losing your money.
Stratos Global LLC (tradu.com ):
Losses can exceed deposits.
Please be advised that the information presented on TradingView is provided to Tradu (‘Company’, ‘we’) by a third-party provider (‘TFA Global Pte Ltd’). Please be reminded that you are solely responsible for the trading decisions on your account. There is a very high degree of risk involved in trading. Any information and/or content is intended entirely for research, educational and informational purposes only and does not constitute investment or consultation advice or investment strategy. The information is not tailored to the investment needs of any specific person and therefore does not involve a consideration of any of the investment objectives, financial situation or needs of any viewer that may receive it. Kindly also note that past performance is not a reliable indicator of future results. Actual results may differ materially from those anticipated in forward-looking or past performance statements. We assume no liability as to the accuracy or completeness of any of the information and/or content provided herein and the Company cannot be held responsible for any omission, mistake nor for any loss or damage including without limitation to any loss of profit which may arise from reliance on any information supplied by TFA Global Pte Ltd.
The speaker(s) is neither an employee, agent nor representative of Tradu and is therefore acting independently. The opinions given are their own, constitute general market commentary, and do not constitute the opinion or advice of Tradu or any form of personal or investment advice. Tradu neither endorses nor guarantees offerings of third-party speakers, nor is Tradu responsible for the content, veracity or opinions of third-party speakers, presenters or participants.

EUR/GBP - Multi time frame Analysis🔥 EUR/GBP — Fun but Deeper MTF Plan 🔥
Bias
Bullish across HTFs. Weekly + Daily demand stacked (0.8680–0.8700 riding on top of 0.8580–0.8620). Liquidity trendline above = magnet 🎯
Technical Breakdown
Weekly : Rising wedge grind, BOS history intact. As long as 0.8580 holds, topside liquidity at 0.8780–0.8800 is the draw.
Daily : Fresh reaction from 0.8680–0.8700 demand; higher-low structure pointing to 0.8750–0.8770 first stop.
1H : Sweep → MSS over 50EMA. Grey 1H POI 0.8690–0.8705 = sweet dip zone. If deeper, last defensive line is 0.8680 (daily base).
Execution (Scenarios)
A) Quick tag & go (primary):
Buy 0.8690–0.8705 → TP1 0.8745, TP2 0.8758, TP3 0.8775–0.8785 (liquidity sweep).
SL: 0.8672 (clean under daily base). R:R ≈ 1:2–1:3.
B) Deeper discount (secondary):
If we flush the POI, watch 0.8680–0.8688 for a wick + reclaim → same targets.
SL: 0.8665.
Risk Management
Risk 0.5–1% per idea. Scale out 30/40/30 at TP1/TP2/TP3.
If 1H closes below 0.8680, step aside—bull script broken short-term.
No chasing above 0.8750; wait for a pullback or a clean breakout-retest.
Trader Checklist ✅
HTF bias aligns? ✔️
Price into 1H POI or daily base? ✔️
M5/M15 shift back to bullish on entry? ✔️
Spread/news clean? ✔️
Then send it 🚀

Potential bullish rise?GBP/USD has reacted off the support level, which is a pullback support and could rise from this level to our take profit.
Entry: 1.3284
Why we like it:
There is a pullback support level.
Stop loss: 1.3260
Why we like it:
There is a multi-swing low support level.
Take profit: 1.3353
Why we like it:
There is an overlap resistance level.
Enjoying your TradingView experience? Review us!
Please be advised that the information presented on TradingView is provided to Vantage (‘Vantage Global Limited’, ‘we’) by a third-party provider (‘Everest Fortune Group’). Please be reminded that you are solely responsible for the trading decisions on your account. There is a very high degree of risk involved in trading. Any information and/or content is intended entirely for research, educational and informational purposes only and does not constitute investment or consultation advice or investment strategy. The information is not tailored to the investment needs of any specific person and therefore does not involve a consideration of any of the investment objectives, financial situation or needs of any viewer that may receive it. Kindly also note that past performance is not a reliable indicator of future results. Actual results may differ materially from those anticipated in forward-looking or past performance statements. We assume no liability as to the accuracy or completeness of any of the information and/or content provided herein and the Company cannot be held responsible for any omission, mistake nor for any loss or damage including without limitation to any loss of profit which may arise from reliance on any information supplied by Everest Fortune Group.

GBP/USD - Breakout Pattern (14.10.2025)The GBP/USD pair on the M30 timeframe presents a Potential Buying Opportunity due to a recent Formation of a Breakout Pattern.
This suggests a shift in momentum towards the upside and a higher likelihood of further advances in the coming hours.
Possible Long Trade:
Entry: Consider Entering A Long Position around Trendline Of The Pattern.
Target Levels:
1st Resistance – 1.3434
2nd Resistance – 1.3484
🎁 Please hit the like button and
🎁 Leave a comment to support for My Post !
Your likes and comments are incredibly motivating and will encourage me to share more analysis with you.
#GBPUSD #Forex #Trading #TechnicalAnalysis #PriceAction #ForexSignals #BreakoutTrading #Ichimoku #FXTrading #BullishSetup #TradingView
⚠️ Disclaimer:
This analysis is for educational purposes only and not financial advice. Always use proper risk management and conduct your own research before trading.
Best Regards, KABHI_TA_TRADING
Thank you.

GBPJPY H1 | Bullish Bounce OffBased on the H1 chart analysis, we can see that the price has bounced off the buy entry, which is a pullback support, and could rise from this level to the upside.
Buy entry is at 202.81, which is a pullback support.
Stop loss is at 202.11, which is an overlap support.
Take profit is at 204.05, which is a pullback resistance that lines up with the 61.8% Fibonacci retracement.
High Risk Investment Warning
Trading Forex/CFDs on margin carries a high level of risk and may not be suitable for all investors. Leverage can work against you.
Stratos Markets Limited (tradu.com ):
CFDs are complex instruments and come with a high risk of losing money rapidly due to leverage. 65% of retail investor accounts lose money when trading CFDs with this provider. You should consider whether you understand how CFDs work and whether you can afford to take the high risk of losing your money.
Stratos Europe Ltd (tradu.com ):
CFDs are complex instruments and come with a high risk of losing money rapidly due to leverage. 66% of retail investor accounts lose money when trading CFDs with this provider. You should consider whether you understand how CFDs work and whether you can afford to take the high risk of losing your money.
Stratos Global LLC (tradu.com ):
Losses can exceed deposits.
Please be advised that the information presented on TradingView is provided to Tradu (‘Company’, ‘we’) by a third-party provider (‘TFA Global Pte Ltd’). Please be reminded that you are solely responsible for the trading decisions on your account. There is a very high degree of risk involved in trading. Any information and/or content is intended entirely for research, educational and informational purposes only and does not constitute investment or consultation advice or investment strategy. The information is not tailored to the investment needs of any specific person and therefore does not involve a consideration of any of the investment objectives, financial situation or needs of any viewer that may receive it. Kindly also note that past performance is not a reliable indicator of future results. Actual results may differ materially from those anticipated in forward-looking or past performance statements. We assume no liability as to the accuracy or completeness of any of the information and/or content provided herein and the Company cannot be held responsible for any omission, mistake nor for any loss or damage including without limitation to any loss of profit which may arise from reliance on any information supplied by TFA Global Pte Ltd.
The speaker(s) is neither an employee, agent nor representative of Tradu and is therefore acting independently. The opinions given are their own, constitute general market commentary, and do not constitute the opinion or advice of Tradu or any form of personal or investment advice. Tradu neither endorses nor guarantees offerings of third-party speakers, nor is Tradu responsible for the content, veracity or opinions of third-party speakers, presenters or participants.

Bullish bounce for the Cable?The Cable (GBP/USD) is falling towards the pivot, which is a pullback support that aligns with the 50% Fibonacci retracement and oculd bounce to the 1st resistance, which acts as an overlap resistance.
Pivot: 1.3312
1st Support: 1.3265
1st Resistance: 1.3419
Disclaimer:
The above opinions given constitute general market commentary, and do not constitute the opinion or advice of IC Markets or any form of personal or investment advice.
Any opinions, news, research, analyses, prices, other information, or links to third-party sites contained on this website are provided on an "as-is" basis, are intended only to be informative, is not an advice nor a recommendation, nor research, or a record of our trading prices, or an offer of, or solicitation for a transaction in any financial instrument and thus should not be treated as such. The information provided does not involve any specific investment objectives, financial situation and needs of any specific person who may receive it. Please be aware, that past performance is not a reliable indicator of future performance and/or results. Past Performance or Forward-looking scenarios based upon the reasonable beliefs of the third-party provider are not a guarantee of future performance. Actual results may differ materially from those anticipated in forward-looking or past performance statements. IC Markets makes no representation or warranty and assumes no liability as to the accuracy or completeness of the information provided, nor any loss arising from any investment based on a recommendation, forecast or any information supplied by any third-party.

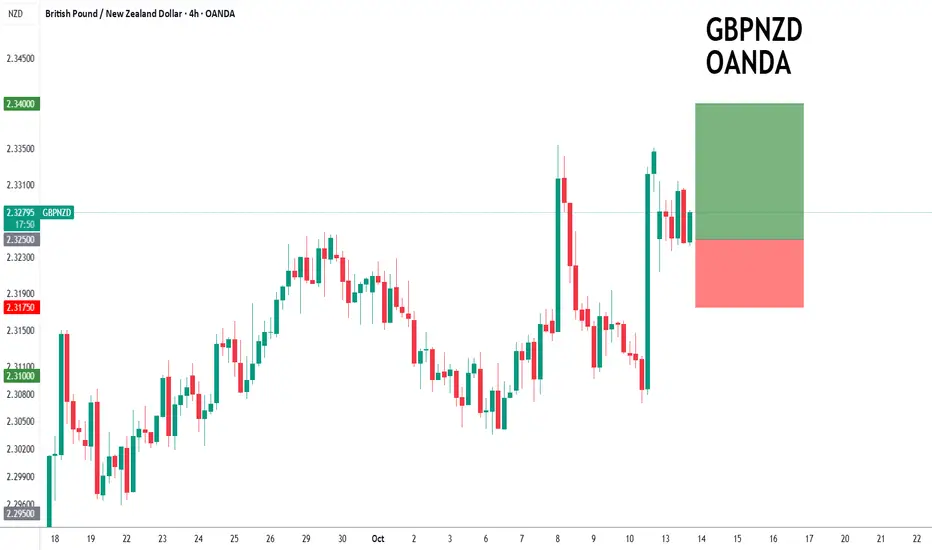
GBPNZD to continue in the upward move?GBPNZD - 24h expiry
There is no clear indication that the upward move is coming to an end.
Although we remain bullish overall, a correction is possible with plenty of room to move lower without impacting the trend higher.
Risk/Reward would be poor to call a buy from current levels.
A move through 2.3350 will confirm the bullish momentum.
The measured move target is 2.3425.
We look to Buy at 2.3250 (stop at 2.3175)
Our profit targets will be 2.3400 and 2.3425
Resistance: 2.3350 / 2.3400 / 2.3425
Support: 2.3250 / 2.3200 / 2.3175
Risk Disclaimer
The trade ideas beyond this page are for informational purposes only and do not constitute investment advice or a solicitation to trade. This information is provided by Signal Centre, a third-party unaffiliated with OANDA, and is intended for general circulation only. OANDA does not guarantee the accuracy of this information and assumes no responsibilities for the information provided by the third party. The information does not take into account the specific investment objectives, financial situation, or particular needs of any particular person. You should take into account your specific investment objectives, financial situation, and particular needs before making a commitment to trade, including seeking, under a separate engagement, as you deem fit.
You accept that you assume all risks in independently viewing the contents and selecting a chosen strategy.
Where the research is distributed in Singapore to a person who is not an Accredited Investor, Expert Investor or an Institutional Investor, Oanda Asia Pacific Pte Ltd (“OAP“) accepts legal responsibility for the contents of the report to such persons only to the extent required by law. Singapore customers should contact OAP at 6579 8289 for matters arising from, or in connection with, the information/research distributed.
#032: LONG GBP/USD Investment Opportunity
After a period of consolidation, the pair is showing the first signs of strength near a key demand area. Hello, I'm Forex Trader Andrea Russo, an independent trader and prop trader with $200,000 in capital under management. Thank you in advance for your time.
The recent price structure suggests that the bearish pressure is gradually losing steam, while the market appears to be preparing for a possible directional recovery to the upside.
From a technical perspective, the sequence of lower highs and lower lows appears to be slowing. The latest pullback highlighted the absorption of selling pressure and the solid defense of a significant area of liquidity, tested several times in the past—a behavior that often precedes a structural reversal.
At the macroeconomic level, the most recent dynamics point to a temporary equilibrium between the two currencies. Dollar flow remains strong overall, but in the short term, the pound appears capable of recovering some of its lost ground. This scenario opens up room for corrective or technical rebound movements in favor of the British pound.
Market sentiment also still appears strongly biased toward the opposite side, reinforcing a contrarian view. When the majority of traders are positioned in one direction, liquidity tends to move in the opposite direction—and that's often where the best opportunities arise.
In summary, my decision is based on three converging factors: technical stabilization in an area of significant demand, the gradual exhaustion of bearish pressure, and a context of contrarian sentiment. If momentum holds, the subsequent move could unfold with favorable momentum and limited upside resistance.

GBPUSD possible ideaGBPUSD has been overall bullish with some very deep retracements. It has currently made a retracement back into a demand zone it left behind when it shifted structure internally. With the aid of liquidity it just swept, it could be making its final preparations to use the demand zone it's currently on to push even higher, targeting the latest weak swing high.

#031: EUR/GBP Long Investment Opportunity
In recent movements on EUR/GBP, the price has shown a corrective trend: it attempted to rebound towards medium resistance levels, but encountered significant obstacles. Hello, I'm Forex Trader Andrea Russo, an independent trader and prop trader with $200,000 in capital under management, and I thank you in advance for your time.
There is a narrative in which the market could breathe (correct) before attempting a new attack on the main resistance level. In this scenario, rather than immediately entering "at the current price," I preferred to place a BUY LIMIT in an already identified technical support zone, waiting for the market to decline there and "requalify" the zone as a starting point.
The market has shown weakness in the short term: it has retraced from high levels, but it is not yet clear whether buyers have taken over.
I only want to buy if the price shows that the zone has held. This happens if it drops to the level, hits the BUY LIMIT, and then reverses.
The retail position is now in a "COUNTERVAILING" pattern and therefore in my favor. I'll update you if there are any changes to the ongoing trade.

GBPJPY H1 | Potential Bearish Reversal at 50% Fib ResistanceBased on the H1 chart analysis, we could see the price rise to the sell entry, which is a pullback resistance that lines up with the 50% Fibonacci retracement and could reverse from this level to the downside.
Sell entry is at 203.74, which is a pullback resistance that aligns with the 50% Fibonacci retracement.
Stop loss is at 205.02, whichis a swing high resistance.
Take profit is at 201.25, which is a pullback support that aligns with the 50% Fibonacci retracement.
High Risk Investment Warning
Trading Forex/CFDs on margin carries a high level of risk and may not be suitable for all investors. Leverage can work against you.
Stratos Markets Limited (tradu.com ):
CFDs are complex instruments and come with a high risk of losing money rapidly due to leverage. 65% of retail investor accounts lose money when trading CFDs with this provider. You should consider whether you understand how CFDs work and whether you can afford to take the high risk of losing your money.
Stratos Europe Ltd (tradu.com ):
CFDs are complex instruments and come with a high risk of losing money rapidly due to leverage. 66% of retail investor accounts lose money when trading CFDs with this provider. You should consider whether you understand how CFDs work and whether you can afford to take the high risk of losing your money.
Stratos Global LLC (tradu.com ):
Losses can exceed deposits.
Please be advised that the information presented on TradingView is provided to Tradu (‘Company’, ‘we’) by a third-party provider (‘TFA Global Pte Ltd’). Please be reminded that you are solely responsible for the trading decisions on your account. There is a very high degree of risk involved in trading. Any information and/or content is intended entirely for research, educational and informational purposes only and does not constitute investment or consultation advice or investment strategy. The information is not tailored to the investment needs of any specific person and therefore does not involve a consideration of any of the investment objectives, financial situation or needs of any viewer that may receive it. Kindly also note that past performance is not a reliable indicator of future results. Actual results may differ materially from those anticipated in forward-looking or past performance statements. We assume no liability as to the accuracy or completeness of any of the information and/or content provided herein and the Company cannot be held responsible for any omission, mistake nor for any loss or damage including without limitation to any loss of profit which may arise from reliance on any information supplied by TFA Global Pte Ltd.
The speaker(s) is neither an employee, agent nor representative of Tradu and is therefore acting independently. The opinions given are their own, constitute general market commentary, and do not constitute the opinion or advice of Tradu or any form of personal or investment advice. Tradu neither endorses nor guarantees offerings of third-party speakers, nor is Tradu responsible for the content, veracity or opinions of third-party speakers, presenters or participants.

GBPUSD H4 | Bullish Momentum BuildingGBP/USD is falling towards the buy entry, which is a pullback support and could bounce from this level to the upside.
Buy entry is at 1.3314, which is a pullback support.
Stop loss is at 1.3243, which is a pullback support that lines up with the 138.2% Fibonacci extension.
Take profit is at 1.3423, which is an overlap resistance that lines up with the 61.8% Fibonacci retracement.
High Risk Investment Warning
Trading Forex/CFDs on margin carries a high level of risk and may not be suitable for all investors. Leverage can work against you.
Stratos Markets Limited (tradu.com ):
CFDs are complex instruments and come with a high risk of losing money rapidly due to leverage. 65% of retail investor accounts lose money when trading CFDs with this provider. You should consider whether you understand how CFDs work and whether you can afford to take the high risk of losing your money.
Stratos Europe Ltd (tradu.com ):
CFDs are complex instruments and come with a high risk of losing money rapidly due to leverage. 66% of retail investor accounts lose money when trading CFDs with this provider. You should consider whether you understand how CFDs work and whether you can afford to take the high risk of losing your money.
Stratos Global LLC (tradu.com ):
Losses can exceed deposits.
Please be advised that the information presented on TradingView is provided to Tradu (‘Company’, ‘we’) by a third-party provider (‘TFA Global Pte Ltd’). Please be reminded that you are solely responsible for the trading decisions on your account. There is a very high degree of risk involved in trading. Any information and/or content is intended entirely for research, educational and informational purposes only and does not constitute investment or consultation advice or investment strategy. The information is not tailored to the investment needs of any specific person and therefore does not involve a consideration of any of the investment objectives, financial situation or needs of any viewer that may receive it. Kindly also note that past performance is not a reliable indicator of future results. Actual results may differ materially from those anticipated in forward-looking or past performance statements. We assume no liability as to the accuracy or completeness of any of the information and/or content provided herein and the Company cannot be held responsible for any omission, mistake nor for any loss or damage including without limitation to any loss of profit which may arise from reliance on any information supplied by TFA Global Pte Ltd.
The speaker(s) is neither an employee, agent nor representative of Tradu and is therefore acting independently. The opinions given are their own, constitute general market commentary, and do not constitute the opinion or advice of Tradu or any form of personal or investment advice. Tradu neither endorses nor guarantees offerings of third-party speakers, nor is Tradu responsible for the content, veracity or opinions of third-party speakers, presenters or participants.

Falling towards major support?The Cable (GBP/USD) is falling towards the pivot which has been identified as an overlap support and could bounce to the 1st resistance.
Pivot: 1.3144
1st Support: 1.2875
1st Resistance: 1.3478
Disclaimer:
The above opinions given constitute general market commentary, and do not constitute the opinion or advice of IC Markets or any form of personal or investment advice.
Any opinions, news, research, analyses, prices, other information, or links to third-party sites contained on this website are provided on an "as-is" basis, are intended only to be informative, is not an advice nor a recommendation, nor research, or a record of our trading prices, or an offer of, or solicitation for a transaction in any financial instrument and thus should not be treated as such. The information provided does not involve any specific investment objectives, financial situation and needs of any specific person who may receive it. Please be aware, that past performance is not a reliable indicator of future performance and/or results. Past Performance or Forward-looking scenarios based upon the reasonable beliefs of the third-party provider are not a guarantee of future performance. Actual results may differ materially from those anticipated in forward-looking or past performance statements. IC Markets makes no representation or warranty and assumes no liability as to the accuracy or completeness of the information provided, nor any loss arising from any investment based on a recommendation, forecast or any information supplied by any third-party.

Bullish reversal for the Cable?The price is falling towards the support level, which is a pullback support that aligns with the 50% Fibonacci retracement and could bounce from this level to our take profit.
Entry: 1.3314
Why we like it:
There is a pullback support level that lines up with the 50% Fibonacci retracement.
Stop loss: 1.3261
Why we like it:
There is a swing low support level.
Take profit: 1.3417
Why we like it:
There is an overlap resistance level.
Enjoying your TradingView experience? Review us!
Please be advised that the information presented on TradingView is provided to Vantage (‘Vantage Global Limited’, ‘we’) by a third-party provider (‘Everest Fortune Group’). Please be reminded that you are solely responsible for the trading decisions on your account. There is a very high degree of risk involved in trading. Any information and/or content is intended entirely for research, educational and informational purposes only and does not constitute investment or consultation advice or investment strategy. The information is not tailored to the investment needs of any specific person and therefore does not involve a consideration of any of the investment objectives, financial situation or needs of any viewer that may receive it. Kindly also note that past performance is not a reliable indicator of future results. Actual results may differ materially from those anticipated in forward-looking or past performance statements. We assume no liability as to the accuracy or completeness of any of the information and/or content provided herein and the Company cannot be held responsible for any omission, mistake nor for any loss or damage including without limitation to any loss of profit which may arise from reliance on any information supplied by Everest Fortune Group.

AUDUSD Eyes 0.64800 Support as Bullish Structure Holds FirmHey Traders,
In today’s session, we’re closely monitoring AUDUSD for a potential buying opportunity around the 0.64800 zone. The pair continues to trade within a broader uptrend, and the current pullback appears to be a healthy correction toward a key support and resistance confluence near 0.64800.
A sustained reaction from this level could reaffirm the bullish structure, opening the door for a continuation toward recent highs if momentum aligns with a weaker USD backdrop.
Trade safe,
Joe.

EURGBP Shifting to long-term Bearish.The EURGBP pair gave us a very efficient Channel Up buy signal last time (July 11, see chart below) that quickly hit our 0.87400 Target:
That pattern then broke and now we shift back to the longer term dynamics of the market as the trend is shifting from bullish to bearish. The strongest bearish indicator at the moment is the 1D RSI which has been on a Lower Highs Bearish Divergence for months, in contrast to the pair's Higher Highs.
The build up pattern to this (Channel Up into Channel Down following a 1D RSI Bearish Divergence) is similar to the 2022 - 2023 sequence. That fractal turned into a Channel Down following the first Lower High that initially formed a (temporary) Low marginally above the 0.618 Fibonacci retracement level.
As a result, we shift to long-term bearish on the EURGBP pair, targeting 0.84500.
-------------------------------------------------------------------------------
** Please LIKE 👍, FOLLOW ✅, SHARE 🙌 and COMMENT ✍ if you enjoy this idea! Also share your ideas and charts in the comments section below! This is best way to keep it relevant, support us, keep the content here free and allow the idea to reach as many people as possible. **
-------------------------------------------------------------------------------
💸💸💸💸💸💸
👇 👇 👇 👇 👇 👇

GBPJPY H1 | Bearish Drop-Off AheadGBP/JPY is rising towards the sell entry, which is a pullback resistance that lines up with the 38.2% Fibonacci retracement and could drop from this level to the downside.
Sell entry is at 203.18, which is a pullback resistance that aligns with the 38.2% Fibonacci retracement.
Stop loss is at 204.63, which is a pullback resistance that is slightly below the 78.6% Fibonacci retracement.
Take profit is at 202.12, which is an overlap support that is slightly below the 38.2% Fibonacci retracement.
High Risk Investment Warning
Trading Forex/CFDs on margin carries a high level of risk and may not be suitable for all investors. Leverage can work against you.
Stratos Markets Limited (tradu.com ):
CFDs are complex instruments and come with a high risk of losing money rapidly due to leverage. 65% of retail investor accounts lose money when trading CFDs with this provider. You should consider whether you understand how CFDs work and whether you can afford to take the high risk of losing your money.
Stratos Europe Ltd (tradu.com ):
CFDs are complex instruments and come with a high risk of losing money rapidly due to leverage. 66% of retail investor accounts lose money when trading CFDs with this provider. You should consider whether you understand how CFDs work and whether you can afford to take the high risk of losing your money.
Stratos Global LLC (tradu.com ):
Losses can exceed deposits.
Please be advised that the information presented on TradingView is provided to Tradu (‘Company’, ‘we’) by a third-party provider (‘TFA Global Pte Ltd’). Please be reminded that you are solely responsible for the trading decisions on your account. There is a very high degree of risk involved in trading. Any information and/or content is intended entirely for research, educational and informational purposes only and does not constitute investment or consultation advice or investment strategy. The information is not tailored to the investment needs of any specific person and therefore does not involve a consideration of any of the investment objectives, financial situation or needs of any viewer that may receive it. Kindly also note that past performance is not a reliable indicator of future results. Actual results may differ materially from those anticipated in forward-looking or past performance statements. We assume no liability as to the accuracy or completeness of any of the information and/or content provided herein and the Company cannot be held responsible for any omission, mistake nor for any loss or damage including without limitation to any loss of profit which may arise from reliance on any information supplied by TFA Global Pte Ltd.
The speaker(s) is neither an employee, agent nor representative of Tradu and is therefore acting independently. The opinions given are their own, constitute general market commentary, and do not constitute the opinion or advice of Tradu or any form of personal or investment advice. Tradu neither endorses nor guarantees offerings of third-party speakers, nor is Tradu responsible for the content, veracity or opinions of third-party speakers, presenters or participants.

Bullish bounce off pullback support?GBP/JPY is falling towards the pivot which is a pullback support that lines up with the 50% Fibonacci retracement and could bounce to the 1st resistance, which acts as a swing high resistance.
Pivot: 201.34
1st Support: 199.28
1st Resistance: 204.81
Disclaimer:
The above opinions given constitute general market commentary, and do not constitute the opinion or advice of IC Markets or any form of personal or investment advice.
Any opinions, news, research, analyses, prices, other information, or links to third-party sites contained on this website are provided on an "as-is" basis, are intended only to be informative, is not an advice nor a recommendation, nor research, or a record of our trading prices, or an offer of, or solicitation for a transaction in any financial instrument and thus should not be treated as such. The information provided does not involve any specific investment objectives, financial situation and needs of any specific person who may receive it. Please be aware, that past performance is not a reliable indicator of future performance and/or results. Past Performance or Forward-looking scenarios based upon the reasonable beliefs of the third-party provider are not a guarantee of future performance. Actual results may differ materially from those anticipated in forward-looking or past performance statements. IC Markets makes no representation or warranty and assumes no liability as to the accuracy or completeness of the information provided, nor any loss arising from any investment based on a recommendation, forecast or any information supplied by any third-party.

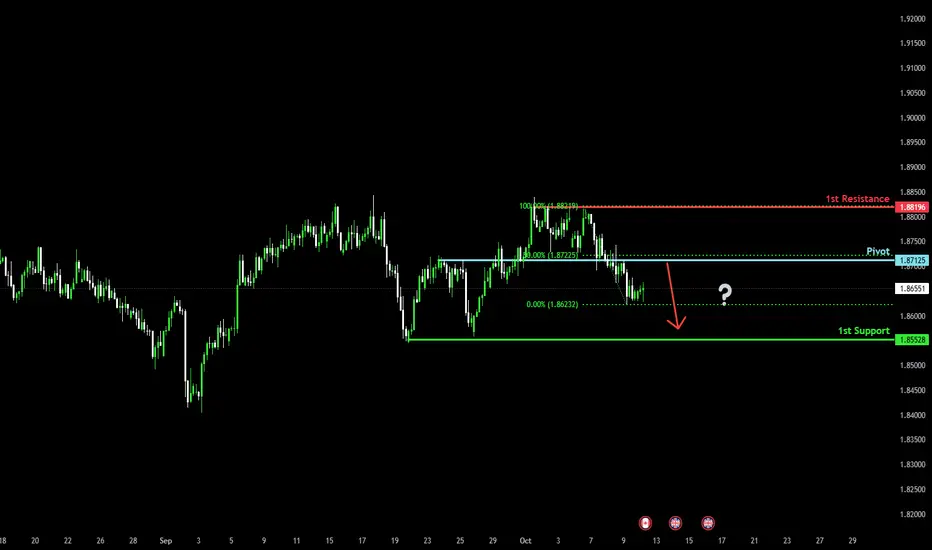
Heading into 50% Fibonacci resistance?GBP/CAD is rising towards the pivot and could reverse to the 1st support.
Pivot: 1.8712
1st Support: 1.8552
1st Resistance: 1.8819
Disclaimer:
The above opinions given constitute general market commentary, and do not constitute the opinion or advice of IC Markets or any form of personal or investment advice.
Any opinions, news, research, analyses, prices, other information, or links to third-party sites contained on this website are provided on an "as-is" basis, are intended only to be informative, is not an advice nor a recommendation, nor research, or a record of our trading prices, or an offer of, or solicitation for a transaction in any financial instrument and thus should not be treated as such. The information provided does not involve any specific investment objectives, financial situation and needs of any specific person who may receive it. Please be aware, that past performance is not a reliable indicator of future performance and/or results. Past Performance or Forward-looking scenarios based upon the reasonable beliefs of the third-party provider are not a guarantee of future performance. Actual results may differ materially from those anticipated in forward-looking or past performance statements. IC Markets makes no representation or warranty and assumes no liability as to the accuracy or completeness of the information provided, nor any loss arising from any investment based on a recommendation, forecast or any information supplied by any third-party.