GBPCAD corrective pullback The GBPCAD remains in a bullish trend, with recent price action showing signs of a corrective pullback within the broader uptrend.
Support Zone: 1.8720 – a key level from previous consolidation. Price is currently testing or approaching this level.
A bullish rebound from 1.8720 would confirm ongoing upside momentum, with potential targets at:
1.8835 – initial resistance
1.8880 – psychological and structural level
1.8920 – extended resistance on the longer-term chart
Bearish Scenario:
A confirmed break and daily close below 1.8720 would weaken the bullish outlook and suggest deeper downside risk toward:
1.8680 – minor support
1.8640 – stronger support and potential demand zone
Outlook:
Bullish bias remains intact while the GBPCAD holds above 1.8720. A sustained break below this level could shift momentum to the downside in the short term.
This communication is for informational purposes only and should not be viewed as any form of recommendation as to a particular course of action or as investment advice. It is not intended as an offer or solicitation for the purchase or sale of any financial instrument or as an official confirmation of any transaction. Opinions, estimates and assumptions expressed herein are made as of the date of this communication and are subject to change without notice. This communication has been prepared based upon information, including market prices, data and other information, believed to be reliable; however, Trade Nation does not warrant its completeness or accuracy. All market prices and market data contained in or attached to this communication are indicative and subject to change without notice.
GBPCAD

GBP/CAD SENDS CLEAR BEARISH SIGNALS|SHORT
GBP/CAD SIGNAL
Trade Direction: short
Entry Level:1.875
Target Level: 1.843
Stop Loss: 1.896
RISK PROFILE
Risk level: medium
Suggested risk: 1%
Timeframe: 1D
Disclosure: I am part of Trade Nation's Influencer program and receive a monthly fee for using their TradingView charts in my analysis.
✅LIKE AND COMMENT MY IDEAS✅

USD/CAD, GBP/CAD, EUR/CAD: Canadian Dollar Bulls Regain FootingPrice action on several Canadian dollar charts suggests that we've entered a phase of strength from the bull camp. With Canadian CPI and a Bank of Canada meeting on tap, there is plenty of opportunity for volatility. Today I outline my bias for USD/CAD, GBP/CAD and EUR/CAD.
Matt Simpson, Market Analyst at City Index and Forex.com (part of StoneX)

Falling towards pullback support?GBP/CAD is falling towards the support level, whic is a pullback support that is slightly above the 50% Fibonacci retracement and could bounce from this level to our take profit.
Entry: 1.8633
Why we like it:
There is a pullback support that is slightly above the 50% Fibonacci retracement.
Stop loss: 1.8516
Why we like it:
There is a pullback support that is slightly above the 78.6% Fibonacci retracement.
Take profit: 1.8821
Why we like it:
There is a swing high resistance.
Enjoying your TradingView experience? Review us!
Please be advised that the information presented on TradingView is provided to Vantage (‘Vantage Global Limited’, ‘we’) by a third-party provider (‘Everest Fortune Group’). Please be reminded that you are solely responsible for the trading decisions on your account. There is a very high degree of risk involved in trading. Any information and/or content is intended entirely for research, educational and informational purposes only and does not constitute investment or consultation advice or investment strategy. The information is not tailored to the investment needs of any specific person and therefore does not involve a consideration of any of the investment objectives, financial situation or needs of any viewer that may receive it. Kindly also note that past performance is not a reliable indicator of future results. Actual results may differ materially from those anticipated in forward-looking or past performance statements. We assume no liability as to the accuracy or completeness of any of the information and/or content provided herein and the Company cannot be held responsible for any omission, mistake nor for any loss or damage including without limitation to any loss of profit which may arise from reliance on any information supplied by Everest Fortune Group.

GBPCAD My Opinion! SELL!
My dear subscribers,
My technical analysis for GBPCAD is below:
The price is coiling around a solid key level - 1.8803
Bias - Bearish
Technical Indicators: Pivot Points Low anticipates a potential price reversal.
Super trend shows a clear sell, giving a perfect indicators' convergence.
Goal - 1.8779
My Stop Loss - 1.8816
About Used Indicators:
By the very nature of the supertrend indicator, it offers firm support and resistance levels for traders to enter and exit trades. Additionally, it also provides signals for setting stop losses
Disclosure: I am part of Trade Nation's Influencer program and receive a monthly fee for using their TradingView charts in my analysis.
———————————
WISH YOU ALL LUCK


Tweezer Top Candlestick Formation Is Great Win SELL Now!on the daily , 4H and 1H time frame we can detect a very strong resistance that pushes the price incredibly to the downside. and right now the price is standing at it. if we took a closer look on the 4h timeframe we will see a very good bearish price action which is ( tweezer top ) candlestick formation which indicates an upcoming bearish movement if it came around a good resistance.
so i believe we have a great sell setup on GBPCAD right now. u can enter with a nice stop loss around 50-70 pips. your target can be all the way to 1.84300. i will keep u guys posted on how this trade will go with. if u have thought on this setup share it with me now in the comments.

GBP_CAD WILL GO UP|LONG|
✅GBP_CAD is trading in an
Uptrend and the pair made
A bullish rebound from the
Horizontal support of 1.8740
So we are bullish biased and
We will be expecting a
Further bullish move up
On Monday
LONG🚀
✅Like and subscribe to never miss a new idea!✅

SHORT ON GBP/CADGBP/CAD has a nice rising wedge at a major supply zone.
Price has failed to make a Higher High and is now starting to make Lower Highs.
Looking to catch 300-400 pips to the downside over the next week or so.

GBPCAD bullish above support at 1.8720The GBPCAD remains in a bullish trend, with recent price action showing signs of a corrective pullback within the broader uptrend.
Support Zone: 1.8720 – a key level from previous consolidation. Price is currently testing or approaching this level.
A bullish rebound from 1.8720 would confirm ongoing upside momentum, with potential targets at:
1.8835 – initial resistance
1.8880 – psychological and structural level
1.8920 – extended resistance on the longer-term chart
Bearish Scenario:
A confirmed break and daily close below 1.8720 would weaken the bullish outlook and suggest deeper downside risk toward:
1.8680 – minor support
1.8640 – stronger support and potential demand zone
Outlook:
Bullish bias remains intact while the GBPCAD holds above 1.8720. A sustained break below this level could shift momentum to the downside in the short term.
This communication is for informational purposes only and should not be viewed as any form of recommendation as to a particular course of action or as investment advice. It is not intended as an offer or solicitation for the purchase or sale of any financial instrument or as an official confirmation of any transaction. Opinions, estimates and assumptions expressed herein are made as of the date of this communication and are subject to change without notice. This communication has been prepared based upon information, including market prices, data and other information, believed to be reliable; however, Trade Nation does not warrant its completeness or accuracy. All market prices and market data contained in or attached to this communication are indicative and subject to change without notice.

GBP-CAD Will Keep Growing! Buy!
Hello,Traders!
GBP-CAD is trading in an
Uptrend and the pair broke
The key horizontal level
Of 1.8723 so we are
Bullish biased and we
Will be expecting a
Further bullish move up
Buy!
Comment and subscribe to help us grow!
Check out other forecasts below too!
Disclosure: I am part of Trade Nation's Influencer program and receive a monthly fee for using their TradingView charts in my analysis.

GBPCAD – Triple Tap Trouble!GBPCAD has been trading within a well-defined range, with price rejecting the 1.8850 resistance zone multiple times in the past.
Each test of this area has led to strong bearish moves, highlighting its significance as a supply zone.
Here’s what the chart shows:
🔴 Resistance Zone: Price is approaching the upper bound of the range, where sellers have consistently stepped in.
🔵 Support Zone: The 1.8300 area remains a solid demand zone, holding price higher on several occasions.
📈 Rising Channel: The latest bullish leg is developing inside an ascending channel, but momentum is slowing near resistance.
⚠️ Short Opportunity: As long as price trades below the resistance, the area remains attractive for short setups targeting the mid-range or lower bound.
Confirmation with bearish candlestick patterns will strengthen the case for a downside move.
📌 Will GBP/CAD respect its range and roll over once again, or will the bulls finally break through?
This analysis is for educational purposes only, not financial advice. Always manage risk properly before taking trades.
📚 Stick to your trading plan regarding entries, risk management, and trade execution.
Good luck!
All Strategies Are Good; If Managed Properly!
~Richard Nasr

TP1/TP2 +300/+600 pips GBPCAD Advanced XABCD Short From S/R 🔸Hello traders, let's review the 1 hour chart for GBPCAD. Strong gains off the lows recently, however price getting overextended and expecting reversal later at/near PRZ/D.
🔸Speculative XABCD structure defined by point X 8795 point A 8300 point B 8720 point C 8440 point D/PRZ 8970 .
🔸Currently most points validated, point D/PRZ is pending.
Short sell at PRZ/D TP1/TP2 +300/+600 pips, swing trade setup.
🔸Recommended strategy for GBPCAD traders: Higher Risk BUY at market SL 60
TP exit at PRZ/D overhead resistance at 8970. Lower risk reversal trade setup:
short from PRZ/D 8970 SL 80 pips TP1 +300 TP2 +600 pips. swing trade setup.
🎁Please hit the like button and
🎁Leave a comment to support our team!
RISK DISCLAIMER:
Trading Futures , Forex, CFDs and Stocks involves a risk of loss.
Please consider carefully if such trading is appropriate for you.
Past performance is not indicative of future results.
Always limit your leverage and use tight stop loss.

GBPCAD Trendline Sell IdeaWith the RSI at 64.84, an overbought level, and the current price at the upper trendline. Hence, based on these conditions, I anticipate a sell on the GBPCAD currency pair.

GBP/CAD BEARISH BIAS RIGHT NOW| SHORT
GBP/CAD SIGNAL
Trade Direction: short
Entry Level: 1.867
Target Level: 1.854
Stop Loss: 1.875
RISK PROFILE
Risk level: medium
Suggested risk: 1%
Timeframe: 8h
Disclosure: I am part of Trade Nation's Influencer program and receive a monthly fee for using their TradingView charts in my analysis.
✅LIKE AND COMMENT MY IDEAS✅

GBP_CAD BEARISH BIAS|SHORT|
✅GBP_CAD has hit a key
Structure level of 1.8740
Which implies a high
Likelihood of a move down
As some market participants
Will be taking profit from
Their long positions
While others will find this
Price level to be good for selling
So as usual we will have a
Chance to ride the wave
Of a bearish correction
SHORT🔥
✅Like and subscribe to never miss a new idea!✅

GBP-CAD Short From Resistance! Sell!
Hello,Traders!
GBP-CAD shot up sharply
And hit a horizontal resistance
Of 1.8740 from where the pair
Is already making a local
Pullback and we will be
Expecting a further bearish
Move down on Monday
Buy!
Comment and subscribe to help us grow!
Check out other forecasts below too!
Disclosure: I am part of Trade Nation's Influencer program and receive a monthly fee for using their TradingView charts in my analysis.

GBPCAD Will Go Up! Long!
Please, check our technical outlook for GBPCAD.
Time Frame: 1D
Current Trend: Bullish
Sentiment: Oversold (based on 7-period RSI)
Forecast: Bullish
The market is approaching a significant support area 1.867.
The underlined horizontal cluster clearly indicates a highly probable bullish movement with target 1.890 level.
P.S
Overbought describes a period of time where there has been a significant and consistent upward move in price over a period of time without much pullback.
Disclosure: I am part of Trade Nation's Influencer program and receive a monthly fee for using their TradingView charts in my analysis.
Like and subscribe and comment my ideas if you enjoy them!


GBPCAD Will Go Lower! Short!
Please, check our technical outlook for GBPCAD.
Time Frame: 1D
Current Trend: Bearish
Sentiment: Overbought (based on 7-period RSI)
Forecast: Bearish
The market is trading around a solid horizontal structure 1.867.
The above observations make me that the market will inevitably achieve 1.853 level.
P.S
We determine oversold/overbought condition with RSI indicator.
When it drops below 30 - the market is considered to be oversold.
When it bounces above 70 - the market is considered to be overbought.
Disclosure: I am part of Trade Nation's Influencer program and receive a monthly fee for using their TradingView charts in my analysis.
Like and subscribe and comment my ideas if you enjoy them!

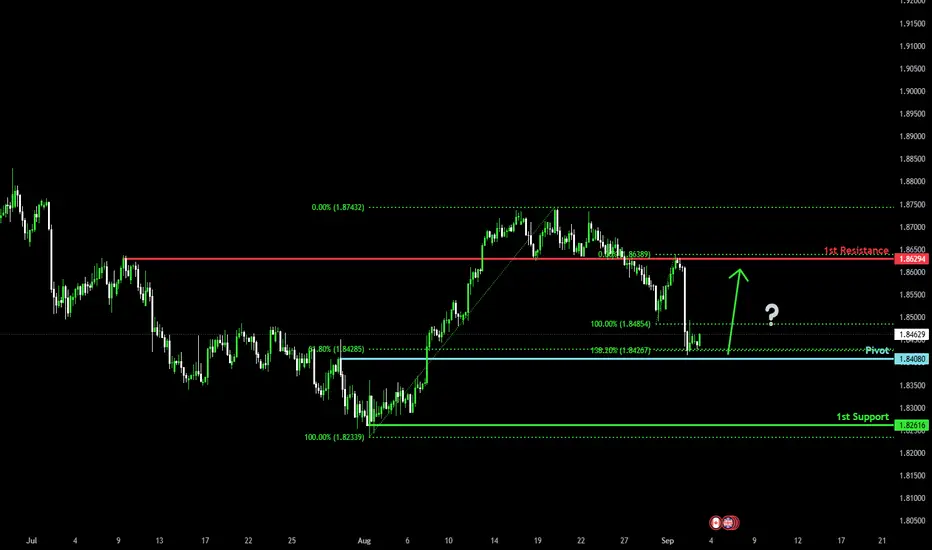
Could we see a reversal from here?GBP/CAD is falling towards the pivot and could bounce to the overlap resistance.
Pivot: 1.8408
1st Support: 1.8261
1st Resistance: 1.8629
Risk Warning:
Trading Forex and CFDs carries a high level of risk to your capital and you should only trade with money you can afford to lose. Trading Forex and CFDs may not be suitable for all investors, so please ensure that you fully understand the risks involved and seek independent advice if necessary.
Disclaimer:
The above opinions given constitute general market commentary, and do not constitute the opinion or advice of IC Markets or any form of personal or investment advice.
Any opinions, news, research, analyses, prices, other information, or links to third-party sites contained on this website are provided on an "as-is" basis, are intended only to be informative, is not an advice nor a recommendation, nor research, or a record of our trading prices, or an offer of, or solicitation for a transaction in any financial instrument and thus should not be treated as such. The information provided does not involve any specific investment objectives, financial situation and needs of any specific person who may receive it. Please be aware, that past performance is not a reliable indicator of future performance and/or results. Past Performance or Forward-looking scenarios based upon the reasonable beliefs of the third-party provider are not a guarantee of future performance. Actual results may differ materially from those anticipated in forward-looking or past performance statements. IC Markets makes no representation or warranty and assumes no liability as to the accuracy or completeness of the information provided, nor any loss arising from any investment based on a recommendation, forecast or any information supplied by any third-party.
GBPCAD (1D) - Swing Trading SetupThis trading plan aims to capture a medium-term upward move on the GBP/CAD pair, leveraging the Smart Money Concept to find optimal entry points for a long position.
Market Context and Bias:
The market has recently experienced a pullback, establishing a clear structure of higher lows and higher highs, confirming a bullish trend. Your bias is long, expecting the price to rebound from a significant demand area to resume its upward momentum.
Key Zones (Critical Areas):
High-Quality (HQ) Order Block (Demand Zone): This is a well-defined demand area where institutional buying is expected. The price is currently near this zone, which serves as a potential entry zone for a pending long position.
Liquidity Pools (LQ Order Block): Below the HQ Order Block, there's also a minor liquidity area that could act as support for any deeper pullbacks.
Imbalance (IRL): Price gaps or imbalances suggest areas where price might fill before continuing its trend, supporting a pullback entry.
Market Structure & Confirmation:
Break of Structure (BOS): The chart shows previous breaks of structure confirming the continuation of the bullish trend.
Price Reaction at Demand Zone: Expect a reaction or bullish candlestick pattern (like a pin bar or engulfing candle) at the HQ Order Block for confirmation of entry.
Liquidity Grab: Watch for a possible liquidity sweep below the demand block to trigger stops before a bullish move.

GBPCAD 3H TECHNICAL ANALYSIS📉 Downtrend — Sequential lower highs from mid-Aug with a capitulation wick into demand near 1.8420.
🔴 RESISTANCE ZONE
🔴 1.85850 — Take-profit shelf / prior support turned resistance
🔴 1.86600 — Supply pivot (lower-high risk)
🔴 1.87300 — Structural cap (trend pivot)
🎯 ENTRIES & TARGETS
📗 BUY LIMIT: 1.84200
📗 BUY STOP (confirmation): 1.84400
🎯 TP ladder: 1.85200 → 1.85500 → 1.85850
🛑 STOP LOSS / Invalidation: 1.83700
🟢 SUPPORT ZONE
🟢 1.8415–1.8425 — Demand block (reaction shelf)
🟢 1.83700 — Hard invalidation; below opens 1.8320 / 1.8280
✍️ STRUCTURAL NOTES
Sharp liquidation drop into a well-defined 3H demand; buyers defending 1.842x.
Reclaim above 1.8440 signals rotation toward 1.8520–1.8585.
Failure below 1.8370 negates bounce idea and resumes trend lower.
📊 TRADE OUTLOOK
Bias = Counter-trend bounce toward 1.8585 while < 1.8660 keeps medium-term trend bearish.
Expect chop on first test of 1.8520–1.8550; partials recommended.
🧪 STRATEGY RECOMMENDATIONS
Conservative (Confirmation Long)
— Entry: 1.84400 (on reclaim)
— TP: 1.85200 → 1.85500 → 1.85850
— SL: 1.83700
— Est. R:R to 1.8585 ≈ ~2.1:1
Aggressive Reversal (Touch of Demand)
— Entry: 1.84200
— TP: 1.85000 → 1.85500 → 1.85850
— SL: 1.83700
— Est. R:R to 1.8585 ≈ ~3.3:1
Watchlist: Reaction at 1.8520–1.8550 (scale), rejection near 1.8585 / 1.8660 (fade risk).
“Discipline | Consistency | PAY-tience™”
