GBP/JPY Best Places To Buy And Sell Cleared , 400 Pips Waiting !Here is m y opinion on GBOP/JPY On 4H T.F , We have a Huge movement To Upside & Then to downside since Last 2 weeks , and we have a good range for buy and sell started between 211.900 to 210.000 so we can buy and sell GBP/JPY This Week from 2 areas , 210.000 will be the best place for Buy and 211.900 will be the best place for Sell , now the price very near buy area so we can Enter a buy trade now and targeting 211.900 and when the price touch it and give us a good bearish P.A , we can enter a sell trade and targeting 210.000, It`s All Depend On Price action , if we have a daily closure below our support then this idea will not be valid anymore .
Entry Reasons :
1- Lowest Level The Price Touch It
2- Broken Res .
3- New Support Touched .
4- Clear Price Action .
5- Clear Support & Res .
6- Price Range Cleared .
GBPJPY

EUR/JPY | Between NWOGs! (READ THE CAPTION) As it can be seen in the 2H chart of EURJPY, it opened the week with a massive NWOG, and it has been testing and retesting the NWOG since the beginning of the week. It also has been stuck in the last week's NWOG, going through it then coming back to it like magnet several times. Currently it is being traded at 183.400, just barely above last week's NWOG high.
I expect EURJPY to retest this weeks NWOG relatively soon.
Targets for EURJPY: 183.440, 183,600, 183.760 and 183.920.

GBPJPY buyers looking for a 1D MA100 test.The GBPJPY pair has been trading within a Channel Up since the April 09 2025 Low and this week is seen pulling back from its top (Higher Highs trend-line) to the 1D MA50 (blue trend-line), which is the first Support of this pattern.
With the previous Bearish Leg pulling back by -3.04% and touching the 1D MA100 (green trend-line) before bottoming, we seek for the price to repeat that in order to turn into a long-term buy opportunity again. Even the 1D RSI has some breathing room before it bottoms.
Once that condition is met, we expect the new Bullish Leg to target 220.000 at least (Fib extension 1.786).
---
** Please LIKE 👍, FOLLOW ✅, SHARE 🙌 and COMMENT ✍ if you enjoy this idea! Also share your ideas and charts in the comments section below! This is best way to keep it relevant, support us, keep the content here free and allow the idea to reach as many people as possible. **
---
💸💸💸💸💸💸
👇 👇 👇 👇 👇 👇

GBP-JPY Free Signal! Sell!
Hello,Traders!
GBPJPY is reacting into a well-defined supply zone after a sharp impulsive move. SMC shows bearish mitigation with sell-side liquidity still below, favoring continuation lower.
--------------------
Stop Loss: 212.17
Take Profit: 211.26
Entry: 211.79
Time Frame: 3H
--------------------
Sell!
Comment and subscribe to help us grow!
Check out other forecasts below too!
Disclosure: I am part of Trade Nation's Influencer program and receive a monthly fee for using their TradingView charts in my analysis.

GBPJPY Is Bearish! Short!
Please, check our technical outlook for GBPJPY.
Time Frame: 1h
Current Trend: Bearish
Sentiment: Overbought (based on 7-period RSI)
Forecast: Bearish
The market is testing a major horizontal structure 211.866.
Taking into consideration the structure & trend analysis, I believe that the market will reach 211.242 level soon.
P.S
We determine oversold/overbought condition with RSI indicator.
When it drops below 30 - the market is considered to be oversold.
When it bounces above 70 - the market is considered to be overbought.
Like and subscribe and comment my ideas if you enjoy them!

GBPJPY corrective pullback supported at 209.60The GBPJPY remains in a bullish trend, with recent price action showing signs of a corrective pullback within the broader uptrend.
Support Zone: 209.60– a key level from previous consolidation. Price is currently testing or approaching this level.
A bullish rebound from 209.60 would confirm ongoing upside momentum, with potential targets at:
212.65 – initial resistance
213.50 – psychological and structural level
214.10 – extended resistance on the longer-term chart
Bearish Scenario:
A confirmed break and daily close below 209.60 would weaken the bullish outlook and suggest deeper downside risk toward:
209.00 – minor support
208.50 – stronger support and potential demand zone
Outlook:
Bullish bias remains intact while the GBPJPY holds above 209.60. A sustained break below this level could shift momentum to the downside in the short term.
This communication is for informational purposes only and should not be viewed as any form of recommendation as to a particular course of action or as investment advice. It is not intended as an offer or solicitation for the purchase or sale of any financial instrument or as an official confirmation of any transaction. Opinions, estimates and assumptions expressed herein are made as of the date of this communication and are subject to change without notice. This communication has been prepared based upon information, including market prices, data and other information, believed to be reliable; however, Trade Nation does not warrant its completeness or accuracy. All market prices and market data contained in or attached to this communication are indicative and subject to change without notice.

GBPJPY | Long Idea
GBPJPY showed a big reaction on on the DAILY support zone around 210.4
Looking for this pair to continue up from here.
Best case we see a nice reaction from the small zone around 211.4 with a nice move up.
Yesterday we had a nice move up, and I would like to see that today as well.
Let me know what you think!
Do your own due diligence, this is not investment advise!

GBPUSD: breakout setup toward 1.3940🛠 Technical Analysis: On the H1 chart, GBPUSD remains in a strong bullish structure after the “global bullish signal,” with price continuing to print higher highs and higher lows. The pair is now consolidating just below the key resistance band around 1.3843–1.3850, suggesting a potential squeeze before the next directional move. An ascending support trendline is holding the pullbacks, keeping the short-term momentum constructive. Price is trading above the SMA 50, while SMA 100 and SMA 200 stay well below, confirming trend strength. A clean breakout and hold above the resistance zone would likely trigger continuation toward the next upside objective near 1.3939. If the breakout fails, a retest of the trendline and the nearest support zone around 1.3680 becomes the first level to watch for buyers to defend.
———————————————
❗️ Trade Parameters (BUY)
———————————————
➡️ Entry Point: Buy on a confirmed breakout and hold above 1.38431–1.38500
🎯 Take Profit: 1.39391
🔴 Stop Loss: 1.37788
⚠️ Disclaimer: This is a potential trade idea based on current analysis; market conditions and price direction are subject to change based on news factors and volatility.

TheGrove | GBPJPY buy | Idea Trading AnalysisGBP/JPY is trading within a rising channel, with price holding above the Ascending Triangle after a clear bullish and is moving on Resistance area.
We expect a decline in the channel after testing the current level.
Hello Traders, here is the full analysis.
I think we can soon see more fall from this range! GOOD LUCK! Great SELL opportunity GBPJPY
I still did my best and this is the most likely count for me at the moment.
-------------------
Traders, if you liked this idea or if you have your own opinion about it, write in the comments. I will be glad ⚜️

GBP/JPY | What's ahead? (READ THE CAPTION)As you can see in the 2h chart of GBPJPY, 2 weeks ago it went up high all the way to 214.85 and then a dramatic fall, filling last weeks NWOG completely, and it touched the low of this week's NWOG before dropping again. Currently it's being traded at 210.40 and I expect it to retest last week's NWOG relatively soon.

GBPJPY LONGS - NEXT LEG UPGBPJPY Has found support around the 210.344 expecting buyers to come into the market and push the pair back to previous highs at 214.367 area

USD/JPY | retesting! (READ THE CAPTION)As you can see in the 4h chart of USDJPY, it dropped further down to 152.090, hitting all 4 bearish targets from the last USDJPY analysis, to anyone who used it, cheers. 🍻
USDJPY is currently being traded at 153.48, bouncing back up after hitting the high of the Bullish OB.
USDJPY has tested the Bearish Breaker twice now and I expect it to retest it one more time.
The bullish targets are: 153.600, 153.750, 153.90, 154.05 and 154.200.
If it fails at retesting the bearish breaker the next targets would be as follows: 153.400, 153.250, 153.100 and 152.950

GBPUSD: consolidation at 1.37🛠 Technical Analysis: On the H1 chart, GBPUSD remains bullish after a strong impulse move and is now compressing beneath the marked resistance zone around 1.37000. Price is holding inside a rising structure, with the steep trend channel still intact and suggesting continuation if buyers defend the pullbacks. The moving averages are angled higher and sit below price, reinforcing the upward bias. A clean push above the resistance area opens the way toward the next upside target, while a drop back below the consolidation base would signal a deeper retracement into the nearest support zone.
———————————————
❗️ Trade Parameters (BUY)
———————————————
➡️ Entry Point: 1.36872
🎯 Take Profit: 1.37532
🔴 Stop Loss: 1.36438
⚠️ Disclaimer: This is a potential trade idea based on current analysis; market conditions and price direction are subject to change based on news factors and volatility.

GBPJPY Massive Long! BUY!
My dear friends,
My technical analysis for GBPJPY is below:
The market is trading on 210.57 pivot level.
Bias - Bullish
Technical Indicators: Both Super Trend & Pivot HL indicate a highly probable Bullish continuation.
Target - 211.67
About Used Indicators:
A pivot point is a technical analysis indicator, or calculations, used to determine the overall trend of the market over different time frames.
Disclosure: I am part of Trade Nation's Influencer program and receive a monthly fee for using their TradingView charts in my analysis.
———————————
WISH YOU ALL LUCK

#GBPJPY , Next one !📊 Morning Market Brief | London Session Prep
🔎 Instrument Focus: #GBPJPY
⚠️ Risk Environment: High
📈 Technical Overview:
Another Sell setup at yesterday POI ? lets see
🚀 Trading Plan:
• Need valid Momentum Structure
• LTF ENTRY NEEDED
• Just and Only for QuickScalp
🧠 Stay updated with real time news and macro events, visit 👉 @News_Ash_TheTrader_Bot
#Ash_TheTrader #Forex #EURUSD #MarketInsight #PriceAction #TradingPlan #RiskManagement #LondonSession #Scalping #Futures #NQ #Gold

GBPJPY Bullish Breakout Signals Wave (5) UpsideGBPJPY has confirmed a bullish breakout above a key long-term resistance, with Elliott Wave structure pointing to further upside toward the 215–220 zone.
GBPJPY is breaking out of its base channel after pushing above the 208 level, which also acted as a major resistance throughout 2024. Since the breakout, price action shows a strong recovery, suggesting an impulsive move originating from the 192 area.
The market is currently undergoing a corrective pullback in wave (4), testing the projected 210 support zone. As long as this support holds, a bullish continuation into wave (5) is favored, with upside targets in the 215–220 area.
The bullish outlook is invalidated below 205. As long as price remains above this level, the broader trend stays bullish.

Key resistance ahead?GBP/JPY is rising towards the pivot and could reverse to the 1st support, which has been identified as a pullback support.
Pivot: 211.96
1st Support: 208.94
1st Resistance: 214.29
The opinions given above constitute general market commentary and do not constitute the opinion or advice of IC Markets or any form of personal or investment advice.
Any opinions, news, research, analyses, prices, other information, or links to third-party sites contained on this website are provided on an "as-is" basis, are intended to be informative only, and are not advice, a recommendation, research, a record of our trading prices, an offer of, or solicitation for, a transaction in any financial instrument and thus should not be treated as such. The information provided does not involve any specific investment objectives, financial situation, or needs of any specific person who may receive it. Please be aware that past performance is not a reliable indicator of future performance and/or results. Past performance or forward-looking scenarios based upon the reasonable beliefs of the third-party provider are not a guarantee of future performance. Actual results may differ materially from those anticipated in forward-looking or past performance statements. IC Markets makes no representation or warranty and assumes no liability as to the accuracy or completeness of the information provided, nor any loss arising from any investment based on a recommendation, forecast, or any information supplied by any third party

GBPJPY : Growth & Bullish Forecast
Balance of buyers and sellers on the GBPJPY pair, that is best felt when all the timeframes are analyzed properly is shifting in favor of the buyers, therefore is it only natural that we go long on the pair.
Disclosure: I am part of Trade Nation's Influencer program and receive a monthly fee for using their TradingView charts in my analysis.
❤️ Please, support our work with like & comment! ❤️

GBPJPY: targets at 214 and 216🛠 Technical Analysis: On the H4 chart, GBPJPY remains in a clear ascending channel, keeping the broader bullish structure intact. Price is currently in a pullback toward the 211.8–210.9 support area, where buyers previously defended momentum. The SMA cluster (50/100) is nearby and can act as a pivot—holding above support favors a continuation push. A sustained rebound from this zone opens the path back toward the 214.25 resistance, with the channel top as a potential extension.
———————————————
❗️ Trade Parameters (BUY)
———————————————
➡️ Entry Point: 212.238
🎯 Take Profit: 214.249
🔴 Stop Loss: 210.874
⚠️ Disclaimer: This is a potential trade idea based on current analysis; market conditions and price direction are subject to change based on news factors and volatility.

JPY Index — Reversal Signal Confirmed. EurJpy&GbpJpy in focusA week ago, I argued that a strong reversal could be next for JPY pairs, based on one key observation:
✅ the JPY Index was trading at an all-time low, but price action was contained inside a falling wedge — a pattern that often signals trend exhaustion and a reversal just around the corner.
And as always, the market did what it does best…
👉 it made one more new low, just to shake everyone out, before reversing.
🔥 Friday: The First Real Confirmation
Friday delivered a very important technical signal: a strong bullish engulfing candle
and even more importantly…
✅ a close above the descending trendline of the falling wedge
That’s a key detail, because wedge breaks matter only when the market accepts above the structure, not when it simply spikes and fades.
📈 Today: Gap Up and Strong Continuation
Today, the market opened with a clear gap above horizontal resistance and is trading strongly to the upside.
This is exactly how a real reversal begins:
- break the structure
- reclaim the level
- continue with momentum
✅ Going Forward: I Expect JPY Strength to Continue
From this point, I expect the JPY recovery / strength to extend further.
Which means my focus shifts to the pairs that can “pay” the best if JPY strengthens:
👉 EURJPY
👉 GBPJPY
📌 Trading Plan
My plan is simple:
✅ Sell rallies in EURJPY and GBPJPY as long as JPY strength remains the dominant theme.
If this reversal continues to develop, these crosses have the potential to deliver powerful downside corrections. 🚀

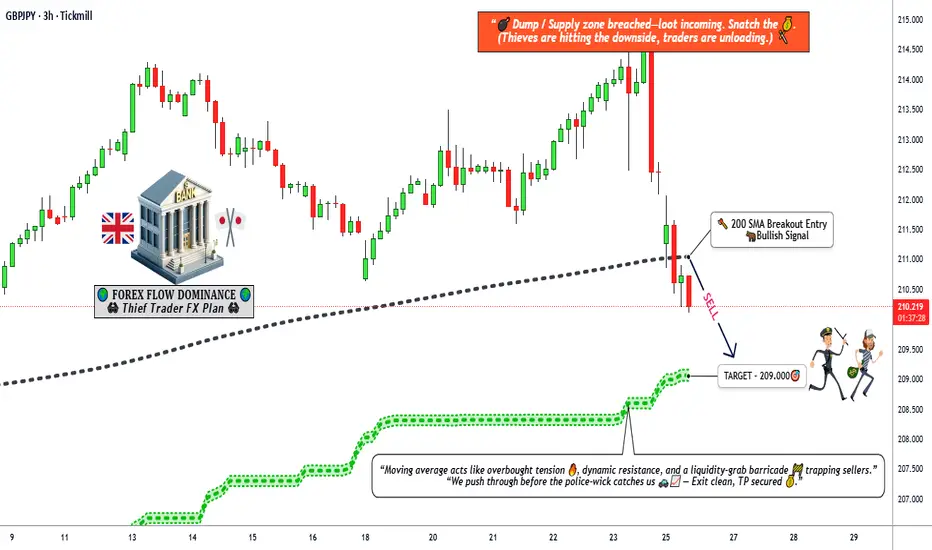
Has GBP/JPY Topped After Moving Average Rejection?🎯 GBP/JPY "THE GUPPY" BEARISH SWING/DAY TRADE SETUP | Multi-Layer Entry Strategy 🔥
📊 MARKET OVERVIEW
Asset: GBP/JPY (The Guppy) - Forex Major Cross
Trade Type: Swing/Day Trade
Direction: 🐻 BEARISH BIAS CONFIRMED
Strategy: Thief Layering Method (Multiple Limit Orders)
🎯 TRADE PLAN BREAKDOWN
📉 BEARISH SETUP CONFIRMED:
✅ Simple Moving Average (SMA) Breakout Detected
✅ Price Rejection at Key Resistance Zone
✅ Overbought Conditions on Multiple Timeframes
✅ Moving Average Acting as "Police Force" Resistance
🚨 ENTRY STRATEGY: THIEF LAYERING METHOD
⚠️ IMPORTANT: This strategy uses MULTIPLE SELL LIMIT ORDERS (Layering Technique)
🎯 Suggested Sell Limit Layers:
Layer 1: 211.500 🔴
Layer 2: 211.000 🔴
Layer 3: 210.500 🔴
💡 PRO TIP: You can add more layers or adjust based on your risk tolerance and account size. This "ladder entry" approach helps average your entry price and reduces timing risk.
Alternative: Market execution at current price levels is also viable if price shows immediate bearish momentum.
🎯 TAKE PROFIT TARGET
Primary TP: 209.000 💰
⚠️ THIEF OG's DISCLAIMER:
This is a suggested target zone. You are your own boss! Take profits when YOU feel comfortable. Scale out partially at psychological levels (210.00, 209.50) if you prefer to lock in gains progressively. Your money, your rules, your risk!
🛑 STOP LOSS
Thief SL: 212.000 ⛔
⚠️ RISK MANAGEMENT NOTICE:
This is a recommended invalidation level. Adjust based on your personal risk tolerance and position sizing. Never risk more than 1-2% of your account per trade. Ladies & Gentlemen, protect your capital first—profits come second!
📈 CORRELATED PAIRS TO WATCH
Direct Correlation Analysis:
GBP/USD (Cable) 🇬🇧💵
Watch for: GBP weakness will amplify bearish move on GBP/JPY
Key Level: Monitor 1.2400 support zone
EUR/JPY 🇪🇺🇯🇵
Correlation: High positive correlation (~0.85)
Use Case: Confirms JPY strength across the board
USD/JPY 🇺🇸🇯🇵
Watch for: JPY strength against USD = stronger confirmation
Key Level: Breaking below 155.00 = JPY bullish momentum
GBP/CHF 🇬🇧🇨🇭
Correlation: Measures pure GBP strength
Use Case: Weakness here confirms GBP leg of our bearish thesis
XAU/USD (Gold) 🥇💵
Risk-Off Indicator: Rising gold = JPY strength (safe haven flow)
Current Zone: Watch $2,750-2,800 resistance
🌍 FUNDAMENTAL & ECONOMIC FACTORS
🇬🇧 GBP FUNDAMENTALS (Bearish Pressure):
Bank of England (BoE): Dovish stance expected; potential rate pause/cut cycle ahead
UK GDP Growth: Slowing economic momentum concerns
Inflation Data: Cooling CPI reduces hawkish BoE expectations
Political Uncertainty: Fiscal policy concerns weighing on Sterling
🇯🇵 JPY FUNDAMENTALS (Bullish Support):
Bank of Japan (BoJ): Shifting away from ultra-loose policy; normalization talks
Yen Strength Drivers: Safe-haven demand amid global uncertainty
Wage Growth: Rising wages supporting domestic inflation = hawkish BoJ pivot potential
Intervention Risk: Japanese authorities monitoring excessive Yen weakness
📅 UPCOMING NEWS CATALYSTS TO WATCH
⚠️ HIGH-IMPACT EVENTS THIS WEEK:
🇬🇧 UK Economic Data:
Manufacturing & Services PMI
Retail Sales Data
BoE Speakers/Minutes
🇯🇵 Japan Economic Data:
Tokyo CPI (leading inflation indicator)
BoJ Policy Meeting Minutes
Trade Balance Data
🌐 Global Risk Sentiment:
US Federal Reserve Statements
Global Equity Market Performance (Risk-On/Risk-Off flows)
Geopolitical Tensions (affects safe-haven demand)
💡 TRADING NOTE: Avoid holding through major BoE or BoJ announcements if day trading. For swing traders, widen stops during high-volatility events.
🔥 TECHNICAL CONFLUENCE CHECKLIST
✅ SMA Breakout (Bearish)
✅ Resistance Rejection at 211.50+ zone
✅ Overbought RSI/Stochastic on H4/Daily
✅ Price Trapped Above Key Support-Turned-Resistance
✅ Momentum Divergence Signals
✅ Volume Confirmation on Reversal Candles
💎 THIEF TRADING PSYCHOLOGY REMINDERS
🧠 Stay Disciplined: Stick to your plan, not your emotions
💰 Manage Risk First: Profits are a byproduct of good risk management
📊 Follow Price Action: Let the market tell you when you're right or wrong
🎯 No FOMO: Missing a trade is better than forcing a bad one
🚀 Scale Your Winners: Let profitable positions breathe with trailing stops
🏆 FINAL VERDICT
The GBP/JPY "Guppy" is showing HIGH-PROBABILITY bearish setup with technical, fundamental, and correlation alignment. The Thief Layering strategy allows flexible entry management while the 209.000 target offers solid risk:reward potential.
Risk:Reward Ratio: Approximately 1:2.5 (based on layer average entry)
👍 If this analysis helps you, smash that LIKE button and FOLLOW for more Thief Strategy setups!
💬 Drop your thoughts below—are you team BEAR or waiting for confirmation?
#GBPJPY #ForexTrading #ThiefStrategy #TechnicalAnalysis #SwingTrading #DayTrading #ForexSignals #PriceAction #RiskManagement #TradingView #ForexCommunity #TheGuppy 🎯📊💰
GBPJPY Is Going Up! Long!
Take a look at our analysis for GBPJPY.
Time Frame: 4h
Current Trend: Bullish
Sentiment: Oversold (based on 7-period RSI)
Forecast: Bullish
The market is trading around a solid horizontal structure 210.351.
The above observations make me that the market will inevitably achieve 212.357 level.
P.S
The term oversold refers to a condition where an asset has traded lower in price and has the potential for a price bounce.
Overbought refers to market scenarios where the instrument is traded considerably higher than its fair value. Overvaluation is caused by market sentiments when there is positive news.
Like and subscribe and comment my ideas if you enjoy them!

#GBPJPY , Continue to hell ?📊 Morning Market Brief | London Session Prep
🔎 Instrument Focus: #GBPJPY
⚠️ Risk Environment: High
📈 Technical Overview:
I believe there is a chance we do see retracement from the point and goes up a bit then drop , but lets have this plan in our watchlist either.
🚀 Trading Plan:
• Wait for Momentum around key levels
• LTF ENTRY NEEDED
• Manage risk aggressively, and secure ASAP.
🧠 Stay updated with real time news and macro events, visit 👉 @News_Ash_TheTrader_Bot
#Ash_TheTrader #Forex #EURUSD #MarketInsight #PriceAction #TradingPlan #RiskManagement #LondonSession #Scalping #Futures #NQ #Gold
