Planning a long swing based on these confluencesHi Traders!
In my opinion, GJ continues to be bullish. I posted a mind on Oct. 31st about how I thought GJ was in a retracement phase, and it seems to be trying to reverse out of that retracement.
A few confluences that stand out to me are- an attempt to make a Invert. Head and Shoulder, and a bullish 4HR CHOCH. Now, I'm looking to take a long swing, but in order for me to do that I need my confluences to be lined up to make the best logical decision.
My desired entry targets would be at 202 or 201.500. 201.500 would bring price to a 4HR OB/consolidation area that price broke out of on Friday, Nov. 7th.
However, if price doesn't make it to my desired areas, I may wait for a break above 203.200 with a strong candle close (Higher TF). That could confirm the bullish 4HR CHOCH.
I like to give GJ room to move, so if 203.200 is the case, my SL would potentially be just below 202/last higher low. This is all depending on how GJ moves. TP swing target 207-207.500 with taking profits in between.
Leave a comment, and let me know your thoughts!
*DISCLAIMER: I am not a financial advisor. The ideas and trades I take on my page are for educational and entertainment purposes only. I'm just showing you guys how I trade. Remember, trading of any kind involves risk. Your investments are solely your responsibility and not mine.*
GBPJPY

The GBPJPY Trap | Smart Money’s Next Big Move📉 GBPJPY – Potential Completion of Wave (B), Major Correction Ahead
The long-term bullish cycle on GBPJPY appears to be approaching exhaustion, with technical structure and macro dynamics both signaling a potential Wave (2) corrective phase in motion.
🧩 Elliott Wave Structure
The impulsive advance from the 2020 lows likely represents Wave (1) of a broader cycle, topping near the 208.00 region. Current price action suggests a completed Wave (B) within a larger (A)-(B)-(C) corrective structure, implying downside continuation toward the Wave (2) completion zone between 168.00–158.00 .
📊 Market Structure & Smart Money Context
A Break of Structure (BOS) has emerged beneath 205.00, confirming distribution after prolonged accumulation. Price has also swept liquidity above the prior swing high, aligning with classic Smart Money Concepts — premium pricing before a potential markdown phase.
🔍 Fibonacci & Confluence Zones
The 0.618–0.786 retracement of the Wave (1) impulse coincides with the 168.00–158.00 area, a key Fibonacci confluence that aligns with prior weekly demand and unmitigated imbalance zones . This confluence supports a high-probability reaccumulation area once corrective pressure subsides.
💼 Fundamental Backdrop
From a macro perspective, GBP remains constrained by persistent inflation and stagnating growth, while JPY fundamentals are shifting as the BoJ hints at policy normalization. Any tightening in Japanese yields could amplify downside momentum in GBPJPY.
🎯 Projected Levels
Near-term support: 175.00
Key demand zone: 168.00–158.00
Long-term invalidation: Below 158.00
🕰 Outlook
Until the market confirms a higher-timeframe reversal pattern within the identified demand zone, further downside remains probable. Medium-term traders should monitor liquidity sweeps and BOS confirmations on lower timeframes for re-entry setups.
Stay sharp — Wave C could be fast and decisive! ⚡
What’s your take, traders? 🤔
Do you think Wave C is about to drop hard or will bulls surprise us again? 🐻📉🐂
📈Drop your analysis 👇 — let’s see who nails the next big move! 🚀
⚠️ Disclaimer:
This analysis is for educational purposes only and does not constitute financial advice. Always perform your own due diligence before executing any trades.
#GBPJPY #ElliottWave #SmartMoneyConcepts #MarketStructure #ForexAnalysis #TechnicalAnalysis #Fibonacci #FXTrading #MacroAnalysis #TradingView

GBPJPY Will Grow! Long!
Please, check our technical outlook for GBPJPY.
Time Frame: 1h
Current Trend: Bullish
Sentiment: Oversold (based on 7-period RSI)
Forecast: Bullish
The market is approaching a significant support area 203.989.
The underlined horizontal cluster clearly indicates a highly probable bullish movement with target 204.805 level.
P.S
Please, note that an oversold/overbought condition can last for a long time, and therefore being oversold/overbought doesn't mean a price rally will come soon, or at all.
Like and subscribe and comment my ideas if you enjoy them!

GBPJPY - BULLISH BIASSymbol - GBPJPY
GBPJPY has broken the structure of its recent local downtrend amid continued weakness in the Japanese yen. This shift opens the door for a potential continuation of the broader bullish trend.
The yen continues to lose value, while the British pound remains on an upward path. A breakout above local trend resistance is taking shape, strengthening the overall bullish market structure. The key support zone is 203.50 – 203.26 Holding steady above this zone would confirm sustained buyer momentum and could set the stage for further upside. If bulls manage to defend 203.50, the likelihood of an extended rally increases.
Resistance levels: 204.06, 205.32
Support levels: 203.52, 203.26
A strong battle between buyers and sellers is developing around the 203.50 level. Continued consolidation above 203.00 underscores the importance of this zone. The current bias favors the bulls - maintaining price action above 203.50 would support additional gains, while a break below this area could trigger a pullback toward support.

GBPJPY → Attempt to reverse the local trend to bullish FX:GBPJPY breaks the structure of the local downtrend amid the fall of the Japanese yen. The price may continue the global bullish trend...
The yen continues to fall, the pound is rising. A breakout of the trend resistance is forming. The global trend is bullish. Key support is 203.500 - 203.260. Consolidation above this zone will confirm the bullish structure and may support further growth. If the bulls keep the price above 203.500, it could trigger growth.
Resistance levels: 204.06, 205.32
Support levels: 203.52, 203.26
There is a battle between the bulls and bears for the 203.5 area. Consolidation is forming above 203.0, confirming the importance of the current zone. Now the focus is on the bulls; if they can keep the price above 203.5, the growth will continue. Otherwise, the price may test support...
Best regards, R. Linda!

USDJPY and GBPJPY Analysis todayHello traders, this is a complete multiple timeframe analysis of this pair. We see could find significant trading opportunities as per analysis upon price action confirmation we may take this trade. Smash the like button if you find value in this analysis and drop a comment if you have any questions or let me know which pair to cover in my next analysis.

GBP/JPY: An Unusual Ascent Amid Global RiskThe GBP/JPY pair currently sits near 204.00, retracing from a six-week high. This movement reflects a complex tug-of-war between the Pound Sterling (GBP) , which faces uncertainty from upcoming UK inflation data, and an uncharacteristically weak Japanese Yen (JPY) . We analyze the diverse forces driving this pair's recent unusual ascent, where the JPY fails to act as its traditional safe-haven counterweight.
Macroeconomics & Monetary Policy Divergence
The immediate market focus centers on divergent monetary policy expectations. The Bank of Japan (BoJ) faces pressure to align its policies with fiscal objectives, potentially limiting future rate hikes. This uncertainty, coupled with the new government's plan for large economic stimulus and lower taxes, dampens JPY demand. Conversely, the Bank of England (BoE) awaits crucial UK Consumer Price Index (CPI) data, which is expected to show headline inflation moderating to *b]3.6% annually. This data will significantly influence the BoE's rate hike outlook, injecting caution into GBP trading ahead of the 07:00 GMT release.
Geopolitics & Geostrategy: The Taiwan Factor
A key reason for the JPY's recent underperformance is a shift in geopolitical sentiment toward Japan. New Prime Minister Sanae Takaichi adopted a firmer pro-Taiwan stance than her predecessors, triggering unease in Beijing. This heightened political tension weighs heavily on sentiment surrounding Japan, effectively diluting the Yen's traditional safe-haven magnetism against global risk. This specific anxiety overshadows the Yen's long-term status as the principal global currency counterweight.
Fiscal Policy & Economic Outlook
Concerns about Japan's fiscal health are also eroding the JPY's strength. The government is preparing a large economic stimulus package to boost growth. This spending raises concerns among investors worried about Japan's already stretched finances . These fiscal anxieties add direct pressure to the currency, making the JPY less attractive despite the current risk-off environment observed in global equity markets. This fiscal trajectory contrasts with the Bank of Japan's potential monetary hesitancy.
Industry Trends & Corporate Vulnerabilities
Corporate Japan's deep integration with the US technology sector presents another vulnerability. Many major Japanese companies maintain significant earnings exposure to the health and performance of the US tech boom. Corporate vulnerabilities tied to the US technology cycle are eroding the JPY’s traditional safe-haven appeal. Consequently, negative headlines or wobbles on Wall Street disproportionately mute the Yen's response, preventing it from rallying when global equities come under pressure.
Management, Innovation, and Patent Analysis -
While not an immediate driver, Japan's long-term currency strength relies on its competitive edge in high-tech and science . The current vulnerability suggests that the market is discounting the perceived innovation premium of corporate Japan. Traders see a connection between the dependency on US tech and a potentially lagging pace in domestic, cutting-edge patent analysis and independent industry leadership. Weak corporate sentiment reflects doubts about resilience and adaptive business models under new management.
Conclusion for Strategic Hedging
The Yen's uncharacteristic weakness creates a unique setup. The currency is behaving out of character relative to the worsening risk backdrop. This anomaly presents tactical opportunities for hedgers with exposure to the Yen. However, this phase is likely temporary. Japan’s enormous net international investment position and its central role in funding global carry trades mean the Yen's safe-haven DNA remains intact. If global markets experience a sharper, sustained downturn, expect the traditional gravitational pull into the JPY to reassert itself.

Stop!Loss|Market View: GBPUSD🙌 Stop!Loss team welcomes you❗️
In this post, we're going to talk about the near-term outlook for the GBPUSD currency pair☝️
Potential trade setup:
🔔Entry level: 1.32300
💰TP: 1.30490
⛔️SL: 1.33190
"Market View" - a brief analysis of trading instruments, covering the most important aspects of the FOREX market.
👇 In the comments 👇 you can type the trading instrument you'd like to analyze, and we'll talk about it in our next posts.
💬 Description: The pound remains a selling priority, but potential manipulation remains near 1.31590. Therefore, a short-term upside move to 1.32000 - 1.32500 is likely, from where, under a more aggressive scenario, selling could be considered. Furthermore, a more medium-term downside target of 1.27000 - 1.28000 remains.
Thanks for your support 🚀
Profits for all ✅

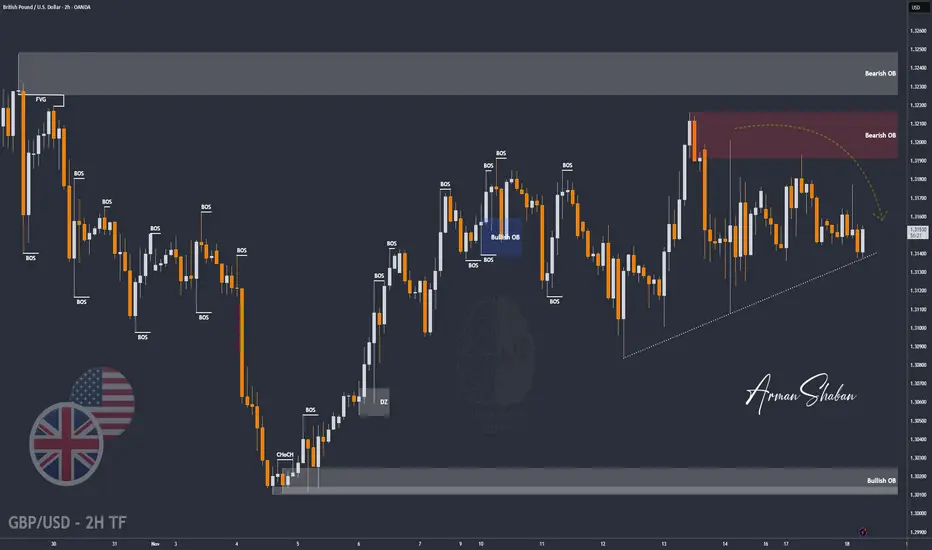
GBP/USD | Pound Setting Up for a Pullback Move! (READ CAPTION)By analyzing the GBPUSD chart on the 2H timeframe, we can see the price trading around 1.3150. I expect a small move to the upside first, followed by a stronger drop.
Key supply zones are 1.31770, 1.31910–1.32170, and 1.32250–1.32490.
This analysis will be updated soon.
Please support me with your likes and comments to motivate me to share more analysis with you and share your opinion about the possible trend of this chart with me !
Best Regards , Arman Shaban
GBPJPY – Targeting the Green WCL After BC RetracementPrice completed a clean green impulse and started a corrective red sequence.
The plan: wait for a retracement into the red BC zone, which overlaps a bearish order block. If price reacts from that region, I’ll ride the next leg down toward the red C target and the green wave’s Whole Correction Level (WCL).
However, note the developing bullish flag pattern — if price breaks above red B, that flag activates and the bearish setup becomes invalid. A breakout there could extend the larger bullish trend.
Strengths:
– BC retracement aligns with a strong order block.
– WCL and C-target overlap, creating a high-probability draw on liquidity.
– Clear invalidation above red B protects the setup.
Weaknesses:
– GBPJPY volatility could trigger premature sweeps.
– A confirmed flag breakout would fully invalidate this setup.
Narrative:
Trading the correction inside a possible flag — shorting structure, not emotion. If the flag fires, I’ll flip bias with it.

GBP/JPY “The Beast” Upside Roadmap — Layered Buy Strategy📌 Asset: GBP/JPY – “THE BEAST”
📈 Market Type: Swing Trade Opportunity
🎯 Plan: Bullish Bias (Upside Structure Intact)
🔹 Entry Plan (Layering Strategy – Thief Style)
This setup uses a multi-layered buy-limit method, allowing entries at different discounted levels while price retraces.
💠 Buy-Limit Layers:
202.000
203.000
204.000
(You may increase or reduce layers based on your own strategy & capital.)
📌 Flexible Entry:
You can enter at any price level by aligning with your risk plan and allowing the market to fill layered orders naturally.
🔺 Stop Loss (Risk Guidance)
SL @ 201.000
Dear Ladies & Gentlemen (Thief OG’s), this SL is only my template.
📝 Adjust SL based on your personal risk tolerance, account size, and market volatility.
🎯 Target Levels
Price faces a strong resistance zone ahead where liquidity hunts and overbought conditions may appear — often acting like a “police barricade.”
👉 Primary TP: 208.000
Dear Ladies & Gentlemen (Thief OG’s), take profit based on your own risk appetite.
This is a guidance level, not a mandatory exit.
📚 Market Notes & Behaviour
“The Beast” (GBP/JPY) tends to produce aggressive impulsive legs.
Layering helps manage volatility + gets better blended entries.
Swing structure remains bullish as long as price stays above the 201.000 zone.
🌐 Related Pairs to Watch (Correlation Insights)
1️⃣ GBP/USD ( FX:GBPUSD )
Positive correlation with GBP strength.
If GBPUSD is rising, it often supports GBP/JPY bullish momentum.
Watch for GBP news impact.
2️⃣ USD/JPY ( FX:USDJPY )
Highly correlated due to the JPY component.
A strong USDJPY usually indicates JPY weakness, helping GBPJPY push higher.
Track BOJ sentiment + yield changes.
3️⃣ EUR/JPY ( OANDA:EURJPY )
Moves similarly with risk-on market conditions.
When EURJPY is bullish, cross-yen strength can support GBPJPY upside.
4️⃣ GBP/CHF ( OANDA:GBPCHF )
Helps confirm overall GBP strength.
If GBPCHF trends up, GBPJPY tends to maintain upside structure.
5️⃣ AUD/JPY ( OANDA:AUDJPY )
Risk sentiment pair.
When risk appetite increases, yen weakens, boosting GBPJPY.
🧩 Key Takeaways for Traders
Trend remains bullish; dips = opportunities.
Layer entries help reduce emotional entries and improve average positioning.
Watch correlated pairs for confirmation + risk sentiment cues.
Maintain your own SL/TP based on risk tolerance.
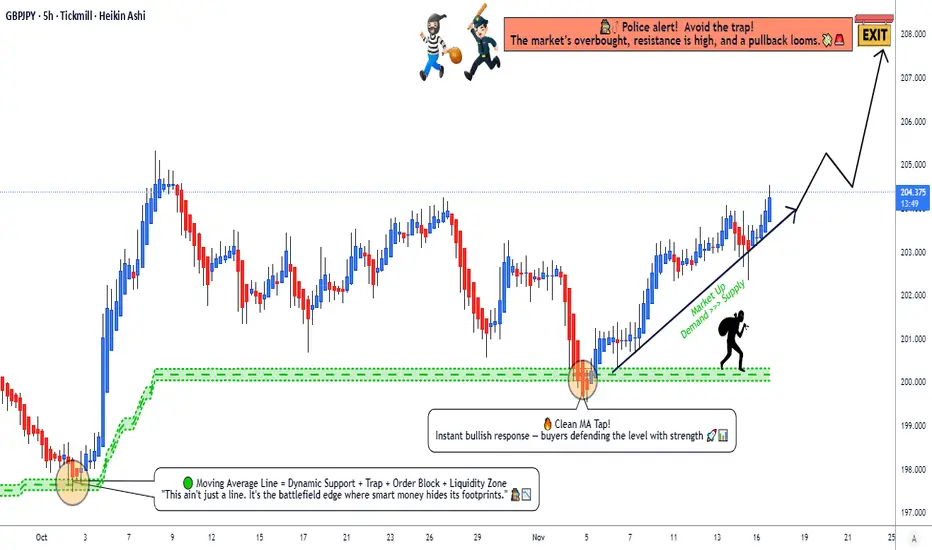
Is GBP/JPY Setting Up for Another Bullish Leg Higher?🐉 GBP/JPY “THE DRAGON” — Swing Trade Opportunity Guide! 💹🔥
💬 Overview:
The Dragon is waking up 🐲 — GBP/JPY showing strong bullish momentum confirmed by Kijun-sen moving average pullback support 🟢. Price action indicates potential upside continuation as long as Kijun holds.
🎯 Plan:
Thief going full layer mode 🕵️♂️💰 — stacking multiple buy limits (layering entries) around 201 / 202 / 203 levels. You can increase or reduce the number of layers based on your personal trade management style and risk tolerance.
🛑 Stop Loss:
This is Thief’s SL @ 200.00 ⚔️
Dear Ladies & Gentlemen (Thief OGs) — manage your stop loss according to your own risk strategy. This is not a fixed level recommendation. Protect your capital like a pro 💼.
🎯 Target:
Expecting a bullish climb toward 208.00 zone, where moving averages align as resistance + potential overbought zone + liquidity trap. 🎯 Take profits smartly, don’t get greedy — escape with profits like a true Thief OG! 😎💸
🧠 Note:
Dear Ladies & Gentlemen (Thief OGs), this setup is not financial advice — it’s a strategic view based on Thief’s layering style. Always plan your entries, SL, and TP according to your own risk tolerance and capital plan.
📊 Correlation & Related Pairs to Watch:
💷 GBP/USD — Often moves in sync with GBP/JPY during strong GBP sentiment.
💴 USD/JPY — Key driver of Yen weakness/strength. If USD/JPY stays bullish, GBP/JPY gets more fuel.
💶 EUR/JPY — Similar momentum flow. A bullish EUR/JPY often confirms risk-on tone for GBP/JPY.
💵 DXY (US Dollar Index) — Watch for inverse reaction. Strong DXY may slow GBP pairs temporarily.
🔑 Key Highlights:
✨ Kijun-sen confirms bullish structure
✨ Layered entry strategy = controlled risk + better average
✨ MA resistance near 208 — perfect take-profit exit
✨ Watch correlated Yen pairs for early confirmation signals
🚀 Thief’s Final Words:
Trade smart, layer deep, and take profits like a pro. The Dragon flies only for the disciplined 🐉💹.

USDJPY and GBPJPY Analysis todayHello traders, this is a complete multiple timeframe analysis of this pair. We see could find significant trading opportunities as per analysis upon price action confirmation we may take this trade. Smash the like button if you find value in this analysis and drop a comment if you have any questions or let me know which pair to cover in my next analysis.

GBPJPY:LIVE TRADEHello friends
With the breakdown of the ascending channel, you can see that the power has fallen to the sellers and now the price is expected to see lower targets.
Don't forget risk and capital management.
*Trade safely with us*

HighRisk QuickScalp #GBPJPY📌 Market Insight: {#GBPJPY }
⚠️ Risk Assessment: {High}
🚀 Approach:
Super Risky Setup .... at Edge of Structure
Just for QuickScalp
No Rush
Need valid momentum Structure and LTF entry Sign
#Ash_TheTrader #Forex #GBPJPY #MarketAnalysis #TradingSetup #RiskManagement #GOLD #Scalper #NQ #EURUSD

GBPJPY Trading Opportunity! SELL!
My dear followers,
This is my opinion on the GBPJPY next move:
The asset is approaching an important pivot point 203.70
Bias - Bearish
Safe Stop Loss - 203.93
Technical Indicators: Supper Trend generates a clear short signal while Pivot Point HL is currently determining the overall Bearish trend of the market.
Goal - 203.35
About Used Indicators:
For more efficient signals, super-trend is used in combination with other indicators like Pivot Points.
Disclosure: I am part of Trade Nation's Influencer program and receive a monthly fee for using their TradingView charts in my analysis.
———————————
WISH YOU ALL LUCK

GBPJPY | Institutional Sell Setup – D1 & W1 Sweeps AlignGBPJPY has completed a multi-timeframe liquidity sweep, with both W1 and D1 sweeps aligning inside a premium price zone.
The structure has shifted bearish following a clear CHOCH and a rejection from the FVG imbalance area, confirming potential downside continuation.
🔹 Execution Bias: Instant Sell
🔹 Entry Zone: 202.60–202.80
🔹 Stop-Loss: Above 203.40 (protected high)
🔹 Target: 199.00 (liquidity zone)
🔹 Bias: Bearish
Technical Breakdown:
• Weekly sweep confirms distribution.
• Daily sweep adds confluence of liquidity grab.
• CHOCH at discount confirms bearish intent.
• FVG + refined OB = smart-money entry zone.
• Targeting inefficiency and old liquidity lows.

GBPJPY Short From Resistance!
HI,Traders !
#GBPJPY made a retest
Of the key horizontal
Resistance level of 204.004
From where we are already
Seeing a bearish pullback so
As we are locally bearish
Biased and we will be
Expecting a further
Bearish move down !
Comment and subscribe to help us grow !

GBPJPY possible breakout?GBPJPY has formed a weekly bullish candlestick pattern that has created potential bullish trend continuation pattern as previous weekly close is a strong rejection from the weekly support level.
looking at 1h timeframe it has just fromed an inverted head and shoulder which is a potential entry zone as the market is in the direction of the marjor trend.

GBPJPY M30 | Bearish Reversal Off Key ResistanceMomentum: Bearish
Price is currently moving toward the sell entry level, which aligns with the 50% Fibonacci retracement, a key technical factor reinforcing the bearish setup.
Sell Entry: 203.47
Strong overlap resistance
50% Fibonacci retracement alignment
Stop Loss: 203.99
Positioned above the swing-high resistance
Take Profit: 202.89
Strong pullback support zone
High Risk Investment Warning
Stratos Markets Limited (tradu.com ), Stratos Europe Ltd (tradu.com ):
CFDs are complex instruments and come with a high risk of losing money rapidly due to leverage. 70% of retail investor accounts lose money when trading CFDs with this provider. You should consider whether you understand how CFDs work and whether you can afford to take the high risk of losing your money.
Stratos Global LLC (tradu.com ): Losses can exceed deposits.
Please be advised that the information presented on TradingView is provided to Tradu (‘Company’, ‘we’) by a third-party provider (‘TFA Global Pte Ltd’). Please be reminded that you are solely responsible for the trading decisions on your account. Any information and/or content is intended entirely for research, educational and informational purposes only and does not constitute investment or consultation advice or investment strategy. The information is not tailored to the investment needs of any specific person and therefore does not involve a consideration of any of the investment objectives, financial situation or needs of any viewer that may receive it. Past performance is not a reliable indicator of future results. Actual results may differ materially from those anticipated in forward-looking or past performance statements. We assume no liability as to the accuracy or completeness of any of the information and/or content provided herein and the Company cannot be held responsible for any omission, mistake nor for any loss or damage including without limitation to any loss of profit which may arise from reliance on any information supplied by TFA Global Pte Ltd.

GBPJPY Massive Bullish Breakout!
HI,Traders !
#GBPJPY is trading in a strong
Uptrend and the price just
Made a massive bullish
Breakout of the falling
Resistance line and the
Breakout is confirmed
So after a potential pullback
We will be expecting a
Further bullish continuation !
Comment and subscribe to help us grow !

GBPJPY Will Grow! Buy!
Please, check our technical outlook for GBPJPY.
Time Frame: 15h
Current Trend: Bullish
Sentiment: Oversold (based on 7-period RSI)
Forecast: Bullish
The market is trading around a solid horizontal structure 203.579.
The above observations make me that the market will inevitably achieve 206.263 level.
P.S
The term oversold refers to a condition where an asset has traded lower in price and has the potential for a price bounce.
Overbought refers to market scenarios where the instrument is traded considerably higher than its fair value. Overvaluation is caused by market sentiments when there is positive news.
Like and subscribe and comment my ideas if you enjoy them!

GBP/JPY BEARS WILL DOMINATE THE MARKET|SHORT
Hello, Friends!
GBP/JPY is making a bullish rebound on the 12H TF and is nearing the resistance line above while we are generally bearish biased on the pair due to our previous 1W candle analysis, thus making a trend-following short a good option for us with the target being the 201.580 level.
Disclosure: I am part of Trade Nation's Influencer program and receive a monthly fee for using their TradingView charts in my analysis.
✅LIKE AND COMMENT MY IDEAS✅
