GBPJPY Trading Opportunity! SELL!
My dear followers,
This is my opinion on the GBPJPY next move:
The asset is approaching an important pivot point 203.70
Bias - Bearish
Safe Stop Loss - 203.93
Technical Indicators: Supper Trend generates a clear short signal while Pivot Point HL is currently determining the overall Bearish trend of the market.
Goal - 203.35
About Used Indicators:
For more efficient signals, super-trend is used in combination with other indicators like Pivot Points.
Disclosure: I am part of Trade Nation's Influencer program and receive a monthly fee for using their TradingView charts in my analysis.
———————————
WISH YOU ALL LUCK
GBPJPY

GBPJPY | Institutional Sell Setup – D1 & W1 Sweeps AlignGBPJPY has completed a multi-timeframe liquidity sweep, with both W1 and D1 sweeps aligning inside a premium price zone.
The structure has shifted bearish following a clear CHOCH and a rejection from the FVG imbalance area, confirming potential downside continuation.
🔹 Execution Bias: Instant Sell
🔹 Entry Zone: 202.60–202.80
🔹 Stop-Loss: Above 203.40 (protected high)
🔹 Target: 199.00 (liquidity zone)
🔹 Bias: Bearish
Technical Breakdown:
• Weekly sweep confirms distribution.
• Daily sweep adds confluence of liquidity grab.
• CHOCH at discount confirms bearish intent.
• FVG + refined OB = smart-money entry zone.
• Targeting inefficiency and old liquidity lows.

GBPJPY Short From Resistance!
HI,Traders !
#GBPJPY made a retest
Of the key horizontal
Resistance level of 204.004
From where we are already
Seeing a bearish pullback so
As we are locally bearish
Biased and we will be
Expecting a further
Bearish move down !
Comment and subscribe to help us grow !

GBPJPY possible breakout?GBPJPY has formed a weekly bullish candlestick pattern that has created potential bullish trend continuation pattern as previous weekly close is a strong rejection from the weekly support level.
looking at 1h timeframe it has just fromed an inverted head and shoulder which is a potential entry zone as the market is in the direction of the marjor trend.

GBPJPY M30 | Bearish Reversal Off Key ResistanceMomentum: Bearish
Price is currently moving toward the sell entry level, which aligns with the 50% Fibonacci retracement, a key technical factor reinforcing the bearish setup.
Sell Entry: 203.47
Strong overlap resistance
50% Fibonacci retracement alignment
Stop Loss: 203.99
Positioned above the swing-high resistance
Take Profit: 202.89
Strong pullback support zone
High Risk Investment Warning
Stratos Markets Limited (tradu.com ), Stratos Europe Ltd (tradu.com ):
CFDs are complex instruments and come with a high risk of losing money rapidly due to leverage. 70% of retail investor accounts lose money when trading CFDs with this provider. You should consider whether you understand how CFDs work and whether you can afford to take the high risk of losing your money.
Stratos Global LLC (tradu.com ): Losses can exceed deposits.
Please be advised that the information presented on TradingView is provided to Tradu (‘Company’, ‘we’) by a third-party provider (‘TFA Global Pte Ltd’). Please be reminded that you are solely responsible for the trading decisions on your account. Any information and/or content is intended entirely for research, educational and informational purposes only and does not constitute investment or consultation advice or investment strategy. The information is not tailored to the investment needs of any specific person and therefore does not involve a consideration of any of the investment objectives, financial situation or needs of any viewer that may receive it. Past performance is not a reliable indicator of future results. Actual results may differ materially from those anticipated in forward-looking or past performance statements. We assume no liability as to the accuracy or completeness of any of the information and/or content provided herein and the Company cannot be held responsible for any omission, mistake nor for any loss or damage including without limitation to any loss of profit which may arise from reliance on any information supplied by TFA Global Pte Ltd.

GBPJPY Massive Bullish Breakout!
HI,Traders !
#GBPJPY is trading in a strong
Uptrend and the price just
Made a massive bullish
Breakout of the falling
Resistance line and the
Breakout is confirmed
So after a potential pullback
We will be expecting a
Further bullish continuation !
Comment and subscribe to help us grow !

GBPJPY Will Grow! Buy!
Please, check our technical outlook for GBPJPY.
Time Frame: 15h
Current Trend: Bullish
Sentiment: Oversold (based on 7-period RSI)
Forecast: Bullish
The market is trading around a solid horizontal structure 203.579.
The above observations make me that the market will inevitably achieve 206.263 level.
P.S
The term oversold refers to a condition where an asset has traded lower in price and has the potential for a price bounce.
Overbought refers to market scenarios where the instrument is traded considerably higher than its fair value. Overvaluation is caused by market sentiments when there is positive news.
Like and subscribe and comment my ideas if you enjoy them!

GBP/JPY BEARS WILL DOMINATE THE MARKET|SHORT
Hello, Friends!
GBP/JPY is making a bullish rebound on the 12H TF and is nearing the resistance line above while we are generally bearish biased on the pair due to our previous 1W candle analysis, thus making a trend-following short a good option for us with the target being the 201.580 level.
Disclosure: I am part of Trade Nation's Influencer program and receive a monthly fee for using their TradingView charts in my analysis.
✅LIKE AND COMMENT MY IDEAS✅

GBPJPY: Long Trade with Entry/SL/TP
GBPJPY
- Classic bullish formation
- Our team expects pullback
SUGGESTED TRADE:
Swing Trade
Long GBPJPY
Entry - 202.77
Sl - 202.54
Tp - 203.28
Our Risk - 1%
Start protection of your profits from lower levels
Disclosure: I am part of Trade Nation's Influencer program and receive a monthly fee for using their TradingView charts in my analysis.
❤️ Please, support our work with like & comment! ❤️

GBP/JPY Retesting Support Bullish Rebound PossibleOn the GBP/JPY 1-minute chart, the price is pulling back toward the support zone around 203.15. If this level holds and buyers step in, a strong bullish rebound could follow, pushing the pair back toward the recent highs. However, a break below this support may signal further downside. Watching for clear reaction and confirmation before entering any trades.

Bullish momentum to extend?GBP/JPY is falling towards the pivot and could bounce to the 1st resitance which acts as a swing high resistance.
Pivot: 202.63
1st Support: 201.83
1st Resistance: 204.84
Disclaimer:
The opinions given above constitute general market commentary and do not constitute the opinion or advice of IC Markets or any form of personal or investment advice.
Any opinions, news, research, analyses, prices, other information, or links to third-party sites contained on this website are provided on an "as-is" basis, are intended to be informative only, and are not advice, a recommendation, research, a record of our trading prices, an offer of, or solicitation for, a transaction in any financial instrument and thus should not be treated as such. The information provided does not involve any specific investment objectives, financial situation, or needs of any specific person who may receive it. Please be aware that past performance is not a reliable indicator of future performance and/or results. Past performance or forward-looking scenarios based upon the reasonable beliefs of the third-party provider are not a guarantee of future performance. Actual results may differ materially from those anticipated in forward-looking or past performance statements. IC Markets makes no representation or warranty and assumes no liability as to the accuracy or completeness of the information provided, nor any loss arising from any investment based on a recommendation, forecast, or any information supplied by any third party.

Bearish drop off?GBP/JPY is reacting off the resistance level, which is a pullback resistance zone, and could drop from this level toward our take-profit target.
Entry: 204.05
Why we like it:
Price is rejecting a pullback resistance level.
Stop Loss: 205.31
Why we like it:
It is positioned above a swing-high resistance level.
Take Profit: 201.94
Why we like it:
There is a pullback support level that aligns with the 38.2% Fibonacci retracement.
Enjoying your TradingView experience? Review us!
Please be advised that the information presented on TradingView is provided to Vantage (‘Vantage Global Limited’, ‘we’) by a third-party provider (‘Everest Fortune Group’). Please be reminded that you are solely responsible for the trading decisions on your account. There is a very high degree of risk involved in trading. Any information and/or content is intended entirely for research, educational and informational purposes only and does not constitute investment or consultation advice or investment strategy. The information is not tailored to the investment needs of any specific person and therefore does not involve a consideration of any of the investment objectives, financial situation or needs of any viewer that may receive it. Kindly also note that past performance is not a reliable indicator of future results. Actual results may differ materially from those anticipated in forward-looking or past performance statements. We assume no liability as to the accuracy or completeness of any of the information and/or content provided herein and the Company cannot be held responsible for any omission, mistake nor for any loss or damage including without limitation to any loss of profit which may arise from reliance on any information supplied by Everest Fortune Group.

GBPJPY FREE SIGNAL|SHORT|
✅GBPJPY traded into a clear supply level where premium pricing aligns with prior liquidity grabs. Smart money could engineer a short-term distribution before delivery to lower inefficiency.
—————————
Entry: 204.000
Stop Loss: 204.420
Take Profit: 203.297
Time Frame: 4H
—————————
SHORT🔥
✅Like and subscribe to never miss a new idea!✅

USDJPY - H1 | UpdateSl hit. GBPJPY broke the diagonal resistance and successfully closed above 203.200 which could signal further bullish momentum heading all the way up to 204.5xx in the mid - short term.

GBPJPY | Bullish Structure Targeting 204.20 Liquidity ZoneGBPJPY is showing strong bullish intent after multiple rejections from the 202.40–202.80 demand zone. Price is now consolidating just below a key liquidity pocket, hinting at a potential breakout toward 204.20 – 205.00, where major buy-side liquidity resides.
Market Breakdown:
HTF Bias: Bullish
Entry Zone: 202.40 – 202.80
Target Zone: 204.20 – 205.00
Invalidation: Below 202.20
Concepts Used: Liquidity Grab | Break of Structure | Demand Zone | Trend Continuation
⚙️ Watch for a clean break and retest of 203.20 to confirm continuation.

Bullish momentum to extend?GBP/JPY has bounced off the pivot and could rise toward the first resistance level, which acts as a swing high resistance.
Pivot: 202.63
1st Support: 201.7
1st Resistance: 204.84
Disclaimer:
The opinions given above constitute general market commentary and do not constitute the opinion or advice of IC Markets or any form of personal or investment advice.
Any opinions, news, research, analyses, prices, other information, or links to third-party sites contained on this website are provided on an "as-is" basis, are intended to be informative only, and are not advice, a recommendation, research, a record of our trading prices, an offer of, or solicitation for, a transaction in any financial instrument and thus should not be treated as such. The information provided does not involve any specific investment objectives, financial situation, or needs of any specific person who may receive it. Please be aware that past performance is not a reliable indicator of future performance and/or results. Past performance or forward-looking scenarios based upon the reasonable beliefs of the third-party provider are not a guarantee of future performance. Actual results may differ materially from those anticipated in forward-looking or past performance statements. IC Markets makes no representation or warranty and assumes no liability as to the accuracy or completeness of the information provided, nor any loss arising from any investment based on a recommendation, forecast, or any information supplied by any third party.

another BuySide QuickScalp #GBPJPY 📌 Market Insight: {#GBPJPY }
⚠️ Risk Assessment: {High}
🚀 Approach:
Lets see , does it give us another QuickScalp or not ... its More Riskier than Yesterday
#Ash_TheTrader #Forex #GBPJPY #MarketAnalysis #TradingSetup #RiskManagement #GOLD #Scalper #NQ #EURUSD

Stop!Loss|Market View: GBPUSD🙌 Stop!Loss team welcomes you❗️
In this post, we're going to talk about the near-term outlook for the GBPUSD currency pair☝️
Potential trade setup:
🔔Entry level: 1.31338
💰TP: 1.27182
⛔️SL: 1.32284
"Market View" - a brief analysis of trading instruments, covering the most important aspects of the FOREX market.
👇 In the comments 👇 you can type the trading instrument you'd like to analyze, and we'll talk about it in our next posts.
💬 Description: The pound remains a sell priority, as is the case for all major currencies overall, amid the strengthening of the USD index (DXY), which is likely to continue. Current parameters for sell trade are viewed more as conservative entry and exit levels. An alternative sell scenario involves a move to 1.32000 and then a fall back below 1.31500. In this case, we would have formed a false breakout, which would be an even more reliable sell entry point.
Thanks for your support 🚀
Profits for all ✅
❗️ Updates on this idea can be found below 👇

GBPJPY: A Golden Buying Opportunity as the Bulls Return!The market is gradually shifting in favor of the bulls on GBPJPY , as both fundamental and technical factors align to strengthen the short-term bullish outlook.
From a news perspective, the Japanese yen continues to weaken as Japan maintains its ultra-loose monetary policy stance, while the British pound shows mild recovery amid improving global risk sentiment. This combination has helped GBPJPY maintain upward momentum, despite slightly weaker UK labor data.
The chart now shows buying pressure returning , with GBPJPY hovering around the 202–203 zone, trading above the Ichimoku cloud — a positive signal for the ongoing uptrend. The 202.000 level acts as short-term support, while the next target lies at 205.000, which aligns with a key resistance and previous supply area.
Any pullbacks toward the 202.000 region can be viewed as buy-the-dip opportunities in line with the dominant trend. As long as price holds above this support, a move toward 205.000 remains highly achievable in the coming sessions.

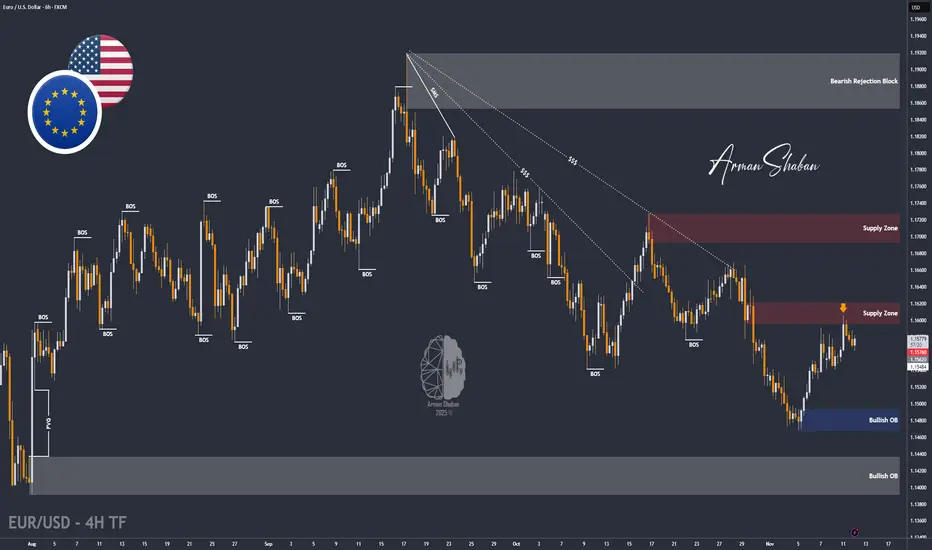
EUR/USD | EURO Under Pressure Below 1.16, Watch for Further DropBy analyzing the EUR/USD chart on the 6-hour timeframe, we can see that the price climbed to 1.16060 but faced resistance at that supply zone, leading to a pullback.
It’s now trading around 1.15740, and if the price fails to break back above 1.1600, we could see further downside, possibly toward levels below 1.1530.
Keep an eye on the key levels marked on the chart for potential reactions.
Please support me with your likes and comments to motivate me to share more analysis with you and share your opinion about the possible trend of this chart with me !
Best Regards , Arman Shaban
GBP-JPY Free Signal! Sell!
Hello,Traders!
GBPJPY is tapping into a key supply area where prior liquidity rests above equal highs. The market structure hints at exhaustion and a potential move lower toward discount levels as the supply level was clearly rejected!
---------------------
Stop Loss: 203.440
Take Profit: 202.300
Entry: 202.863
Time Frame: 4H
---------------------
Sell!
Comment and subscribe to help us grow!
Check out other forecasts below too!
Disclosure: I am part of Trade Nation's Influencer program and receive a monthly fee for using their TradingView charts in my analysis.

GBPJPY H4 | Bearish Reaction off Key ResistanceMomentum: Bearish
Price is in a descending channel.
Sell entry: 203.12
- Overlap resistance
Stop Loss: 204.46
- Swing high resistance
- 161.8% Fib extension
Take Profit: 201.26
- Pullback support
Stratos Markets Limited (tradu.com/uk ):
CFDs are complex instruments and come with a high risk of losing money rapidly due to leverage. 68% of retail investor accounts lose money when trading CFDs with this provider. You should consider whether you understand how CFDs work and whether you can afford to take the high risk of losing your money.
Stratos Europe Ltd (tradu.com/eu ):
CFDs are complex instruments and come with a high risk of losing money rapidly due to leverage. 70% of retail investor accounts lose money when trading CFDs with this provider. You should consider whether you understand how CFDs work and whether you can afford to take the high risk of losing your money.

GBPJPY - H1 [Outlook]Looking at GBPJPY we can see that it's currently trading on our diagonal resistance, failure to breakout of it and close above it will result in potential opportunities to the downside..
