GBPJPY Long Trigger That Nobody Talks AboutGBPJPY in the 15-min timeframe, after the previous two legs of the 4H uptrend, has now formed a range where breaking it upwards could reactivate the next MWC uptrend wave.
Setup and Entry: You can set a stop buy above 203.268, or you can wait for a breakout candle above 203.237.
Exit Plan: We're taking this position for the continuation of the HWC and restarting the MWC uptrend, so it's better to hold it longer—use partial profits to your advantage. The first resistance will be around 204.203, with daily resistance at 204.810. But definitely close 35% of the position at an R/R of 2, so that if you hit your stop loss, you at least break even.
Goal: Aligning with the drop in JPYX in the 4H timeframe and riding along with the MWC uptrend wave of GBPJPY.
GBPJPY

a BuySide QuickScalp #GBPJPY 📌 Market Insight: {#GBPJPY }
⚠️ Risk Assessment: {High}
🚀 Approach:
Not a bad Structure , we need momentum first then a nice LTF entry sign .
#Ash_TheTrader #Forex #GBPJPY #MarketAnalysis #TradingSetup #RiskManagement #GOLD #Scalper #NQ #EURUSD

GBPJPYGBPJPY
- Bearish Channel in Long Time Frame and Bullish Channel in Short Time Frame
- Order Block
- Break of Structure
- Completed " 1234 " Impulsive Waves
- Resistance Level

#GBPJPY:Three Positions Currently Opened, What about the next? Our three positions are currently open based on our last three ideas on GJ. We’re witnessing a strong bullish movement at the moment. Our next big target is 197, and then we aim for 200. Remember, trading involves risk, so take your own decisions.
Good luck and trade safely!
Thank you for your unwavering support! 😊
If you’d like to contribute, here are a few ways you can help us:
- Like our ideas
- Comment on our ideas
- Share our ideas
Team Setupsfx_
❤️🚀

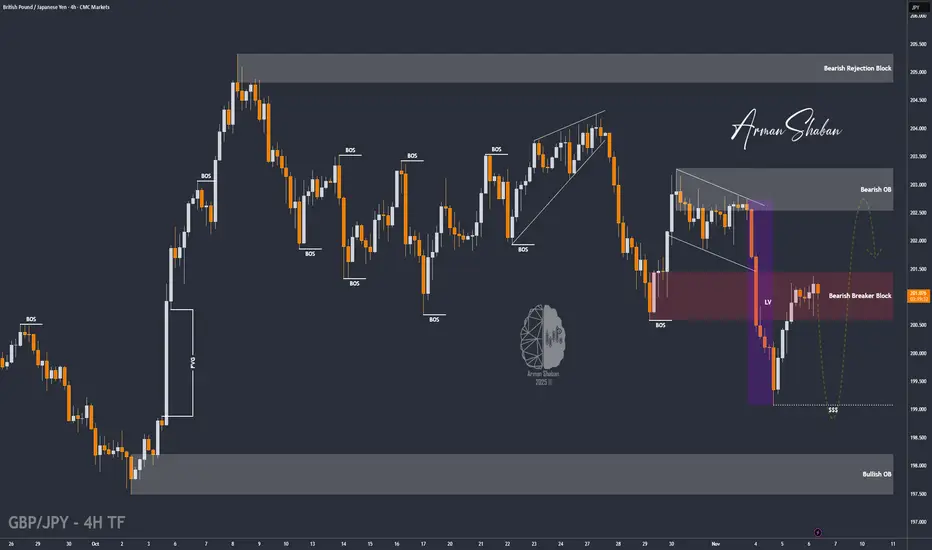
GBP/JPY | GBPJPY Rejects from Supply Zone, Bearish Setup in PlayBy analyzing the GBP/JPY chart on the 4-hour timeframe, we can see that after an initial correction down to 200.315, the price found strong demand and invalidated the initial bearish scenario, climbing back up to the second key supply zone.
Currently, the pair is trading around 202.95, and if it manages to stay below 203, we could see another price correction soon. This analysis will be updated soon.
Please support me with your likes and comments to motivate me to share more analysis with you and share your opinion about the possible trend of this chart with me !
Best Regards , Arman Shaban

GBP/JPY Rejection at Resistance – Potential Drop AheadOn the GBP/JPY 15-minute chart, the price has reacted strongly from the resistance zone around 202.95. If the market fails to break and hold above this level, we could see a bearish move toward the support zone around 201.02. A break below that level could open the way toward 199.50. Watching for a clear confirmation before entering a sell setup. Trading with patience and discipline is key.

GBPJPY Technical Analysis! SELL!
My dear friends,
Please, find my technical outlook for GBPJPY below:
The instrument tests an important psychological level 202.90
Bias - Bearish
Technical Indicators: Supper Trend gives a precise Bearish signal, while Pivot Point HL predicts price changes and potential reversals in the market.
Target - 201.75
About Used Indicators:
Super-trend indicator is more useful in trending markets where there are clear uptrends and downtrends in price.
Disclosure: I am part of Trade Nation's Influencer program and receive a monthly fee for using their TradingView charts in my analysis.
———————————
WISH YOU ALL LUCK

GBPJPY IDEA FOR OCT, 11TH 2025.The price is breaking new highs, which signals bullish momentum. If the price holds its current zone of resistance, that signals expectations of short-term selling power. Before it continues upwards, the price is still overall bullish.
As usual, my calls or analysis are based on what I see, the current Bias, and from a probability standpoint, meaning that this projection may be or may not be validated, so tread carefully. This is not financial advice; trade responsibly.

GBPJPY 15M: Bullish Setup The FVG Discount is Locked and LoadedThe Setup: FVG Mitigation and The Discount Zone
Price has returned and is currently sitting within the FVG box (roughly 202.900 - 203.050), signaling the completion of the necessary liquidity gathering (Manipulation/Candle 2). This area provides a premium entry with clearly defined risk. The overall momentum suggests we are looking to join the Distribution phase (Candle 3).
The Trading Thesis: Model #1 Confirmation is Key
Our strategy is to execute the trade at the start of the final expansionary move. We must now watch for the precise confirmation: a Bullish Model #1 setup or a strong candle rejection inside the FVG.
Risk Zone: The most critical level is the CRTL - TS (Control Low / Trend Start) line at 202.814. This level defines the absolute structural low for this current phase. Your Stop Loss (SL) must be placed safely below this point.
Primary Target: The liquidity objectives are stacked above! We are initially aiming for the CRTH (Control High) at 203.239, followed by the major price targets at 203.501 and the final objective at 203.572.
Patience is your edge! Wait for the rejection, confirm your Model #1 entry, and ride the expansion! 📈💰

GBPJPY Will Go Lower From Resistance! Sell!
Here is our detailed technical review for GBPJPY.
Time Frame: 1D
Current Trend: Bearish
Sentiment: Overbought (based on 7-period RSI)
Forecast: Bearish
The market is testing a major horizontal structure 203.050.
Taking into consideration the structure & trend analysis, I believe that the market will reach 200.345 level soon.
P.S
Please, note that an oversold/overbought condition can last for a long time, and therefore being oversold/overbought doesn't mean a price rally will come soon, or at all.
Like and subscribe and comment my ideas if you enjoy them!

GBPJPY IDEA FOR 10TH OCT, 2025. (2H)A New Trading week is here again, expecting fresh information, volumes, and data to flood the markets this week, plus we expect high-impact news releases as well
However, currently the GBP against the JPY is still overall bullish and trending because the pair is still breaking higher highs and forming new swings and structure patterns from my frame work below. I expect a short move downwards during LND sessions and, hopefully, a continuation later during the NY session. meanwhile, we wait for possible confirmations of trade ideas.
TIP: The USDJPY & GBPJPY have a positive correlation, meaning they move in the same direction in many scenarios and situations, but their technical analysis isn't the same.
As usual, my calls or analysis are based on what I see, the current Bias, and from a probability standpoint, meaning that this projection may be or may not be validated, so tread carefully. This is not financial advice; trade responsibly.

GBPJPY Forming Bullish IntentGBPJPY is currently trading around the 202.00 level, showing strong bullish intent within a well-defined ascending channel. The pair recently rebounded from the lower trendline support near 200.00, indicating that buyers are regaining control after a brief corrective phase. Technically, this setup reflects a continuation pattern, suggesting further upside movement toward the upper boundary of the channel near 206.00–207.00. As long as price action holds above the 200.00 psychological level, momentum favors bullish continuation, with potential opportunities for swing traders targeting the next resistance zone.
From a fundamental perspective, the British pound remains supported by resilient UK economic data and expectations that the Bank of England could maintain a tighter monetary stance longer than anticipated. Meanwhile, the Japanese yen continues to weaken due to the Bank of Japan’s ongoing ultra-loose monetary policy and lack of aggressive intervention to stabilize the currency. Global risk sentiment also plays a role—when risk appetite improves, GBPJPY tends to strengthen as investors favor higher-yielding assets like the pound over the yen.
Looking ahead, if GBPJPY sustains its position above 201.50–200.50, we could see a continuation of the bullish trend toward 205.50 and potentially 207.00. However, any break below the ascending support line may signal a short-term pullback before buyers step in again. With technical momentum aligning with current fundamentals, the pair maintains a bullish bias, making dips attractive for long entries in anticipation of the next upward impulse.

GBPJPY: Bullish Reversal Almost Confirmed! GBPJPY has perfectly filled up the liquidity voided area and now it has reversed nicely from that point. This entry is only valid if price breakthrough the inducement line and reconfirm the entry. Once it has completed this step, we can then set the target at 211 level.
There can be three target set in this pattern 205,208 and 212. These three levels are key points and you must follow these if you are planning to place swing trade.
As always do your own analysis and use this as a secondary bias only.
Team Setupsfx_

USDJPY and GBPJPY Analysis todayHello traders, this is a complete multiple timeframe analysis of this pair. We see could find significant trading opportunities as per analysis upon price action confirmation we may take this trade. Smash the like button if you find value in this analysis and drop a comment if you have any questions or let me know which pair to cover in my next analysis.

#GBPJPY:FVG Filled, Now Swing Move of +1200 Pips? GBPJPY is in bullish trend and it is likely that it will continue the bullish momentum until it reaches 210 price range. There can be three target set in this analysis. Good luck and trade safe!
Team Setupsfx_

GBPJPY BULLISH BIAS|LONG|
✅GBPJPY after mitigating the key demand level, price shows bullish order flow and imbalance fill. A potential rally may target the next external liquidity zone above recent swing highs. Time Frame 4H.
LONG🚀
✅Like and subscribe to never miss a new idea!✅

GBP/JPY | GBPJPY at Key Resistance Zone – Bears Getting Ready?By analyzing the GBP/JPY chart on the 4-hour timeframe, we can see that the price is currently trading around 201.00, which is a key supply zone.
We should wait for a drop below 200.59 and confirmation of price stability under this level before expecting a stronger bearish move. The downside targets are 200.50, 200.20, and 199.39.
Please support me with your likes and comments to motivate me to share more analysis with you and share your opinion about the possible trend of this chart with me !
Best Regards , Arman Shaban
GBPJPY H4 | Potential Bullish ReversalBased on the H4 chart analysis, we can see that the price has bounced off the buy entry, which is an overlap support, and could rise from this level to the take profit.
Buy entry is at 200.45, whichis an overlap support.
Stop loss is at 199.01, whichis a pullback support.
Take profit is at 202.03, whichis a pullback resistance.
Stratos Markets Limited (tradu.com ):
CFDs are complex instruments and come with a high risk of losing money rapidly due to leverage. 68% of retail investor accounts lose money when trading CFDs with this provider. You should consider whether you understand how CFDs work and whether you can afford to take the high risk of losing your money.
Stratos Europe Ltd (tradu.com ):
CFDs are complex instruments and come with a high risk of losing money rapidly due to leverage. 70% of retail investor accounts lose money when trading CFDs with this provider. You should consider whether you understand how CFDs work and whether you can afford to take the high risk of losing your money.

Stop!Loss|Market View: USDJPY🙌 Stop!Loss team welcomes you❗️
In this post, we're going to talk about the near-term outlook for the USDJPY currency pair☝️
Potential trade setup:
🔔Entry level: 154.304
💰TP: 156.111
⛔️SL: 153.446
"Market View" - a brief analysis of trading instruments, covering the most important aspects of the FOREX market.
👇 In the comments 👇 you can type the trading instrument you'd like to analyze, and we'll talk about it in our next posts.
💬 Description: A second test of the 153.446 support level isn't a good buy signal, and it's best to take aside from buy positions near current levels for now. The most attractive option for buyers remains near the 154.310 resistance level. If the price does reach that level soon, it's highly likely that the price will continue moving toward 155-156 as sellers liquidate their positions.
Thanks for your support 🚀
Profits for all ✅
❗️ Updates on this idea can be found below 👇

Stop!Loss|Market View: GBPUSD🙌 Stop!Loss team welcomes you❗️
In this post, we're going to talk about the near-term outlook for the GBPUSD currency pair☝️
Potential trade setup:
🔔Entry level: 1.31268
💰TP: 1.28032
⛔️SL: 1.32581
"Market View" - a brief analysis of trading instruments, covering the most important aspects of the FOREX market.
👇 In the comments 👇 you can type the trading instrument you'd like to analyze, and we'll talk about it in our next posts.
💬 Description: As previously predicted, the USD's dominance is strengthening and is likely to continue in the mid-term. For the pound, all key short-term targets have been completed, as have the mid-term targets outlined in previous reviews. Further downward movement is currently expected toward 1.27130, which is the next significant support level. Given the current situation, sell opportunities are currently only located above 1.31590, should the price return there for a retest.
Thanks for your support 🚀
Profits for all ✅
❗️ Updates on this idea can be found below 👇

GBP/JPY) Bearish trend analysis Read The captionSMC Trading point update
Technical analysis of GBP/JPY, anticipating a retracement into a premium Fibonacci zone (0.62–0.79) before a continuation to the downside — targeting 198.79.
Here’s the detailed breakdown
---
Overall Idea
The market is currently in a bearish structure, and this analysis expects a pullback toward resistance (Fibonacci + EMA confluence) before the next impulsive bearish leg.
The plan is to sell from the premium zone with confirmation, aiming for 198.79 as the target point.
---
Key Components
1. Market Structure
GBP/JPY recently made a strong impulsive drop, confirming a bearish trend.
The current upward movement is viewed as a corrective retracement, not a reversal.
The analysis expects the pullback to form a lower high around the resistance zone before dropping again.
2. Fibonacci Retracement Zone
The highlighted blue zone (0.62–0.79 Fibonacci levels) marks the premium sell area.
The red arrow indicates the anticipated reaction point — likely near the 0.705 level.
This zone coincides with previous support-turned-resistance, adding confluence.
3. EMA Confluence
50 EMA (200.905) and 200 EMA (201.665) are both above price, sloping downward — confirming bearish momentum.
Price is projected to retest these EMAs, which will likely act as dynamic resistance before rejection.
4. Projected Path
The drawn path shows price retracing upward, hitting the 0.705 Fibonacci level, then reversing strongly downward.
The target zone at 198.79 aligns with a previous demand zone and measured move projection from the earlier impulse.
Mr SMC Trading point
---
Summary
Market bias: Bearish
Setup type: Retracement sell / Trend continuation
Sell zone: 0.62–0.79 Fibonacci retracement (≈ 200.90–201.70 area)
Target point: 198.79
Confirmation: Bearish rejection from the blue zone (candlestick pattern or structure break)
Invalidation: Break and close above 201.80
---
please support boost 🚀 this analysis

GBPJPY oversold bounce supported at 199.30The GBPJPY remains in a bullish trend, with recent price action showing signs of a breakout within the broader uptrend.
Support Zone: 199.30 – a key level from previous consolidation. Price is currently testing or approaching this level.
A bullish rebound from 199.30 would confirm ongoing upside momentum, with potential targets at:
202.44 – initial resistance
203.00 – psychological and structural level
204.30 – extended resistance on the longer-term chart
Bearish Scenario:
A confirmed break and daily close below 199.30 would weaken the bullish outlook and suggest deeper downside risk toward:
198.75 – minor support
198.00 – stronger support and potential demand zone
Outlook:
Bullish bias remains intact while the FTSE holds above 199.30. A sustained break below this level could shift momentum to the downside in the short term.
This communication is for informational purposes only and should not be viewed as any form of recommendation as to a particular course of action or as investment advice. It is not intended as an offer or solicitation for the purchase or sale of any financial instrument or as an official confirmation of any transaction. Opinions, estimates and assumptions expressed herein are made as of the date of this communication and are subject to change without notice. This communication has been prepared based upon information, including market prices, data and other information, believed to be reliable; however, Trade Nation does not warrant its completeness or accuracy. All market prices and market data contained in or attached to this communication are indicative and subject to change without notice.

GBP/JPY BEARS WILL DOMINATE THE MARKET|SHORT
Hello, Friends!
Previous week’s green candle means that for us the GBP/JPY pair is in the uptrend. And the current movement leg was also up but the resistance line will be hit soon and upper BB band proximity will signal an overbought condition so we will go for a counter-trend short trade with the target being at 200.420.
Disclosure: I am part of Trade Nation's Influencer program and receive a monthly fee for using their TradingView charts in my analysis.
✅LIKE AND COMMENT MY IDEAS✅
