GBPJPY – Bears Just Getting Started?1. Market’s Context
In my previous two analyses, I highlighted the high probability of a drop in GBPJPY and noted that as long as resistance holds, the preferred scenario is to look for selling opportunities.
Yesterday, the market finally broke below the 199.00 support, reaching a local low around 198.90.
________________________________________
2. The Key Question
Was this just the first step of a deeper bearish move?
________________________________________
3. Why the Bearish Case is Strong
• Resistance remains intact, limiting upside potential.
• Break of 199.00 support confirms bearish momentum.
• Current price action looks more like a corrective rebound than a reversal.
• Structure suggests the decline could just be starting.
________________________________________
4. Trading Plan
• I remain bearish.
• Selling rallies is back in play.
• Target: the 195.00 zone remains my focus.
________________________________________
5. Final Note 🚀
GBPJPY has confirmed the break—now it’s all about execution. Sell the rebounds, aim for 195.
Disclosure: I am part of TradeNation's Influencer program and receive a monthly fee for using their TradingView charts in my analyses and educational articles.
GBPJPY

GBPJPY – Bulls Knocked Out, Bears Step In!After rejecting the 200.00 resistance, GBPJPY broke below key structure and shifted momentum to bearish.
Price is now retesting the broken support turned resistance, aligned with a descending trendline.
🔎 As long as this area holds, the bias remains bearish with potential for another downward leg.
👉 Plan: Look for short opportunities around the retest zone.
📚 Always follow your trading plan regarding entry, risk management, and trade management.
Good luck!
All Strategies Are Good; If Managed Properly!
~Rich
Disclosure: I am part of Trade Nation's Influencer program and receive a monthly fee for using their TradingView charts in my analysis.

GBPJPY H4 | Falling towards 50% Fibonacci supportBased on the H4 chart analysis, we could see the price fall to the buy entry, which is a pullback support that aligns with the 50% Fibonacci retracement and could bounce to the take profit.
Buy entry is at 197.51, which is a pullback support that lines up with the 50% Fibonacci retracement.
Stop loss is at 196.36, which is a pullback support that is slightly above the 78.6% Fibonacci retracement.
Take profit is at 198.91, which is a pullback resistance.
High Risk Investment Warning
Trading Forex/CFDs on margin carries a high level of risk and may not be suitable for all investors. Leverage can work against you.
Stratos Markets Limited (tradu.com ):
CFDs are complex instruments and come with a high risk of losing money rapidly due to leverage. 65% of retail investor accounts lose money when trading CFDs with this provider. You should consider whether you understand how CFDs work and whether you can afford to take the high risk of losing your money.
Stratos Europe Ltd (tradu.com ):
CFDs are complex instruments and come with a high risk of losing money rapidly due to leverage. 66% of retail investor accounts lose money when trading CFDs with this provider. You should consider whether you understand how CFDs work and whether you can afford to take the high risk of losing your money.
Stratos Global LLC (tradu.com ):
Losses can exceed deposits.
Please be advised that the information presented on TradingView is provided to Tradu (‘Company’, ‘we’) by a third-party provider (‘TFA Global Pte Ltd’). Please be reminded that you are solely responsible for the trading decisions on your account. There is a very high degree of risk involved in trading. Any information and/or content is intended entirely for research, educational and informational purposes only and does not constitute investment or consultation advice or investment strategy. The information is not tailored to the investment needs of any specific person and therefore does not involve a consideration of any of the investment objectives, financial situation or needs of any viewer that may receive it. Kindly also note that past performance is not a reliable indicator of future results. Actual results may differ materially from those anticipated in forward-looking or past performance statements. We assume no liability as to the accuracy or completeness of any of the information and/or content provided herein and the Company cannot be held responsible for any omission, mistake nor for any loss or damage including without limitation to any loss of profit which may arise from reliance on any information supplied by TFA Global Pte Ltd.
The speaker(s) is neither an employee, agent nor representative of Tradu and is therefore acting independently. The opinions given are their own, constitute general market commentary, and do not constitute the opinion or advice of Tradu or any form of personal or investment advice. Tradu neither endorses nor guarantees offerings of third-party speakers, nor is Tradu responsible for the content, veracity or opinions of third-party speakers, presenters or participants.

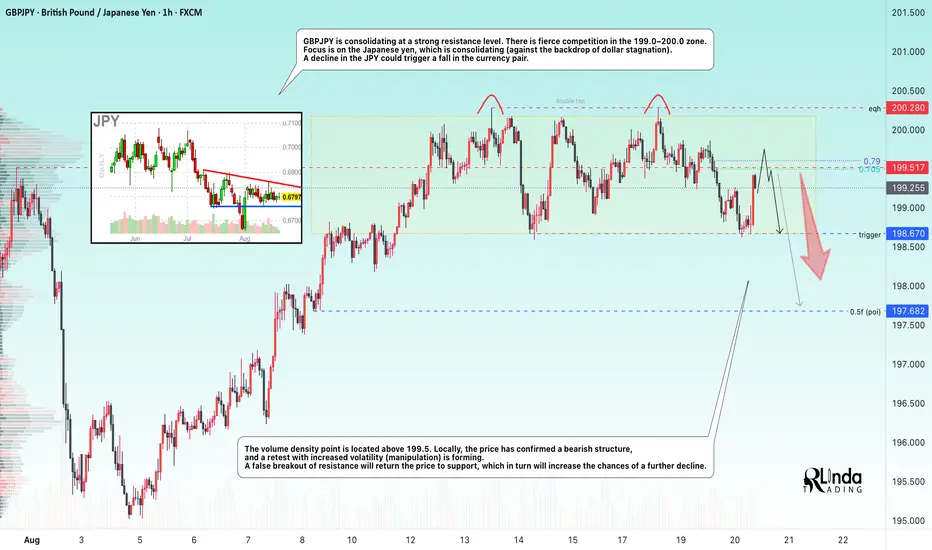
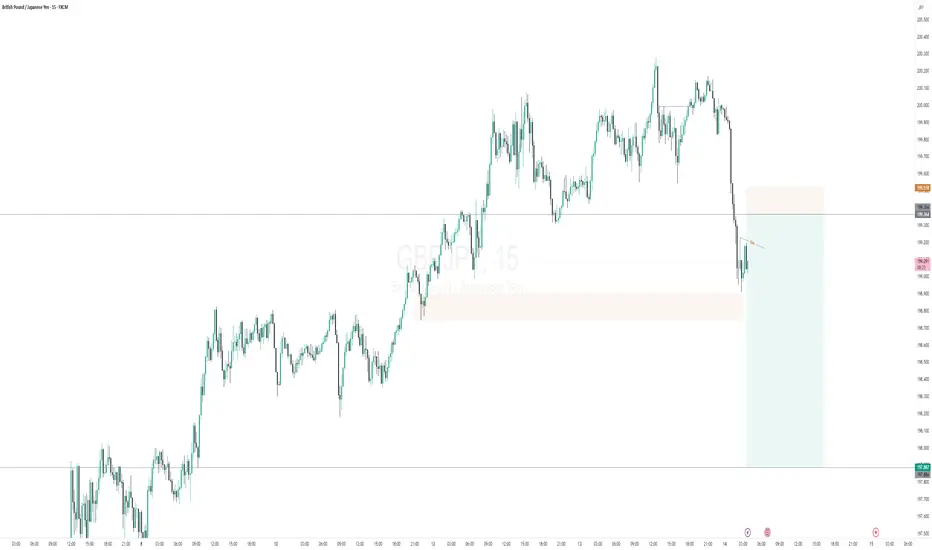
GBPJPY → False breakout and reversal patternFX:GBPJPY is forming a false breakout of strong resistance from D1. A trading range (consolidation) is forming, and market participants are fighting for the 199.0 - 200.0 zone.
GBPJPY is consolidating at strong resistance. A fierce battle is underway for the 199.0-200.0 zone. Focus is on the Japanese yen, which is consolidating (against a backdrop of dollar stagnation). A decline in the JPY could trigger a fall in the currency pair.
The volume density point is located above 199.5. Locally, the price has confirmed a bearish structure, and a retest is forming on increased volatility (manipulation). A false breakout of resistance will return the price to support, which in turn will increase the chances of a further decline
Resistance levels: 199.5, 200.28
Support levels: 198.67, 197.68
A double top reversal pattern is forming on the chart, indicating the presence of strong limit resistance, but the pattern has not yet been realized. The trigger is consolidation support. Locally, I expect a decline from 199.5 to retest the trigger, the breakout of which could trigger the reversal pattern.
Best regards, R. Linda!
GBPJPY CRAZY IDEAS This is my crazy setup for GBPJPY for long posisition, it will be happen, because there are historically happened if you see the previous pattern

Bullish bounce?GBP/JPY is falling towards the pivot and could bounce to the 1st resistance which acts as a pullback resistance.
Pivot: 197.49
1st Support: 196.40
1st Resistance: 198.90
Risk Warning:
Trading Forex and CFDs carries a high level of risk to your capital and you should only trade with money you can afford to lose. Trading Forex and CFDs may not be suitable for all investors, so please ensure that you fully understand the risks involved and seek independent advice if necessary.
Disclaimer:
The above opinions given constitute general market commentary, and do not constitute the opinion or advice of IC Markets or any form of personal or investment advice.
Any opinions, news, research, analyses, prices, other information, or links to third-party sites contained on this website are provided on an "as-is" basis, are intended only to be informative, is not an advice nor a recommendation, nor research, or a record of our trading prices, or an offer of, or solicitation for a transaction in any financial instrument and thus should not be treated as such. The information provided does not involve any specific investment objectives, financial situation and needs of any specific person who may receive it. Please be aware, that past performance is not a reliable indicator of future performance and/or results. Past Performance or Forward-looking scenarios based upon the reasonable beliefs of the third-party provider are not a guarantee of future performance. Actual results may differ materially from those anticipated in forward-looking or past performance statements. IC Markets makes no representation or warranty and assumes no liability as to the accuracy or completeness of the information provided, nor any loss arising from any investment based on a recommendation, forecast or any information supplied by any third-party.

GBPJPY Technical Analysis! BUY!
My dear subscribers,
GBPJPY looks like it will make a good move, and here are the details:
The market is trading on 198.03 pivot level.
Bias - Bullish
My Stop Loss - 197.65
Technical Indicators: Both Super Trend & Pivot HL indicate a highly probable Bullish continuation.
Target - 198.79
About Used Indicators:
The average true range (ATR) plays an important role in 'Supertrend' as the indicator uses ATR to calculate its value. The ATR indicator signals the degree of price volatility.
Disclosure: I am part of Trade Nation's Influencer program and receive a monthly fee for using their TradingView charts in my analysis.
———————————
WISH YOU ALL LUCK

GBPJPY Will Go Up! Long!
Take a look at our analysis for GBPJPY.
Time Frame: 3h
Current Trend: Bullish
Sentiment: Oversold (based on 7-period RSI)
Forecast: Bullish
The price is testing a key support 198.818.
Current market trend & oversold RSI makes me think that buyers will push the price. I will anticipate a bullish movement at least to 200.145 level.
P.S
The term oversold refers to a condition where an asset has traded lower in price and has the potential for a price bounce.
Overbought refers to market scenarios where the instrument is traded considerably higher than its fair value. Overvaluation is caused by market sentiments when there is positive news.
Disclosure: I am part of Trade Nation's Influencer program and receive a monthly fee for using their TradingView charts in my analysis.
Like and subscribe and comment my ideas if you enjoy them!

Trading balanceTrading balance The price of the asset has rebounded from the balance zone. With the prospect of growth into the resistance zone.

GBPJPY Testing the Ceiling Reversal Risk Looms Near 200.20After a persistent climb back toward the 200.20 resistance zone, GBP/JPY is once again testing its upper boundary. The pair has formed repeated rejection patterns at this level, suggesting that momentum may be stalling. With macro headwinds for the pound and persistent safe-haven demand for the yen, this setup favors downside opportunities if the ceiling holds.
Current Bias
Bearish – GBP/JPY is showing signs of exhaustion at the 200.20 zone with multiple rejections, aligning with both technical resistance and fundamental headwinds for GBP.
Key Fundamental Drivers
GBP: Pressured by slowing UK growth, softer inflation trends, and the Bank of England’s dovish tilt toward rate cuts.
JPY: Supported by safe-haven demand amid tariff and geopolitical risks, while BOJ continues to balance policy dovishness with verbal intervention threats.
Diverging fundamentals favor yen strength over sterling.
Macro Context
Interest Rates: UK rates are expected to drift lower as inflation moderates, while Japan’s ultra-dovish BOJ keeps real yields negative but benefits from haven demand.
Economic Growth: UK faces stagnation risks; Japan’s fiscal and FX stability narrative is keeping JPY demand intact despite weak growth.
Commodity Flows: GBP is not commodity-linked, but global trade tensions weigh indirectly through risk sentiment.
Geopolitics: Ongoing tariff disputes and global risk-off conditions amplify yen’s role as a haven currency.
Primary Risk to the Trend
A sharp rebound in UK data or hawkish BoE pivot could revive GBP strength. Alternatively, sudden BOJ/Ministry of Finance intervention talk could cap yen strength, limiting downside.
Most Critical Upcoming News/Event
UK CPI (this week) – A hotter-than-expected print could stall GBP downside.
Japan CPI/BOJ guidance – Closely watched for hints of intervention or policy shifts.
Leader/Lagger Dynamics
GBP/JPY is a leader in JPY crosses, often setting the tone for risk appetite and amplifying volatility across yen pairs (USD/JPY, AUD/JPY). It influences GBP risk sentiment but is more reactive to yen moves than to sterling strength alone.
Key Levels
Support Levels: 198.73, 197.72, 196.71
Resistance Levels: 200.20, 200.28 (upper rejection zone)
Stop Loss (SL): 200.50 (above rejection zone to protect against false breakouts)
Take Profit (TP):
TP1: 198.73
TP2: 197.72
TP3: 196.71
Summary: Bias and Watchpoints
GBP/JPY remains bearish into the 200.20 resistance zone, where repeated rejection signals exhaustion. With the BoE leaning dovish and yen supported by risk-off flows, the setup favors a downside move targeting 198.73 → 197.72 → 196.71. A protective stop above 200.50 safeguards against breakouts. The main watchpoints are UK CPI and BOJ signals, which could swing sentiment sharply. As a leader among JPY crosses, GBP/JPY will likely dictate risk momentum across related yen pairs, making this level a decisive battleground.

GBPJPY H4 | Bearish drop offGBP/JPY is reacting off the sell entry, which acts as a pullback support, and a break below this level could lead the price to drop the downside.
Sell entry is at 198.96, which is a pullback support.
Stop loss is at 200.07, which is a multi-swing high resistance.
Take profit is 197.57, which is a pullback support that lines up with the 50% Fibonacci retracement.
High Risk Investment Warning
Trading Forex/CFDs on margin carries a high level of risk and may not be suitable for all investors. Leverage can work against you.
Stratos Markets Limited (tradu.com ):
CFDs are complex instruments and come with a high risk of losing money rapidly due to leverage. 65% of retail investor accounts lose money when trading CFDs with this provider. You should consider whether you understand how CFDs work and whether you can afford to take the high risk of losing your money.
Stratos Europe Ltd (tradu.com ):
CFDs are complex instruments and come with a high risk of losing money rapidly due to leverage. 66% of retail investor accounts lose money when trading CFDs with this provider. You should consider whether you understand how CFDs work and whether you can afford to take the high risk of losing your money.
Stratos Global LLC (tradu.com ):
Losses can exceed deposits.
Please be advised that the information presented on TradingView is provided to Tradu (‘Company’, ‘we’) by a third-party provider (‘TFA Global Pte Ltd’). Please be reminded that you are solely responsible for the trading decisions on your account. There is a very high degree of risk involved in trading. Any information and/or content is intended entirely for research, educational and informational purposes only and does not constitute investment or consultation advice or investment strategy. The information is not tailored to the investment needs of any specific person and therefore does not involve a consideration of any of the investment objectives, financial situation or needs of any viewer that may receive it. Kindly also note that past performance is not a reliable indicator of future results. Actual results may differ materially from those anticipated in forward-looking or past performance statements. We assume no liability as to the accuracy or completeness of any of the information and/or content provided herein and the Company cannot be held responsible for any omission, mistake nor for any loss or damage including without limitation to any loss of profit which may arise from reliance on any information supplied by TFA Global Pte Ltd.
The speaker(s) is neither an employee, agent nor representative of Tradu and is therefore acting independently. The opinions given are their own, constitute general market commentary, and do not constitute the opinion or advice of Tradu or any form of personal or investment advice. Tradu neither endorses nor guarantees offerings of third-party speakers, nor is Tradu responsible for the content, veracity or opinions of third-party speakers, presenters or participants.

GBP/JPY Setup This GBP/JPY 1H analysis shows a bullish setup with entry around 198.9, targeting 200.275. The price is expected to bounce upward after retesting support, with a stop loss placed at 198.176 for risk management.

A British Japanese Triangle (GBP/JPY)Setup
Price broke out of a triangle pattern but after a successful test of prior highs at 200 psychological resistance, dropped back to the broken upper trendline of the triangle only to rebound back to the big 200 level.
Signal
The price snapped below its rising trendline on the daily chart as well as a price pivot at 196 - and RSI fell below support from the 50-level before rebounding sharply to form a new multi-week high. A daily close over 200 should confirm the uptrend has resumed.

Triangle Ascends on GJOANDA:GBPJPY seems to be forming an Ascending Triangle after a 3rd test of the Rising Support suggesting a strong Trendline that price is continuing to bounce from.
An Ascending Triangle is typically considered a Bullish Continuation Pattern when Price is in an uptrend prior to falling into the Pattern.
Currently Price is being held below the Horizontal Resistance Zone @ 200 - 200.3
Once Price is able to Break Above Resistance, this could deliver Long Opportunities as a Breakout and Retest Set-Up of the Ascending Triangle!
**Beware of potential False Breakout or a Breakout in the Bearish direction!

Is this where GJ starts making its big move?Hi Traders,
After breaking out of a failed swing tapping 200.000, GJ came down to retest the failed swing area at 199.000, bounced and reversed. Around 199.500 could be another retest/entry area before continuation. The weekly looks really good IMO, so I am planning to swing trade. My first target would be around 201.500, and then 203.000. 203.000 would hit an area of a weekly bearish OB.
*DISCLAIMER: I am not a financial advisor. The ideas and trades I take on my page are for educational and entertainment purposes only. I'm just showing you guys how I trade. Remember, trading of any kind involves risk. Your investments are solely your responsibility and not mine.*

confirmed rejection on GJ In reference to our previous discussion, it is worth noting that the price has recently encountered strong resistance at an extreme 15-minute Area of Interest (AOI). Following this, on the hourly chart, we observed that the price closed within our designated 2-hour G-spot.
To gain further insights, I recommend examining the 5-minute or 3-minute charts, where you will notice a clear shift in trend, along with a 3-minute Order Block (OB) formation.
This presents a solid opportunity for a confirmed entry point. I encourage you to review your charts for a detailed analysis. Happy trading!

GBPJPY – Critical Zone Between 199 and 200Last week, I mentioned that I was watching both GBPJPY and EURJPY closely, as a strong drop could be just around the corner.
Given its higher volatility, I chose to open a short on GBPJPY, which I closed Friday with a negligible profit after the pair reversed once more from just under 199.
Despite that, my overall outlook hasn’t changed – in fact, it has been reinforced by yet another failed attempt to conquer the 200 zone.
📌 Trading Plan:
- I’m looking to re-enter short on GBPJPY.
- My initial target remains the 195 zone.
- Confirmation: A daily close under 199 would signal that a top is likely in place.
- Negation: If the market stabilizes above 200, this bearish scenario is off the table.
In other words, GBPJPY is at a critical juncture – either it confirms the top and accelerates lower, or the 200 level finally gives way.
That being said, I’m prepared for the short side. 🚀
Disclosure: I am part of TradeNation's Influencer program and receive a monthly fee for using their TradingView charts in my analyses and educational articles.

GBP/JPY - Triangle Breakout (18.08.2025)The GBP/JPY pair on the M30 timeframe presents a Potential Buying Opportunity due to a recent Formation of a Triangle Breakout Pattern. This suggests a shift in momentum towards the upside and a higher likelihood of further advances in the coming hours.
Possible Long Trade:
Entry: Consider Entering A Long Position around Trendline Of The Pattern.
Target Levels:
1st Resistance – 200.79
2nd Resistance – 201.24
🎁 Please hit the like button and
🎁 Leave a comment to support for My Post !
Your likes and comments are incredibly motivating and will encourage me to share more analysis with you.
Best Regards, KABHI_TA_TRADING
Thank you.
Disclosure: I am part of Trade Nation's Influencer program and receive a monthly fee for using their TradingView charts in my analysis.

GBPJPY - ShortGBPJPY Analysis - SELL 👆
In this Chart GBPJPY H4 Timeframe: By Nii_Billions.
❤️This Chart is for GBPJPY market analysis.
❤️Entry, SL, and Target is based off our Strategy.
This chart analysis uses multiple timeframes to analyze the market and to help see the bigger picture on the charts.
The strategy uses technical and fundamental factors, and market sentiment to predict a BEARISH trend in GBPJPY, with well-defined entry, stop loss, and take profit levels for risk management.
🟢This idea is purely for educational purposes.🟢
❤️Please, support our work with like & comment!❤️

GBP/JPY Long Attack After MA Breakout – Loot the Beast!🔓 GBP/JPY Bullish Break-In Heist! 💷💣 Price Cracked the MA Vault 🎯
🏴☠️ Welcome to the GBP/JPY Treasure Run!
Thief Trader’s back in the FX vault—this time we’re after the Beast Pair. A clean moving average breakout just unlocked the vault at 196.900, and we’re going in heavy with layered long entries!
📈 Heist Blueprint:
Asset: GBP/JPY
🧭 Plan: Bullish (Price has broken key MA level)
🎯 Entry: ANY price above 196.900 (after MA breakout confirmation)
📉 Stop Loss: 195.000 (secure the backdoor)
💰 Target: 199.500 (clean getaway zone)
🔫 Entry Method: Limit orders stacked like trapdoors — Thief’s layering strategy in motion!
💼 Strategy Breakdown:
⚔️ Scalp Raiders: Snipe quick profits on the M15-M30 pullbacks.
🛡 Swing Bandits: Ride this bullish wagon up to 199.500. Use trailing SL to stay alive.
📡 Chart Radar: Eyes on volume spikes + MA alignment = green signal for aggressive buys.
🧠 Market Logic Behind the Heist:
🔥 MA breakout confirms buyer strength
🔍 Intermarket flow supports GBP dominance
📊 Sentiment & positioning flip to bullish
💼 Risk events priced in – no traps detected (yet)
🚨 Caution for Rookie Thieves:
News bombs ahead? Lock down with tighter SLs or pause the raid until the dust settles.
💎 Join the Crew of Chart Bandits!
👍 Like this plan? 🔁 Share it.
💬 Drop your view. 💣 Boost it with a 🚀
We're not just trading—we’re robbing the market with style.
🔐 Stay dangerous, stay profitable…
THIEF TRADER OUT. 🏴☠️📉📈

Breaker Block -Trend ReversalsBearish Structure - Liquidity(Inducement) - Breaker Block
GBP/JPY Bearish Reversal Trade – Smart Entry on M15
1. Market Overview
The GBP/JPY pair recently showed signs of weakness after an extended bullish move. Price approached a major resistance zone on the higher timeframe, and the 15-minute chart began forming lower highs, signaling a potential reversal. This shift indicated sellers were gaining control after liquidity was grabbed above the previous high.
2. Trade Setup
• Entry Type: Sell (Short Position)
• Entry Zone: Closest Breaker Block to the Inducement.
• Stop Loss (SL): Placed covers the entire block.
• Take Profit (TP): Targeted the next major demand zone, aligning with the overall bearish bias.
This setup allow a precise entry with a tight stop loss, maximizing the potential reward.
3. Technical Insights
• Break of Structure: The initial bearish impulse confirmed sellers stepping in
• Supply Zone Respect: Price rejected from the identified order block
• Entry Confirmation: Rejection candle and bearish engulfing provided a high-probability signal
Summary:
GBPJPY | 15M – Bearish reversal trade after BOS and Inducement. Breaker Block Entry
Your thoughts? Share in the comments!
GBPJPY oversold bounce backs capped at 200.40The GBPJPY pair is currently trading with a bearish bias, aligned with the broader downward trend. Recent price action shows a retest of the resistance, suggesting a temporary relief rally within the downtrend.
Key resistance is located at 200.40, a prior consolidation zone. This level will be critical in determining the next directional move.
A bearish rejection from 200.40 could confirm the resumption of the downtrend, targeting the next support levels at 197.55, followed by 196.20 and 195.35 over a longer timeframe.
Conversely, a decisive breakout and daily close above 200.40 would invalidate the current bearish setup, shifting sentiment to bullish and potentially triggering a move towards 201.30, then 0.8140.
Conclusion:
The short-term outlook remains bearish unless the pair breaks and holds above 200.40. Traders should watch for price action signals around this key level to confirm direction. A rejection favours fresh downside continuation, while a breakout signals a potential trend reversal or deeper correction.
This communication is for informational purposes only and should not be viewed as any form of recommendation as to a particular course of action or as investment advice. It is not intended as an offer or solicitation for the purchase or sale of any financial instrument or as an official confirmation of any transaction. Opinions, estimates and assumptions expressed herein are made as of the date of this communication and are subject to change without notice. This communication has been prepared based upon information, including market prices, data and other information, believed to be reliable; however, Trade Nation does not warrant its completeness or accuracy. All market prices and market data contained in or attached to this communication are indicative and subject to change without notice.

GBPJPY Is Very Bullish! Long!
Here is our detailed technical review for GBPJPY.
Time Frame: 12h
Current Trend: Bullish
Sentiment: Oversold (based on 7-period RSI)
Forecast: Bullish
The market is testing a major horizontal structure 198.776.
Taking into consideration the structure & trend analysis, I believe that the market will reach 200.007 level soon.
P.S
Overbought describes a period of time where there has been a significant and consistent upward move in price over a period of time without much pullback.
Disclosure: I am part of Trade Nation's Influencer program and receive a monthly fee for using their TradingView charts in my analysis.
Like and subscribe and comment my ideas if you enjoy them!
