GBP/JPY BULLS ARE GAINING STRENGTH|LONG
Hello, Friends!
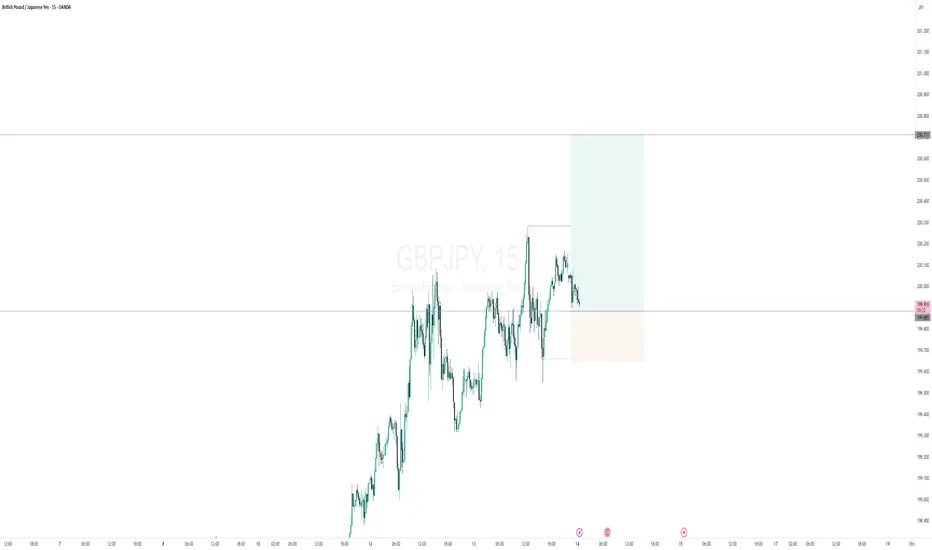
Previous week’s red candle means that for us the GBP/JPY pair is in the downtrend. And the current movement leg was also down but the support line will be hit soon and lower BB band proximity will signal an oversold condition so we will go for a counter-trend long trade with the target being at 197.696.
Disclosure: I am part of Trade Nation's Influencer program and receive a monthly fee for using their TradingView charts in my analysis.
✅LIKE AND COMMENT MY IDEAS✅
GBPJPY

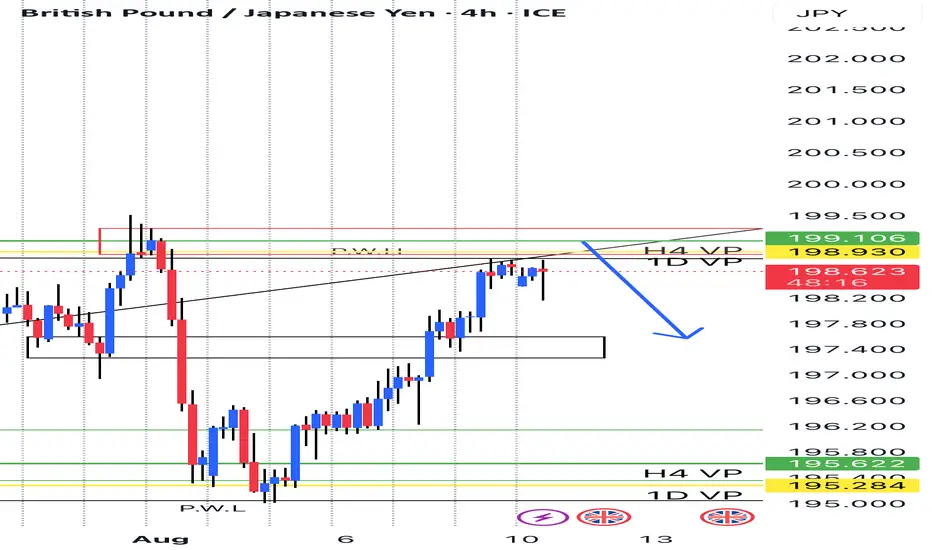
JPY Index – At a Critical JunctureLast month, I pointed out that the JPY Index was sitting in a very important support zone, making pairs like GBP/JPY and EUR/JPY worth keeping on traders’ radar.
Indeed, the index rebounded, which translated into a drop for both EUR/JPY and GBP/JPY. After the initial bounce, the index returned to test that zone once more.
What’s interesting now is that if the index continues higher, it will also break above the falling trendline. This could trigger an acceleration — and for GBP/JPY and EUR/JPY, that could mean a 500-pip drop.
JPY pairs should definitely be closely monitored from this point on. 🚀

GBP/JPY – Possible False Break Above 200After confirming 195 support at the beginning of August, GBP/JPY posted 7 consecutive daily gains, bringing the pair back to resistance and even spiking above it — briefly crossing the important psychological level of 200.
Today started with a sharp drop, suggesting that the 200+ zone is a significant milestone and hinting at a potential false breakout.
Trading Plan:
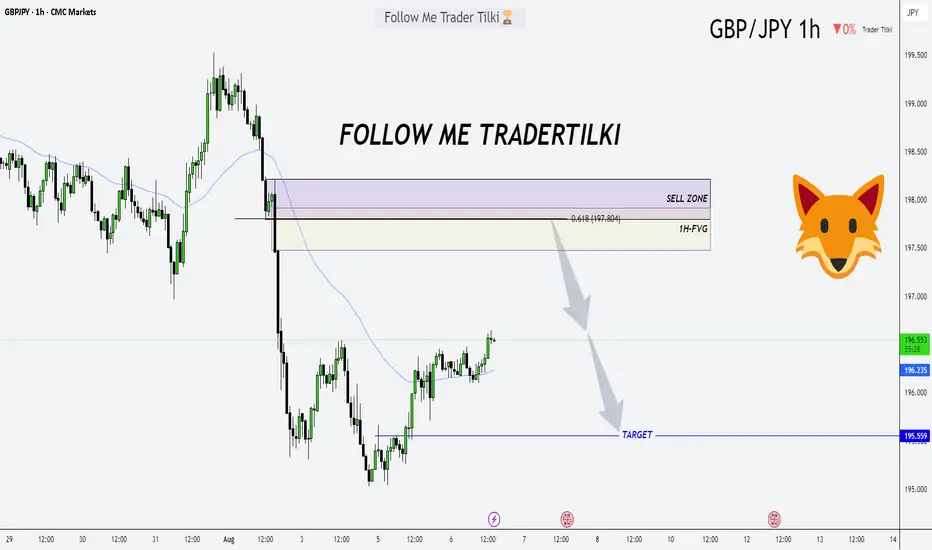
I will work with the assumption that GBP/JPY bears will hold firm around 200. The ideal sell zone is near 199.50, with a swing target back to the 195 support area, offering a risk–reward ratio of 1:5.
A sustained move above 200 would invalidate this scenario. 🚀
Disclosure: I am part of TradeNation's Influencer program and receive a monthly fee for using their TradingView charts in my analyses and educational articles.

Breaker Block - Trend ContinuationGBPJPY is currently Bullish.. The current structure signal an Upward movement.. The presence of an inducement after the BOS validates our Breaker Block for Buy continuation
Yen Reversal to 207.000? OANDA:GBPJPY is shaping up for a potential bullish reversal on the Daily chart, with an entry zone marked by the red box around 195.000-198.000 near a key support level.
The target at 207.000 aligns with the next major resistance, offering a strong upside potential. Set a stop loss on a daily break below 195.000 to guard against a breakdown. A break above 197.000 with solid volume could confirm this move, driven by GBP strength and yen weakness. Watch UK economic data and BoJ policy shifts as catalysts.
This setup is primed for traders ready to ride the wave—drop your take below!
#GBPJPY #ForexTrading #TechnicalAnalysis #TradingView #CurrencyPairs #DayTrading #MarketSignals

GBPJPY The Target Is DOWN! SELL!
My dear followers,
This is my opinion on the GBPJPY next move:
The asset is approaching an important pivot point 200.10
Bias - Bearish
Safe Stop Loss - 200.28
Technical Indicators: Supper Trend generates a clear short signal while Pivot Point HL is currently determining the overall Bearish trend of the market.
Goal - 199.76
About Used Indicators:
For more efficient signals, super-trend is used in combination with other indicators like Pivot Points.
Disclosure: I am part of Trade Nation's Influencer program and receive a monthly fee for using their TradingView charts in my analysis.
———————————
WISH YOU ALL LUCK

GBPJPY Bullish Leg has only just startedThe GBPJPY pair has been trading within a Channel Up since the April 09 2025 Low. Following the August 04 Higher Low, it has technically initiated the new Bullish Leg.
Given its strength on such an early stage, we expect it to be identical to the first Bullish Leg that rose by +6.53% and, at the same time, had a similar 1D MACD Bullish Leg. Our medium-term Target is thus 207.000.
-------------------------------------------------------------------------------
** Please LIKE 👍, FOLLOW ✅, SHARE 🙌 and COMMENT ✍ if you enjoy this idea! Also share your ideas and charts in the comments section below! This is best way to keep it relevant, support us, keep the content here free and allow the idea to reach as many people as possible. **
-------------------------------------------------------------------------------
Disclosure: I am part of Trade Nation's Influencer program and receive a monthly fee for using their TradingView charts in my analysis.
💸💸💸💸💸💸
👇 👇 👇 👇 👇 👇


GBPJPY continues its uptrend, aiming for 200,000 JPY.GBPJPY is currently trading within an ascending channel, with a strong rebound from support levels near 198,000 JPY. After forming a higher low at 199,000 JPY, the chart suggests the possibility of continuing the uptrend if GBPJPY can break through the next resistance at 200,000 JPY.
Recent news about the UK GDP growth and statements from Bank of England (BoE) officials are supporting the British Pound. Additionally, the BoE's tightening monetary policy to control inflation is helping stabilize and strengthen the Pound against the Japanese Yen. On the other hand, with the Bank of Japan's interest rate policy remaining largely unchanged, the JPY continues to weaken amid economic challenges.
If GBPJPY can break the 200,000 JPY resistance, the next upward target will be 201,000 JPY, and further towards 202,000 JPY. However, the current support lies at 199,000 JPY, and if this level is broken, a pullback to 198,000 JPY may occur.

GBPJPY: Bullish Trend Intact But Showing Slowing MomentumShould we buy up to sell?
(H4)
Strong impulsive bullish leg from 197.00
Clean untested demand zone: 197.20–197.40
(H1)
OB: 198.10–198.20 could act as intraday support
Above 198.80 opens imbalance toward 200
(M15)
Consolidation near 198.50–198.80 liquidity zone
Expecting either:
Pullback to demand zones before continuation
Direct breakout above 198.80 for momentum push
Game Plan For Selling:
Watch for London session liquidity grab above 199.40–199.60
As soon as M15 prints a bearish BOS after the sweep, look for a retest into the M15 supply for entry

GBP/JPY breaks 200 barrierThe GBP/JPY has just broken above the 200.00 mark for first time since July 2024. The pounds has been boosted by a hawkish BoE rate cut last week, and mixed UK data underpins, while rising global yields and rallying equity markets are undermining the low-yielding Japanese yen.
With the pair now above the 200.00 level, the key question now is whether the breakout will hold. Assuming it does, we could see a continuation of the rally towards the 202.00 level, which is now the next big resistance above here. Interim resistance comes in at 201.00 level.
In terms of support 199.00 is a clear support level, marking the high from the day before and the middle trend of the bullish channel, which the pair has just reclaimed. Below that? 197.50 is the next stop in the event we see a sudden drop.
UK wages fall more than expected
Earlier today, we had some mixed data from the UK following last week’s Bank of England rate cut, which was a very close call when policymakers were sharply divided but ultimately agreed to cut rates.
Today’s data showed average earnings increased by 4.6% in the three months to June compared to a year ago — weaker than the 5.0% rise we saw the previous month. On the jobs front, employment has now fallen eight times in the past nine months. However, the latest drop of 8,000 jobs is the smallest decline so far, suggesting the labour market may be stabilising.
A weakening jobs market could ease wage inflation pressures and open the door to further rate cuts, but whether this happens at November’s meeting remains uncertain following that hawkish cut last week, meaning the chance of another cut in November is now lower.
Meanwhile, a UK data dump is scheduled for Thursday when we will have Q2 GDP as well as monthly data on construction output, manufacturing production and a few other indicators to look forward to. The odds of a further BoE rate cut this year will continue to tumble in the event we see stronger data from the UK this week.
By Fawad Razaqzada, market analyst with FOREX.com

GBPJPY Sell Setup from Two Key Levels!Hey friends 👋
Here’s my carefully prepared GBPJPY analysis, just for you 📊
In this setup, I’ll be opening sell positions from two key levels:
1️⃣ 197.477
2️⃣ 198.100
My target level is: 🎯 195.560
Every single like you give truly fuels my motivation to keep sharing these insights.
Huge thanks to everyone who supports and encourages me with their likes 🙏
GBPJPY Forming Bullish ContinuationGBPJPY has broken upward from a multi-test demand zone near the 195.00–195.50 area on the daily chart, and buyers are now stepping in confidently. Price is holding above that support and pushing toward the upper resistance region. A clean move and close above 200.00 could set the stage for a further leg upward, targeting the 207.30 zone as indicated on the chart.
From a macro perspective, recent developments are in favor of the pound and against the yen. The Bank of England has started easing, cutting rates to 4% with a "gradual and careful" tone, but still remains relatively hawkish amid sticky inflation pressures. Meanwhile, the Bank of Japan remains cautious, keeping rates low, which continues to exert weakening pressure on the yen overall.
Technically, the bounce from that demand zone and clear upward momentum indicate a strong continuation pattern. As long as the pair stays above 195.50, the trend remains bullish. Traders may look to enter on dips with stops below that zone, aiming for the 207.30 level where resistance and liquidity converge.
Overall, GBPJPY is showing a compelling trend-following opportunity driven by both technical structure and fundamental divergence. Breaking above 200 would likely accelerate momentum toward the 207 area. It’s a high-probability setup with clearly defined risk levels and strong macro alignment—not to be missed.


My Confluences to give a SetupHi Traders!
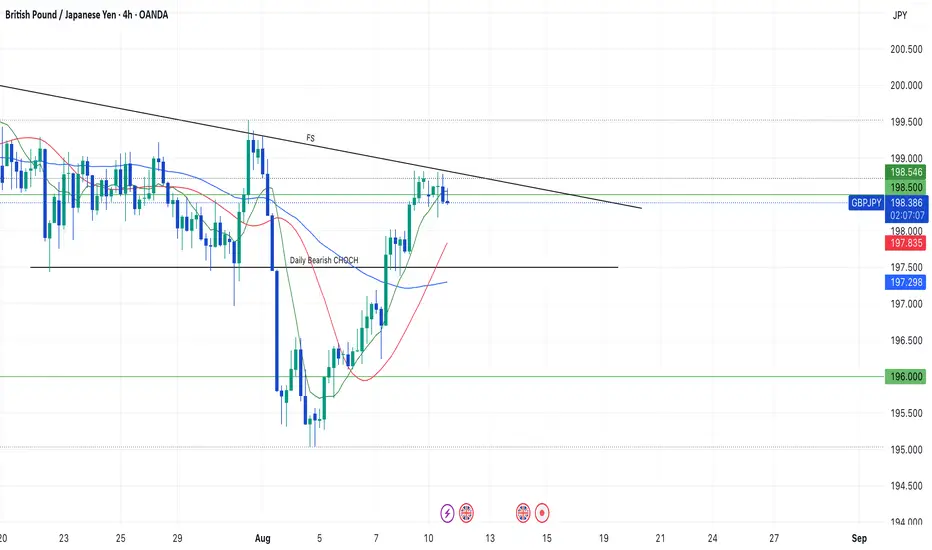
With GJ tapping 198.500 so many times, and eating up Monday July 28th Weekly Bearish candle on Monday the 4th, and testing a weekly CHOCH with rejection- I'm just waiting for a break set up. But, I'd like to see a few confluences first to have more confidence in a long. If price can retrace in between 198.000/197.000 on a higher TF (because it's had 4 Daily runs in a row) and create a new HL, that may confirm to me that the Daily bearish CHOCH would be invalid. Or for price to stay above 198.500 with bounces off that area showing momentum to break the failed swing. IMO, these confluences could give me the best set up possible. Patience is required to see if this set up will work.
*DISCLAIMER: I am not a financial advisor. The ideas and trades I take on my page are for educational and entertainment purposes only. I'm just showing you guys how I trade. Remember, trading of any kind involves risk. Your investments are solely your responsibility and not mine.*
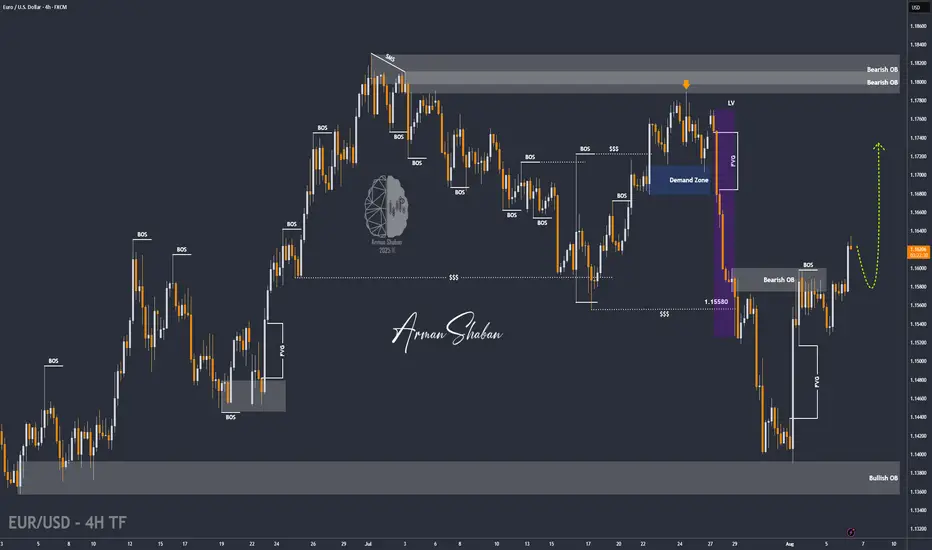
EUR/USD | Holding Above 1.16 Could Unlock More Upside! (READ IT)By analyzing the EURUSD chart on the 4-hour timeframe, we can see that the price reacted beautifully to all the marked zones on the chart. Especially after reaching the 1.14 demand area, it experienced a strong bullish move, rallying over 200 pips to hit 1.16. Currently, EURUSD is trading around 1.16220, and if it holds above the 1.16 level, we can expect further upside. The next bullish targets are 1.16435, 1.16780, 1.17100, and 1.17500.
Please support me with your likes and comments to motivate me to share more analysis with you and share your opinion about the possible trend of this chart with me !
Best Regards , Arman Shaban
GBPJPY; Heikin Ashi Trade Idea📈 Hey Traders!
Here’s a fresh outlook from my trading desk. If you’ve been following me for a while, you already know my approach:
🧩 I trade Supply & Demand zones using Heikin Ashi chart on the 4H timeframe.
🧠 I keep it mechanical and clean — no messy charts, no guessing games.
❌ No trendlines, no fixed sessions, no patterns, no indicator overload.
❌ No overanalyzing market structure or imbalances.
❌ No scalping, and no need to be glued to the screen.
✅ I trade exclusively with limit orders, so it’s more of a set-and-forget style.
✅ This means more freedom, less screen time, and a focus on quality setups.
✅ Just a simplified, structured plan and a calm mindset.
💬 Let’s Talk:
💡Do you trade supply & demand too ?
💡What’s your go-to timeframe ?
💡Ever tried Heikin Ashi ?
📩 Got questions about my strategy or setup? Drop them below — ask me anything, I’m here to share.
Let’s grow together and keep it simple. 👊

GBPJPYNext reaction for GBPJPY will be around 198.896 - 199.304. Once we see the reaction then we will wait for a drop.
Disclosure: We are part of Trade Nation’s Influence program and receive a monthly fee for using their tradingview charts in our analysis.
Trading balanceTrading balance The price of the asset has rebounded from the balance zone. With the prospect of growth into the resistance zone.
@fxopen

GBPJPY SELL SWEET SETUP SHOOOOOOOOOOOOORT HHHHHHHHHI think we should research selling opportunity
because we have uptrend line has broken and tested
and we have bearish channel and the price reflect from resistance on time frame 1W
SO SHORTLY i will sell Especially since we have a rebound from the imbalance as well.
Look at this picture as it makes it clearer to you

GBPJPY: Will Start Falling! Here is Why:
Our strategy, polished by years of trial and error has helped us identify what seems to be a great trading opportunity and we are here to share it with you as the time is ripe for us to sell GBPJPY.
Disclosure: I am part of Trade Nation's Influencer program and receive a monthly fee for using their TradingView charts in my analysis.
❤️ Please, support our work with like & comment! ❤️

GBPJPY bullish reaction to BoE policyKey Support: 196.75
This level marks the prior consolidation zone and serves as a critical pivot. A corrective pullback toward 196.75 followed by a bullish reversal would validate the uptrend, with upside targets at:
199.20 – Initial resistance and short-term target
199.70 – Minor resistance zone
200.40 – Longer-term breakout objective
However, a daily close below 196.75 would invalidate the bullish scenario, potentially triggering a deeper retracement toward:
195.80 – Near-term support
194.80 – Key downside level in a bearish reversal
Conclusion:
As long as 196.75 holds, the bias remains bullish, favoring continuation toward the 199–200 zone. A confirmed break below this support would shift momentum, opening the door for a broader corrective decline.
This communication is for informational purposes only and should not be viewed as any form of recommendation as to a particular course of action or as investment advice. It is not intended as an offer or solicitation for the purchase or sale of any financial instrument or as an official confirmation of any transaction. Opinions, estimates and assumptions expressed herein are made as of the date of this communication and are subject to change without notice. This communication has been prepared based upon information, including market prices, data and other information, believed to be reliable; however, Trade Nation does not warrant its completeness or accuracy. All market prices and market data contained in or attached to this communication are indicative and subject to change without notice.
