GBPUSD On The Rise! BUY!
My dear subscribers,
GBPUSD looks like it will make a good move, and here are the details:
The market is trading on 1.3077 pivot level.
Bias -Bullish
Technical Indicators: Both Super Trend & Pivot HL indicate a highly probable Bullish continuation.
Target - 1.3124
About Used Indicators:
The average true range (ATR) plays an important role in 'Supertrend' as the indicator uses ATR to calculate its value. The ATR indicator signals the degree of price volatility.
Disclosure: I am part of Trade Nation's Influencer program and receive a monthly fee for using their TradingView charts in my analysis.
———————————
WISH YOU ALL LUCK
GBPUSD

GBPUSD Is Very Bullish! Buy!
Take a look at our analysis for GBPUSD.
Time Frame: 6h
Current Trend: Bullish
Sentiment: Oversold (based on 7-period RSI)
Forecast: Bullish
The price is testing a key support 1.306.
Current market trend & oversold RSI makes me think that buyers will push the price. I will anticipate a bullish movement at least to 1.314 level.
P.S
We determine oversold/overbought condition with RSI indicator.
When it drops below 30 - the market is considered to be oversold.
When it bounces above 70 - the market is considered to be overbought.
Like and subscribe and comment my ideas if you enjoy them!

GBPUSD Is Very Bearish! Sell!
Here is our detailed technical review for GBPUSD.
Time Frame: 4h
Current Trend: Bearish
Sentiment: Overbought (based on 7-period RSI)
Forecast: Bearish
The market is testing a major horizontal structure 1.315.
Taking into consideration the structure & trend analysis, I believe that the market will reach 1.311 level soon.
P.S
We determine oversold/overbought condition with RSI indicator.
When it drops below 30 - the market is considered to be oversold.
When it bounces above 70 - the market is considered to be overbought.
Like and subscribe and comment my ideas if you enjoy them!

GBP/USD – Bullish Recovery Structure Targets 1.3150 Supply ZoneGBP/USD is forming a clear rounded-bottom recovery on the H1 chart after rejecting the low around 1.3040. This structure often represents a shift in short-term momentum, especially when price stabilizes above intraday support and starts curving upward toward a previously tested supply area.
In the current setup, buyers are gradually gaining control as price pushes away from the bottom of the curve, suggesting potential continuation into the 1.3140–1.3160 resistance cluster, where a large consolidation block previously acted as distribution.
Key Technical Zones
Support Levels
1.3040 – 1.3050: Local swing low and the base of the rounded bottom
1.3000: Psychological level + historical liquidity zone
Resistance Levels
1.3140 – 1.3160: Major H1 supply zone, strong reaction area
1.3200: Secondary resistance if buyers break above the supply block
Technical Confluence
Trendline curve: Price is respecting a rounded-bottom trajectory, confirming a shift from bearish momentum to a potential bullish retracement.
EMA dynamics: A retest of EMA20/EMA50 on H1 could fuel additional upside if price holds above 1.3050.
RSI: Earlier oversold conditions support a short-term bullish correction before the next directional decision.
Fibonacci: The 38.2%–50% retracement of the previous down-leg aligns closely with the 1.3140–1.3160 supply zone, creating high confluence for a reaction there.
Trading Strategy
Scenario 1: Bullish Continuation to Supply Zone
Entry: Buy on pullback toward 1.3055 – 1.3075
Target 1: 1.3120
Target 2: 1.3145–1.3160
Stop Loss: Below 1.3035
This setup follows the upward curvature and anticipates a move into the identified resistance block.
Scenario 2: Rejection From Supply Zone
If price reaches 1.3140–1.3160 and forms bearish rejection (H1 wick, engulfing, RSI divergence):
Entry: Sell after confirmed rejection
Target: 1.3070
Stop Loss: Above 1.3170
This is the more conservative approach, waiting for a reaction at a high-probability reversal zone.
Market Outlook
The rounded-bottom formation shows that the bearish leg has lost momentum. A corrective move toward the supply zone is highly probable. However, strong resistance overhead suggests buyers must break 1.3160 decisively to trigger a broader trend reversal.

GBP/USD LONG FROM SUPPORT
Hello, Friends!
GBP/USD pair is trading in a local uptrend which know by looking at the previous 1W candle which is green. On the 9H timeframe the pair is going down. The pair is oversold because the price is close to the lower band of the BB indicator. So we are looking to buy the pair with the lower BB line acting as support. The next target is 1.319 area.
Disclosure: I am part of Trade Nation's Influencer program and receive a monthly fee for using their TradingView charts in my analysis.
✅LIKE AND COMMENT MY IDEAS✅

GBP/USD Price Outlook – Trade Setup📊 Technical Structure
FPMARKETS:GBPUSD GBP/USD has bounced from the Support Zone at 1.3061–1.3029, after a sharp four-day decline. Price is now consolidating just above support around 1.3060, with the next Resistance Zone seen near 1.3147–1.3174.
As long as 1.3030 holds, the structure favours a corrective rebound back into the previous consolidation band. A decisive break above 1.3120 would open the way toward 1.3170+. Conversely, a clean close below 1.3030 would invalidate the bullish setup and expose the 1.2980–1.3000 region.
🎯 Trade Setup
Idea: Buy near support for a rebound toward the resistance zone.
Entry: 1.3039 – 1.3061
Stop Loss: 1.3032
Take Profit 1: 1.3147
Take Profit 2: 1.3174
Risk–Reward Ratio: ≈ 1 : 2.6
Bias remains cautiously bullish while price holds above 1.3030.
🌐 Macro Background
Cable is trading with mild gains around 1.3060, snapping a four-day losing streak as markets turn cautious ahead of the delayed US September NFP release.
FXStreet’s Lallalit Srijandorn notes that markets now see a BoE December rate cut as likely, after UK CPI slowed to 3.6% YoY in October, reinforcing expectations of policy easing and limiting medium-term upside for GBP. At the same time, the coming UK budget on 26 November could further shape BoE expectations.
On the US side, the labour-market picture remains blurred by the 43-day government shutdown, which delayed key economic data. Economists expect around 50k new jobs in September and unemployment at 4.3%. A weaker-than-expected NFP print could weigh on the USD and support GBP/USD, while a strong report would reinforce the Fed’s cautious stance and potentially cap the pair’s recovery.
FOMC minutes showed “strongly differing views” on the December decision: while most officials still support cuts in principle, many are open to keeping rates steady for the rest of the year, leaving the policy path highly data-dependent.
Overall, GBP faces headwinds from BoE cut pricing, but short-term, a softer USD on weak NFP could allow a technical rebound toward 1.3150–1.3170.
🔑 Key Technical Levels
Resistance: 1.3147 – 1.3174
Support: 1.3039 – 1.3061
Psychological Levels: 1.3000, 1.3100
📌 Trade Summary
GBP/USD is attempting to base above 1.3039 support after an extended selloff. The setup favours buying dips toward support, targeting a corrective move into the 1.3147–1.3174 resistance band, especially if the US NFP report disappoints and pressures the USD. A daily close below 1.3030 would negate this view and argue for a deeper slide toward 1.2980.
⚠️ Disclaimer
This analysis is for reference only and does not constitute trading advice. Trading involves significant risk, and proper risk management is essential.

GBP/AUD: Upside Potential from High Volume ZoneCurrent Situation:
GBP/AUD price reached the resistance level at 2.03417, where limit players halted the upward movement and pushed the price down into a high volume zone. A small reversal structure is forming in this area, indicating a possible resumption of growth.
Primary Scenario:
We expect continuation of upward movement from the current support zone. The presence of an unfilled gap above confirms the probability of price attraction to these levels. The high volume zone serves as a platform for building buying interest from institutional participants.
Target Levels:
Primary target: filling the gap above current levels
Secondary target: updating the high around 2.03417 and beyond
Alternative Scenario:
If price fails to hold within the high volume zone and breaks below it with increased selling volume, this will invalidate the bullish scenario and open the path for a deeper correction.
Trading Plan:
Entry Zone: Current high volume zone (position already opened)
Key Resistance: 2.03417
Support Level: Lower boundary of the high volume zone
Position Management:
Monitor price development in the reversal zone. Upon confirmation of upward movement, partial profit-taking is recommended as price approaches the 2.03417 level, followed by trailing the remaining position.
Risk Management:
Stop-loss should be placed below the high volume zone to protect against the alternative scenario realization.

GBPUSD: Breakout & Important Supply Zone 🇬🇧🇺🇸
GBPUSD broke and closed below a key horizontal support.
The broken structure and a falling trend line compose a significant
supply zone now.
I will look for selling from there, expecting a bearish movement
to 1.3024 support.
❤️Please, support my work with like, thank you!❤️
I am part of Trade Nation's Influencer program and receive a monthly fee for using their TradingView charts in my analysis.

EURGBP FRGNT Daily Forecast -Q4 | W47| D20 | Y25 |
📅 Q4 | W47| D20 | Y25 |
📊 EURGBP FRGNT Daily Forecast
🔍 Analysis Approach:
I’m applying Smart Money Concepts, focusing on:
Identifying Points of Interest on the Higher Time Frames (HTFs) 🕰️
Using those POIs to define a clear trading range 📐
Refining those zones on Lower Time Frames (LTFs) 🔎
Waiting for a Break of Structure (BoS) for confirmation ✅
This method allows me to stay precise, disciplined, and aligned with the market narrative, rather than chasing price.
💡 My Motto:
"Capital management, discipline, and consistency in your trading edge."
A positive risk-to-reward ratio, paired with a high win rate, is the backbone of any solid trading plan 📈🔐
⚠️ Losses?
They’re part of the mathematical game of trading 🎲
They don’t define you — they’re necessary, they happen, and we move forward 📊➡️
🙏 I appreciate you taking the time to review my Daily Forecast.
Stay sharp, stay consistent, and protect your capital
— FRNGT 🚀
FX:EURGBP

GBPUSD FRGNT Daily Forecast -Q4 | W47| D20 | Y25 |📅 Q4 | W47| D20 | Y25 |
📊 GBPUSD FRGNT Daily Forecast
🔍 Analysis Approach:
I’m applying Smart Money Concepts, focusing on:
Identifying Points of Interest on the Higher Time Frames (HTFs) 🕰️
Using those POIs to define a clear trading range 📐
Refining those zones on Lower Time Frames (LTFs) 🔎
Waiting for a Break of Structure (BoS) for confirmation ✅
This method allows me to stay precise, disciplined, and aligned with the market narrative, rather than chasing price.
💡 My Motto:
"Capital management, discipline, and consistency in your trading edge."
A positive risk-to-reward ratio, paired with a high win rate, is the backbone of any solid trading plan 📈🔐
⚠️ Losses?
They’re part of the mathematical game of trading 🎲
They don’t define you — they’re necessary, they happen, and we move forward 📊➡️
🙏 I appreciate you taking the time to review my Daily Forecast.
Stay sharp, stay consistent, and protect your capital
— FRNGT 🚀
FX:GBPUSD

DXY FRGNT Daily Forecast -Q4 | W47| D20 | Y25 |📅 Q4 | W47| D20 | Y25 |
📊 DXY FRGNT Daily Forecast
🔍 Analysis Approach:
I’m applying Smart Money Concepts, focusing on:
Identifying Points of Interest on the Higher Time Frames (HTFs) 🕰️
Using those POIs to define a clear trading range 📐
Refining those zones on Lower Time Frames (LTFs) 🔎
Waiting for a Break of Structure (BoS) for confirmation ✅
This method allows me to stay precise, disciplined, and aligned with the market narrative, rather than chasing price.
💡 My Motto:
"Capital management, discipline, and consistency in your trading edge."
A positive risk-to-reward ratio, paired with a high win rate, is the backbone of any solid trading plan 📈🔐
⚠️ Losses?
They’re part of the mathematical game of trading 🎲
They don’t define you — they’re necessary, they happen, and we move forward 📊➡️
🙏 I appreciate you taking the time to review my Daily Forecast.
Stay sharp, stay consistent, and protect your capital
— FRNGT 🚀
TVC:DXY

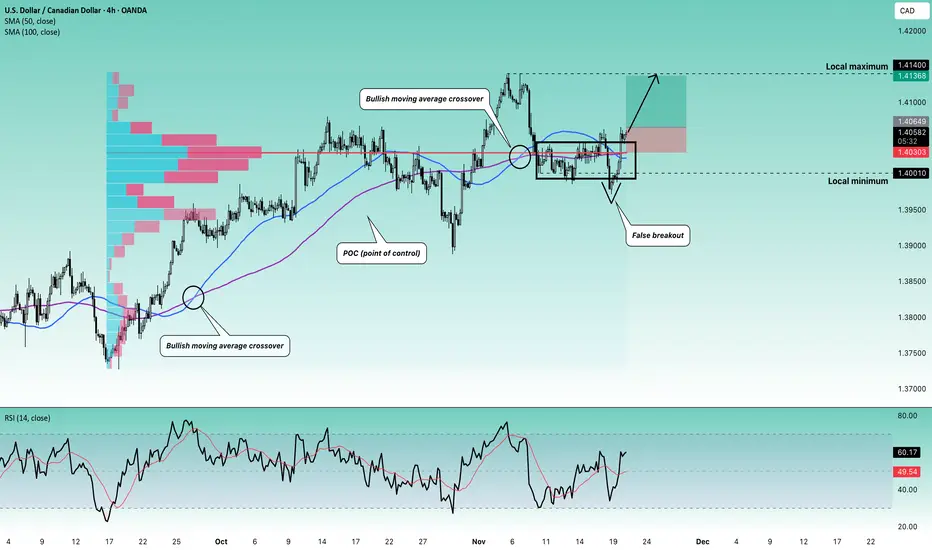
Stop!Loss|Market View: USDCAD🙌 Stop!Loss team welcomes you❗️
In this post, we're going to talk about the near-term outlook for the USDCAD currency pair☝️
Potential trade setup:
🔔Entry level: 1.40649
💰TP: 1.41368
⛔️SL: 1.40303
"Market View" - a brief analysis of trading instruments, covering the most important aspects of the FOREX market.
👇 In the comments 👇 you can type the trading instrument you'd like to analyze, and we'll talk about it in our next posts.
💬 Description: This currency pair was previously defined as a buy pair, and this one is proceeding exactly as per the previous analysis, with the buy priority remaining. Given the current context, namely, a breakout of the upper balance boundary above 1.40010, an additional, shorter-term buy trade can be considered with the same target as before, namely, near 1.41400.
Thanks for your support 🚀
Profits for all ✅
GBP/USD Could Test Key Support Before ReboundingHello everyone, looking at GBP/USD on the 1H timeframe, I can clearly see the market entering a phase of consolidation, where buyers are trying to maintain control but sellers still hold a slight advantage. The pair is trading around 1.3139, sitting close to the 1.3120–1.3100 support area—where strong buying pressure previously appeared. After the sharp bounce from 1.3080, the upward momentum stalled at 1.3180–1.3200, which aligns with a bearish FVG, signalling early exhaustion in the short-term structure. The series of small candles over the past few hours reflects accumulation, as if both sides are waiting for the right moment to strike.
Meanwhile, the macro backdrop favours the USD, with the probability of a Fed rate cut in December dropping sharply, strengthening the dollar and pressuring GBP. At the same time, the UK economy provides little support—weak GDP and slow inflation progress contribute to cautious sentiment surrounding the pound.
From what I’m observing, the most reasonable scenario is for GBP/USD to continue pulling back toward 1.3120–1.3100 to retest liquidity before seeing a potential rebound. This zone remains a technically significant support, where buyers previously entered with conviction. If bullish reaction reappears—shown by wick rejections or rising volume—I expect a recovery toward 1.3160–1.3180, and possibly 1.3220–1.3250 if aided by supportive news. Conversely, only a clean break below 1.3100 would open the door to deeper downside toward 1.3050. For now, this still looks like a corrective pullback—sometimes, a pullback is simply the market gathering strength before the next upward leg.
What do you think about this scenario?

GBP/USD Heading Towards Support Breakdown?Hello everyone, today we will analyze the GBP/USD pair in the context of the current market situation.
Regarding the news, the GBP is under significant pressure as data from the UK shows the unemployment rate has risen to 5% , raising concerns among investors about the economic situation and the possibility that the Bank of England (BoE) may have to cut interest rates in the near future. Additionally, the USD is strengthening, driven by the market's expectation that the Fed will maintain high interest rates, putting further downward pressure on GBP/USD.
Technically, the chart shows that GBP/USD is trading in an ascending channel . However, the price has failed to break through the important resistance level at 1.31800 in the most recent attempt. This suggests that buying pressure is weakening, and if this level cannot be breached, the downtrend may continue.
The strong support level currently lies at 1.31300. If the price breaks below this level, the pair could drop further, heading towards the next support zone at 1.31000. These are crucial levels that traders should watch in the coming hours.
In conclusion, with the current news and technical analysis, it is highly likely that GBP/USD will continue its downward trend in the next 24 hours, unless there are significant changes in policy or data from the BoE or Fed . Make sure to monitor the key support and resistance levels to make informed trading decisions. Good luck with your trades!

GBP/USD - Fundamental Ahead - UK Tax & Upcoming Budget The GBP/USD Pair, Price has been trading within a wedge Pattern on the H1 chart, forming consistent lower highs and lower lows. Price action is now testing the lower boundary of the pattern, signalling a possible breakdown. FPMARKETS:GBPUSD
✅Market Context:
1️⃣Downward structure building inside the pattern.
2️⃣Sellers are showing strength near support levels.
3️⃣Breakdown below the trendline indicates momentum continuation toward lower zones.
✅Trade Plan:
Entry: Sell after confirmed breakdown below the support (Candle close below trendline or retest of the breakout).
💰Take Profit (TP): At the Key Zone – major support area identified ahead.
🛑Stop Loss (SL): Above the pattern structure / recent swing high.
✅Psychological Discipline:
1️⃣Stick to plan – No Revenge Trades.
2️⃣Accept losing trades as part of the strategy.
3️⃣Risk only 1–2% of your account balance per trade.
✅ Support this analysis with a
LIKE 👍 | COMMENT 💬 | FOLLOW 🔔
It helps a lot & keeps the ideas coming!
⚠️ Disclaimer: This analysis is for educational purposes only and does not constitute financial advice. Forex trading involves high risk. Trade only with capital you can afford to lose and always do your own research.

GBPUSD Area to keep an eye forPrice is approaching the support zone for 4H and 1H. If the price breaks this zone, then there is a chance for the price to reach the 1D support zone.
However, price is likely to bounce off the 4H and 1H support zone, creating a double bottom which could send the price to break the next resistance zone, pushing it more to the upside.

GBPUSD A Fall Expected! SELL!
My dear friends,
GBPUSD looks like it will make a good move, and here are the details:
The market is trading on 1.3181 pivot level.
Bias - Bearish
Technical Indicators: Supper Trend generates a clear short signal while Pivot Point HL is currently determining the overall Bearish trend of the market.
Goal - 1.3152
About Used Indicators:
Pivot points are a great way to identify areas of support and resistance, but they work best when combined with other kinds of technical analysis
Disclosure: I am part of Trade Nation's Influencer program and receive a monthly fee for using their TradingView charts in my analysis.
———————————
WISH YOU ALL LUCK

GBP/USD - H1 - Trendline Breakout (19.11.2025)🧠 Setup Overview FX:GBPUSD
GBP/USD has broken below a long-term ascending trendline, followed by a clean retest rejection — a strong bearish confirmation signal.
Price also remains below the resistance zone (1.3180–1.3200) and is showing consistent lower highs, indicating sellers are gaining control.
With bearish fundamentals supporting USD strength, further downside pressure is expected.
📊 Trading Plan🔻 Sell Bias (Primary Scenario)
Look for bearish candles forming below the trendline retest
Target the next support levels
🎯 Targets:
1st Support: 1.3077
2nd Support: 1.3039
❌ Invalidation:
A break and close above 1.3200 (resistance zone) cancels the bearish view
⚡ Fundamental Outlook – Today (19 Nov 2025)
🇺🇸 USD Fundamentals
1️⃣ U.S. yields continue to climb as investors expect the Federal Reserve to maintain tight policy for longer due to sticky inflation.→ Higher yields → Stronger USD
2️⃣ Risk sentiment remains weak, with markets rotating into safe-haven assets, supporting USD strength.
🇬🇧 GBP Fundamentals
3️⃣ UK economy shows slowing momentum, and BoE policymakers remain cautious.
→ Weaker GBP outlook
➡️ Combined outlook favors a bearish continuation on GBP/USD.
#GBPUSD #Forex #TechnicalAnalysis #PriceAction #TrendlineBreak #BearishSetup #USD #GBP #ForexSignals #TradingView #KABHI_TA_TRADING #ChartsDontLieTradersDontQuit #FXMarket #SupportAndResistance #MarketBreakdown
⚠️ Disclaimer
This analysis is for educational purposes only.
Not financial advice — always confirm entries and manage your risk properly.
💬 Support My Work ❤️
If you find this helpful:👍 LIKE💬 COMMENT🔔 FOLLOW
Your support motivates me to post more daily trade setups!

GBP/USD - Triangle Breakout (18.11.2025)🧠 Setup Overview
GBP/USD has broken below the triangle structure, signaling a shift toward bearish momentum after repeated rejections from the upper trendline.
Price is sitting under the breakout region, indicating that sellers are gaining control.
With fundamentals supporting USD strength, the downside continuation scenario looks favorable.
📊 Trading Plan🔻 Primary Bias: Sell
Wait for a retest & rejection near the triangle support-turned-resistance
Look for continuation toward the lower support zones
🎯 Targets:
1st Support: 1.3091
2nd Support: 1.3062
#GBPUSD #Forex #TechnicalAnalysis #PriceAction #TriangleBreakout #BearishBias #USD #GBP #ForexSignals #TradingView #KABHI_TA_TRADING #ChartsDontLieTradersDontQuit #FXMarket #TrendlineBreak #SupportAndResistance
⚠️ Disclaimer
This analysis is for educational purposes only and does not constitute financial advice.
Always follow your confirmation signals and risk management rules before trading.
💬 Support My Work ❤️
If this analysis helps you: 👍 LIKE💬 COMMENT🔔 FOLLOW
Your support motivates me to post more clean and consistent chart breakdowns!

BUY GBPUSD (head and shoulders pattern formed)A head and shoulder pattern was recently formed on the GBPUSD paid indicating it is time for a major reversal to the upside. The price also broke through all the last resistance levels and has nowhere else to go to except the next resistance zone which is marked as the next take profit level. We will be buying GBPUSD NOW!

GBPUSD Retracement Idea for a new Lower HighHi Traders!
Since my last idea GU reached my short target around 1.30000. I'm now looking for price to retrace to a previous bearish BOS area around 1.32500-1.33000. If price can create a new lower high in that area we could possibly see more bearish movement. In addition, if DXY can hold around 99.000-99.500, and continue reversing to the upside I'd have a new swing target for GU at the next Daily OB around 1.29000-1.28500.
1st alert set just below 1.32500 in case price doesn't make it to my target.
*DISCLAIMER: I am not a financial advisor. The ideas and trades I take on my page are for educational and entertainment purposes only. I'm just showing you guys how I trade. Remember, trading of any kind involves risk. Your investments are solely your responsibility and not mine.*

$GBIRYY -U.K Inflation Rate (October/2025)ECONOMICS:GBIRYY 3.6%
October/2025
source: Office for National Statistics
- The UK’s annual inflation rate eased to 3.6% in October,
its lowest in four months, down from 3.8% in each of the previous three months.
The figure matched expectations from both the Bank of England and market analysts,
supported by a slowdown in gas and electricity prices.

GBPUSD - Expecting Bearish Continuation In the Short TermH4 - Strong bearish move.
No opposite signs.
Currently it looks like a pullback is happening.
Expecting bearish continuation until the two Fibonacci resistance zones hold.
If you enjoy this idea, don’t forget to LIKE 👍, FOLLOW ✅, SHARE 🙌, and COMMENT ✍! Drop your thoughts and charts below to keep the discussion going. Your support helps keep this content free and reach more people! 🚀
-------------------------------------------------------------------------------------------------------------------
