GBPUSD V DXY FRGNT Daily Forecast -Q4 | W45 | D4| Y25 |📅 Q4 | W45 | D4| Y25 |
📊 GBPUSD V DXY FRGNT Daily Forecast
🔍 Analysis Approach:
I’m applying Smart Money Concepts, focusing on:
Identifying Points of Interest on the Higher Time Frames (HTFs) 🕰️
Using those POIs to define a clear trading range 📐
Refining those zones on Lower Time Frames (LTFs) 🔎
Waiting for a Break of Structure (BoS) for confirmation ✅
This method allows me to stay precise, disciplined, and aligned with the market narrative, rather than chasing price.
💡 My Motto:
"Capital management, discipline, and consistency in your trading edge."
A positive risk-to-reward ratio, paired with a high win rate, is the backbone of any solid trading plan 📈🔐
⚠️ Losses?
They’re part of the mathematical game of trading 🎲
They don’t define you — they’re necessary, they happen, and we move forward 📊➡️
🙏 I appreciate you taking the time to review my Daily Forecast.
Stay sharp, stay consistent, and protect your capital
— FRNGT 🚀
FX:GBPUSD
Gbpusdanalysis

GBP/USD Price Outlook – Trade Setup📊 Technical Structure
FPMARKETS:GBPUSD GBP/USD has found a temporary floor near 1.3110–1.3120, aligning with the marked Support Zone (1.3107–1.3126). The pair remains in a corrective phase after weeks of sustained losses. Price is consolidating just above the support base, with a potential recovery target at 1.3204–1.3226, the next Resistance Zone.
From a structural standpoint, a rebound scenario remains plausible if 1.3110 holds, targeting 1.3200 first, then 1.3270. However, a decisive break below 1.3100 would resume the downtrend toward 1.3050 or lower.
🎯 Trade Setup
Entry: 1.3107– 1.3127 (support retest)
Stop Loss: 1.3102
Take Profit: 1.3204 / 1.3226
Risk-Reward Ratio: ≈ 1 : 4.43
🌐 Macro Background
Sterling steadies near 1.3150 after an extended losing streak, supported by profit-taking and oversold conditions, while traders await Thursday’s Bank of England (BoE) policy decision.
As FXStreet’s Joshua Gibson notes: “Cable found enough friction to hold off further declines as Pound traders await the BoE’s latest rate decision.” 【FXStreet】
US Side: The ISM Manufacturing PMI dropped to 48.7 in October (vs. 49.5 expected), signalling continued contraction in U.S. factory activity for an eighth consecutive month. However, the ongoing U.S. government shutdown is clouding data reliability and keeping USD sentiment mixed.
UK Side: The BoE is widely expected to keep rates unchanged with a 6–3 vote, though one additional vote for a rate cut would signal growing internal pressure for policy easing.
Inflation Context: UK headline inflation remains at 3.8% (August) — nearly double the BoE’s 2% target — limiting the central bank’s ability to ease aggressively.
Overall, with risk sentiment fragile and BoE caution expected, GBP/USD could see a corrective bounce, but upside remains capped unless the BoE adopts a notably hawkish tone.
🔑 Key Technical Levels
Resistance: 1.3204 – 1.3226
Support: 1.3107 – 1.3126
Psychological Level: 1.3150
📌 Trade Summary
GBP/USD remains weak but stable above 1.3120 support. The setup favours a technical rebound trade toward 1.3204–1.3226, supported by oversold conditions and market caution ahead of the BoE. A break below 1.3100, however, would invalidate this scenario and reopen the path toward 1.3050.
⚠️ Disclaimer
This analysis is for reference only and does not constitute trading advice. Trading involves significant risk, and proper risk management is essential.

GBPUSD: Liquidity Grab off 1.31000CRT suggests Pound/Dollar could drop further below 1.31000, however, is there enough bearish momentum to keep it dropping? With wicks to the bottom that Liquidity Grab could experience a pullback, maybe back towards the POI it created whilst dropping.

GBP/USD Under Pressure Ahead of BoE Meeting 🇬🇧The British pound ( FOREXCOM:GBPUSD ) is currently under pressure and is expected to experience high volatility ahead of the Bank of England (BoE) policy announcement on Thursday. Market expectations are divided regarding the possibility of an interest rate cut.
Key Pivot Level: 1.3161
The FOREXCOM:GBPUSD pair remains bearish (tending to fall) as long as the price is below the 1.3161 pivot level. Selling pressure is likely to persist until the BoE provides clarity on its policy direction.
🎯Bearish Scenario
If GBP/USD remains below 1.3161, the downtrend will continue with the following targets:
- Bearish Target 1: 1.3050
- Bearish Target 2: 1.3000 (Key psychological level)
- Bearish Target 3: 1.2922
🎯 Bullish Scenario
If GBP/USD successfully breaks through and maintains above 1.3162, a bullish recovery will begin with the following targets:
- Bullish Target 1: 1.3230
- Bullish Target 2: 1.3330 (Next major hurdle)
Stop Loss: Set the stop-loss (SL) 50-80 pips from the entry level.

SELL GBPUSD - Major support brokenGBPUSD has been heading in a clear downtrend for a while and has no signs of being bullish for a while! GBPUSD broke major support levels and also broke the powerful channel that it was stuck in between. There is nowhere left for GBPUSD to go except the next major support level (white line drawn) - SELL!

EURUSD and GBPUSD Analysis todayHello traders, this is a complete multiple timeframe analysis of this pair. We see could find significant trading opportunities as per analysis upon price action confirmation we may take this trade. Smash the like button if you find value in this analysis and drop a comment if you have any questions or let me know which pair to cover in my next analysis.

GBPUSD(20251103)Today's AnalysisMarket News:
Starting November 2nd, North America will begin observing winter time. Trading hours for financial markets in the US and Canada (gold, silver, crude oil, US stocks, etc.) and the release times of economic data will be delayed by one hour compared to summer time.
Technical Analysis:
Today's Buy/Sell Threshold:
1.3136
Support and Resistance Levels:
1.3202
1.3178
1.3161
1.3110
1.3094
1.3069
Trading Strategy:
If the price breaks above 1.3136, consider buying, with a first target price of 1.3161.
If the price breaks below 1.3110, consider selling, with a first target price of 1.3094.

GBPUSD: Bearish! Sell The Pullback To The Daily -FVG!Welcome back to the Weekly Forex Forecast for the week of Nov. 3 - 7th.
The GBPUSD is weak and just swept sell side LQ at relative equal lows. I expect a retracement higher from there... to the Daily -FVG. There, I will look for the formation of a -BOS, and short this market.
Enjoy!
May profits be upon you.
Leave any questions or comments in the comment section.
I appreciate any feedback from my viewers!
Like and/or subscribe if you want more accurate analysis.
Thank you so much!
Disclaimer:
I do not provide personal investment advice and I am not a qualified licensed investment advisor.
All information found here, including any ideas, opinions, views, predictions, forecasts, commentaries, suggestions, expressed or implied herein, are for informational, entertainment or educational purposes only and should not be construed as personal investment advice. While the information provided is believed to be accurate, it may include errors or inaccuracies.
I will not and cannot be held liable for any actions you take as a result of anything you read here.
Conduct your own due diligence, or consult a licensed financial advisor or broker before making any and all investment decisions. Any investments, trades, speculations, or decisions made on the basis of any information found on this channel, expressed or implied herein, are committed at your own risk, financial or otherwise.

Is the Cable Preparing for a Deeper Slide? GBP/USD Outlook🎯 GBP/USD "THE CABLE" - Cash Flow Heist Setup 🏴☠️💰
📊 Market Overview
The Cable is showing bearish momentum as we approach key resistance zones. This swing/day trade setup focuses on capturing downside movement with strategic risk management.
🔍 Trade Setup Details
Direction: 🐻 BEARISH
Entry Zone: FLEXIBLE - Multiple entry opportunities available at current price levels
Stop Loss: 🛡️ 1.35000 (Invalidation level - protect your capital!)
Target: 🎯 1.33300 (Strong support zone + oversold conditions)
📈 Technical Analysis
Key Observations:
Resistance Overhead: Price facing rejection at upper levels
Support Target: 1.33300 confluence zone with multiple factors:
Historical strong support
Oversold territory expected
Potential trap zone for late shorts
⚠️ Risk Management Note:
Fellow traders, these levels are MY analysis points. Your risk tolerance = Your rules. Adjust SL/TP based on YOUR account size and strategy. Lock profits along the way - don't get greedy! 💼
🌐 Related Pairs to Watch
Keep an eye on these correlated instruments:
EUR/USD - Euro strength/weakness impacts Cable
DXY (US Dollar Index) - Inverse correlation with GBP/USD
GBP/JPY - Confirms GBP momentum
EUR/GBP - Shows relative strength between pairs
💵 USD Pairs Correlation:
OANDA:AUDUSD - Risk sentiment gauge
OANDA:NZDUSD - Commodity currency correlation
FX:USDJPY - Safe haven flows indicator
Key Point: If DXY strengthens, expect additional downside pressure on Cable. Monitor EUR/USD for confirmation of USD strength vs. weakness in GBP specifically.
🎓 Strategy Notes
This is a "cash flow management" approach - meaning we're looking to capture liquidity moves and bank profits systematically. The setup combines:
✅ Technical levels
✅ Market structure
✅ Risk-reward optimization
✅ Exit strategy before reversal zones
Pro Tip: Consider scaling out at 1.33500 to secure partial profits before the final target!
✨ If you find value in my analysis, a 👍 and 🚀 boost is much appreciated — it helps me share more setups with the community!
#GBPUSD #TheCable #ForexTrading #SwingTrading #DayTrading #TechnicalAnalysis #ForexSignals #CashFlow #BearishSetup #PriceAction #SupportAndResistance #RiskManagement #ForexStrategy #DXY #CurrencyTrading #TradingIdeas #ForexCommunity #MarketAnalysis

GBPUSDGBPUSD needs push up this week to complete the structure, expect at least a 100 pips push up.
Disclosure: We are part of Trade Nation's Influencer program and receive a monthly fee for using their TradingView charts in our analysis.

GBP/USD 4H Analysis Based on the W Formation on the H4 Timeframe, I'd be looking for GBPUSD to pullback before breaking the structure high.

GBPUSD is in the Buying DirectionHello Traders
In This Chart GBPUSD HOURLY Forex Forecast By FOREX PLANET
today GBPUSD analysis 👆
🟢This Chart includes_ (GBPUSD market update)
🟢What is The Next Opportunity on GBPUSD Market
🟢how to Enter to the Valid Entry With Assurance Profit
This CHART is For Trader's that Want to Improve Their Technical Analysis Skills and Their Trading By Understanding How To Analyze The Market Using Multiple Timeframes and Understanding The Bigger Picture on the Charts

GBPUSD FRGNT Weekly Forecast - Q4 | W45 | Y25 |📅 Q4 | W45 | Y25 |
📊 GBPUSD FRGNT Weekly Forecast
🔍 Analysis Approach:
I’m applying Smart Money Concepts, focusing on:
Identifying Points of Interest on the Higher Time Frames (HTFs) 🕰️
Using those POIs to define a clear trading range 📐
Refining those zones on Lower Time Frames (LTFs) 🔎
Waiting for a Break of Structure (BoS) for confirmation ✅
This method allows me to stay precise, disciplined, and aligned with the market narrative, rather than chasing price.
💡 My Motto:
"Capital management, discipline, and consistency in your trading edge."
A positive risk-to-reward ratio, paired with a high win rate, is the backbone of any solid trading plan 📈🔐
⚠️ Losses?
They’re part of the mathematical game of trading 🎲
They don’t define you — they’re necessary, they happen, and we move forward 📊➡️
🙏 I appreciate you taking the time to review my Daily Forecast.
Stay sharp, stay consistent, and protect your capital
— FRNGT 🚀
FX:GBPUSD

GBP/USD Long from current price.GU Weekly Outlook
After a steady bearish run last week, GU has now entered a strong discounted demand zone that previously caused a break of structure to the upside. Price has already shown signs of Wyckoff accumulation and is now pushing toward the nearest supply zones.
I’ve marked two potential supply areas close by, but I suspect the first (8hr) supply may be violated as the premium one above looks stronger. My plan is to look for short-term buys up to that supply, then prepare for potential sell setups to continue the overall bearish trend.
Confluences:
- GU has been bearish, breaking structure to the downside
- Two nearby supply zones above current price
- Price currently in a strong demand zone, likely to cause a short-term correction
- Liquidity resting below waiting to be taken
- DXY showing bullish movement, aligning with this outlook
P.S. I wouldn’t be surprised if GU rallies from this demand zone toward the premium level around 1.32000 before continuing its downward move.

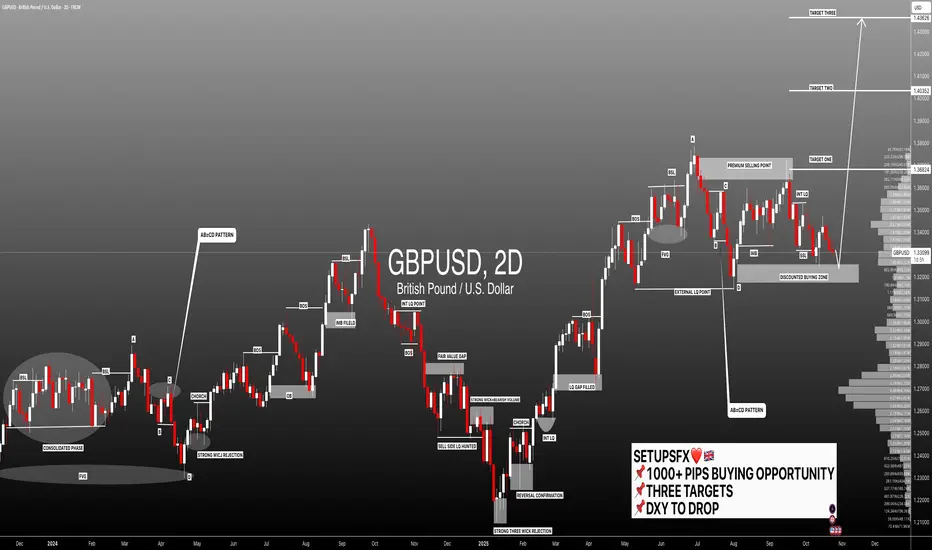
#GBPUSD:+1000 Pips Highly Probable Target! Agree with the idea? GBPUSD is currently trading at a highly probable point where we may see a strong bullish volume emerge in the market. This key level is only valid if the US dollar declines further, as a weak dollar will push our prices towards our target zones, helping us gain a higher risk-to-reward trade setup. Please like and comment on the ideas, even if you disagree. Sharing thoughts will help us all.
There are three major targets, and they accumulate to a +1000 pips trade setup. Set your take profit and stop loss based on your own analysis.
Team Setupsfx_
GBPUSD is ready to drop further.. time to sell!GBPUSD has been stuck inside a triangle patterned channel and struggled to break through from the upside and downside, however, it finally broke down below a major support zone which now highly indicates that the price will keep pushing down even further all the way down to the next major support zone (shown as the take profit level) .. This is a great time to sell!

GBPUSD FRGNT Daily Forecast -Q4 | W44 | D31| Y25 |📅 Q4 | W44 | D31| Y25 |
📊 GBPUSD FRGNT Daily Forecast
🔍 Analysis Approach:
I’m applying Smart Money Concepts, focusing on:
Identifying Points of Interest on the Higher Time Frames (HTFs) 🕰️
Using those POIs to define a clear trading range 📐
Refining those zones on Lower Time Frames (LTFs) 🔎
Waiting for a Break of Structure (BoS) for confirmation ✅
This method allows me to stay precise, disciplined, and aligned with the market narrative, rather than chasing price.
💡 My Motto:
"Capital management, discipline, and consistency in your trading edge."
A positive risk-to-reward ratio, paired with a high win rate, is the backbone of any solid trading plan 📈🔐
⚠️ Losses?
They’re part of the mathematical game of trading 🎲
They don’t define you — they’re necessary, they happen, and we move forward 📊➡️
🙏 I appreciate you taking the time to review my Daily Forecast.
Stay sharp, stay consistent, and protect your capital
— FRNGT 🚀
FX:GBPUSD

GBPUSD: Bearish From The -OB. Look For Valid Sells!Welcome back to the Weekly Forex Forecast for the week of Oct. 27 - 31st.
The GBPUSD traded up into the Supply Zone, then dropped from it, as forecasted last week. This week should see more bearish price action.
I like GBPUSD for shorts more than EURUSD, btw. Seems to be technically weaker.
FOMC on Wednesday, so be mindful of the volatility injection into the markets.
Enjoy!
May profits be upon you.
Leave any questions or comments in the comment section.
I appreciate any feedback from my viewers!
Like and/or subscribe if you want more accurate analysis.
Thank you so much!
Disclaimer:
I do not provide personal investment advice and I am not a qualified licensed investment advisor.
All information found here, including any ideas, opinions, views, predictions, forecasts, commentaries, suggestions, expressed or implied herein, are for informational, entertainment or educational purposes only and should not be construed as personal investment advice. While the information provided is believed to be accurate, it may include errors or inaccuracies.
I will not and cannot be held liable for any actions you take as a result of anything you read here.
Conduct your own due diligence, or consult a licensed financial advisor or broker before making any and all investment decisions. Any investments, trades, speculations, or decisions made on the basis of any information found on this channel, expressed or implied herein, are committed at your own risk, financial or otherwise.

DeGRAM | GBPUSD reached a strong support level📊 Technical Analysis
● GBP/USD is rebounding from the 1.3165 support zone inside a descending channel, indicating potential short-term recovery within the broader downtrend.
● A minor breakout above 1.3265 could trigger a corrective move toward 1.3360 resistance, aligning with the channel’s upper boundary.
💡 Fundamental Analysis
● Sterling gains modest support from stabilizing UK bond yields, while softer U.S. economic momentum tempers dollar strength.
✨ Summary
● Long bias above 1.3165; target 1.3360. Price recovery from key support signals potential medium-term correction.
-------------------
Share your opinion in the comments and support the idea with a like. Thanks for your support!

DeGRAM | GBPUSD keeps a descending structure📊 Technical Analysis
● GBP/USD remains confined within a descending channel, facing continuous rejections from dynamic resistance near 1.3360.
● The price structure shows lower highs and lower lows, pointing to sustained bearish momentum targeting the next key support at 1.3165.
💡 Fundamental Analysis
● The pound weakens amid softer UK macro data and BoE officials’ cautious tone, while stronger US economic performance supports the dollar.
✨ Summary
● Short bias below 1.3360; target zone 1.3165. Technical downtrend and macro divergence reinforce the medium-term bearish outlook.
-------------------
Share your opinion in the comments and support the idea with a like. Thanks for your support!

GBP/USD Price Outlook – Trade Setup📊 Technical Structure
FPMARKETS:GBPUSD GBP/USD rebounded from the 1.3140 support zone (lowest since May) and is consolidating above 1.3200. The pair faces overhead resistance near 1.3280–1.3300, which aligns with the descending trendline. A rejection here could trigger fresh downside, while sustained strength above 1.3300 would open the door to higher retracement gains.
🎯 Trade Setup
Entry: 1.3280 – 1.3300 (resistance retest)
Stop Loss: 1.3314
Take Profit: 1.3150 / 1.3140
Risk-Reward Ratio: ≈ 1 : 4.33
🌐 Macro Background
The pair bounced back above 1.3200 as the U.S. Dollar retreated from its post-FOMC highs. As FXStreet’s Haresh Menghani notes: “Spot prices climb back above the 1.3200 mark amid a modest USD weakness, though the fundamental backdrop warrants some caution for bullish traders.” 【FXStreet】
The Fed maintained a hawkish outlook, with Chair Powell pushing back against expectations of another December rate cut. This limits USD downside.
On the UK side, fiscal concerns remain a drag. Reports suggest the OBR will downgrade productivity forecasts, potentially widening the fiscal gap by £20 billion. Rising speculation of a 25 bps BoE rate cut in December (with odds at 68%) further undermines Sterling’s outlook.
🔑 Key Technical Levels
Resistance: 1.3280 – 1.3300
Support: 1.3150 – 1.3140
Psychological Level: 1.3200
📌 Trade Summary
GBP/USD trades above 1.3200 but upside is capped by resistance and macro headwinds. Short-term strategy favors selling rallies near 1.3280–1.3300, targeting 1.3150. A clear break below 1.3140 could confirm bearish continuation.
⚠️ Disclaimer
This analysis is for reference only and does not constitute trading advice. Trading involves significant risk, and proper risk management is essential.

GBP/USD: Pound Hits Its Lowest Level in the Last Three MonthsThe GBP/USD pair has posted two consecutive sessions of losses, maintaining a clear bearish bias and recording a decline of more than 1.2% against the British pound in the short term. Selling pressure has intensified following the U.S. Federal Reserve’s interest rate decision, where policymakers noted that an additional rate cut in December is not yet fully confirmed. This has triggered temporary demand for the U.S. dollar, causing the pound to lose ground. As long as this sentiment persists, downward pressure could continue to strengthen in the coming sessions.
A New Downtrend Emerges
Since late June, the GBP/USD pair has been recording progressively lower highs, suggesting the formation of a new bearish trendline. With the pound’s recent weakness, the price has even broken below the 200-period moving average, signaling a structural shift that could pave the way for a more pronounced selling trend in the short term. If bearish pressure remains steady, the descending trendline could become more aggressive, targeting levels not seen in several months.
RSI
The RSI line remains below the neutral 50 level, reflecting a dominance of bearish momentum over the past 14 sessions and a consistent selling bias. This behavior supports the potential for a sustained bearish trend in the short term. However, the indicator is gradually approaching the oversold area (around 30), which could signal a temporary imbalance caused by excessive selling pressure and open the door for technical corrections in the coming days.
MACD
The MACD histogram continues to show movements below the zero line, indicating that bearish momentum remains dominant in the average of the moving averages. If this downward trend continues, it could further strengthen selling pressure and reinforce a more dominant bearish bias in the next trading sessions.
Key Levels to Watch:
1.31825 – Current Barrier: A retracement zone that coincides with the 200-period simple moving average. This level could trigger short-term bullish corrections if the price fails to maintain consistent selling pressure below it.
1.34409 – Major Resistance: This level aligns with the 50-period simple moving average. A move back toward this zone could reactivate buying pressure, which might challenge the development of a stronger downtrend in the short term.
1.30125 – Crucial Support: A level not seen since March of this year. A break below this area could accelerate the bearish momentum and establish a dominant downward trend in the coming weeks.
Written by Julian Pineda, CFA – Market Analyst

GBP/USD Correction Almost Done: Bulls LoadingGBP/USD has already completed a big corrective structure from the previous high and is now moving inside a complex W-X-Y pattern. The current drop is forming the final C-wave of Wave Y, which suggests the bearish move is close to finishing. Price is likely to dip slightly lower near the support zone before finding buyers again. Once this final leg completes, the chart expects a strong bullish reversal to the upside. In simple terms, one more small drop to finish the correction, then GBP/USD should bounce and start a new uptrend.
Stay tuned!
@Money_Dictators
Thank you :)
