GBPUSD – Rebound Before the Next Leg DownIn my previous GBPUSD analysis, I pointed out that the pair could reverse sharply and head toward the 1.32 support zone.
That move has already begun: after reaching a high slightly above 1.37, the pair dropped aggressively into the 1.3335 interim support.
Currently, price is in the middle of a normal rebound, which I see as a potential setup for sellers rather than a change in trend.
Key Levels & Trading Plan:
• The sell zone is between 1.3460 – 1.3500, where I expect bears to regain control.
• My downside target remains 1.3200, in line with the broader bearish structure.
• Only a decisive break above 1.3500 would force me to re-evaluate this view.
For now, this rebound looks like an opportunity to rejoin the trend from better prices 🚀
Gbpusdanalysis

Q3 | W39 | D26 | Y25| -Fun Coupon Fri -GBPUSD Daily Forecast📅 Q3 | W39 | D26 | Y25|
📊 GBPUSD Daily Forecast
Fun Coupon Fri
🔍 Analysis Approach:
I’m applying Smart Money Concepts, focusing on:
Identifying Points of Interest on the Higher Time Frames (HTFs) 🕰️
Using those POIs to define a clear trading range 📐
Refining those zones on Lower Time Frames (LTFs) 🔎
Waiting for a Break of Structure (BoS) for confirmation ✅
This method allows me to stay precise, disciplined, and aligned with the market narrative, rather than chasing price.
💡 My Motto:
"Capital management, discipline, and consistency in your trading edge."
A positive risk-to-reward ratio, paired with a high win rate, is the backbone of any solid trading plan 📈🔐
⚠️ Losses?
They’re part of the mathematical game of trading 🎲
They don’t define you — they’re necessary, they happen, and we move forward 📊➡️
🙏 I appreciate you taking the time to review my Daily Forecast.
Stay sharp, stay consistent, and protect your capital
— FRNGT 🚀
FX:GBPUSD

GBPUSD(20250926)Today's AnalysisMarket News:
U.S. second-quarter GDP growth was significantly revised upward to 3.8%, a two-year high, compared to the previous reading of 3.3%. Initial jobless claims for the week ending September 20th reached 218,000, the lowest since the week ending July 19, 2025. The previous reading was revised from 231,000 to 232,000.
Technical Analysis:
Today's Buy/Sell Levels:
1.3377
Support and Resistance Levels:
1.3519
1.3466
1.3432
1.3323
1.3288
1.3235
Trading Strategy:
On a breakout above 1.3377, consider a buy entry, with the first target at 1.3432.
On a breakout below 1.3323, consider a sell entry, with the first target at 1.3288.

GBPUSD H4 OUTLOOK Gbpusd Selling Zones i Already Provided
FAIR VALUE GAP
ORDER BLOCK
ORDER BLOCK
CISD
TURTLE SOUP
Good Luck Guys

GBPUSD Bearish Breakout!HI,Traders !
#GBPUSD made a bearish
Breakout of the key horizontal
Level of 1.35704 and the
Breakout is confirmed so After
retesting the breached level
We are bearish biased and
We will be expecting a
Further bearish move down !
Comment and subscribe to help us grow !

GBPUSD Short Trade Plan – PRZ in Sight!Today I want to review a short setup on the GBPUSD ( FX:GBPUSD ) pair .
GBPUSD is currently near the Resistance zone($1.360-$1.351) and Support lines .
The question is, can GBPUSD break the Support lines!?
GBPUSD started to decline with a lot of momentum over the past week and this is a good sign for a break of the support lines .
According to Elliott Wave theory , GBPUSD appears to be completing microwave 4 , and given the bearish momentum , we can expect microwave 5 to break the support lines .
I expect GBPUSD to fall at least to the Potential Reversal Zone(PRZ) .
Stop Loss(SL): 1.3600 USD
Please respect each other's ideas and express them politely if you agree or disagree.
British Pound / U.S Dollar Analysis (GBPUSD), 4-hour time frame.
Be sure to follow the updated ideas.
Do not forget to put a Stop loss for your positions (For every position you want to open).
Please follow your strategy and updates; this is just my Idea, and I will gladly see your ideas in this post.
Please do not forget the ✅' like '✅ button 🙏😊 & Share it with your friends; thanks, and Trade safe.

Buy @ 1.3430 - 1.3440There’s a pullback today—we can go long directly now and wait for a rebound
Buy @ 1.3430 - 1.3440
TP 1.3480 - 1.3500 - 1.3540
Accurate signals are updated every day 📈 If you encounter any problems during trading, these signals can serve as your reliable guide 🧭 Feel free to refer to them! I sincerely hope they'll be of great help to you 🌟 👇

GBP/USD – Bearish Bias with USD Strength🔴 GBP Weakness: Ongoing UK economic struggles and inflation concerns weigh on the Pound.
💪 USD Strength: Strong US data, hawkish Fed, and rate hikes keep the Dollar strong.
🔑 Trade Setup:
Short GBP/USD at resistance zones 1.3487 – 1.3492.
Target: 1.34193 → 1.3400 as USD continues to outperform.
🚨 Risk: A surprise UK economic recovery or Fed dovish shift could trigger a reversal.
📊 Stay sharp, trade smart. 💡
Greetings,
MrYounity

GBP/USD 45m – Bearish Retracement to 1.34800–1.34970 1. Market Structure
Current bias: bearish.
After forming a high around 1.35300 – 1.35500, price broke structure (BOS) to the downside.
The descending red trendline confirms momentum remains bearish.
Recent CHoCH signals also align with bearish continuation.
2. Trade Scenarios
Scenario 1 (primary – bearish continuation):
Wait for price to retrace into 1.34800 – 1.34970 (Fib + FVG confluence).
Look for bearish confirmation to Sell.
Short-term TP: 1.34400 → Extended TP: 1.34000.
Scenario 2 (less likely – bullish breakout):
If price closes above 1.3500 (breaking 0.786 Fib + trendline), the short-term bias may flip bullish.
In that case, look for Buy opportunities targeting 1.35300 – 1.35500.
👉 Summary:
GBP/USD on the 45m timeframe is still biased toward bearish continuation. Best sell zone: 1.34800 – 1.34970. Targets: 1.34400 (conservative) and 1.34000 (extended).

DeGRAM | GBPUSD held the support level📊 Technical Analysis
● GBP/USD confirmed a breakout from the descending channel and rebounded from support at 1.3435, showing renewed bullish structure.
● Price action is consolidating upward within a rising wedge, eyeing resistance near 1.3490 as the next target.
💡 Fundamental Analysis
● Sterling sentiment improved as UK data showed resilience, while the dollar faces pressure from softer yields after recent Fed commentary.
✨ Summary
GBP/USD rebounded from 1.3435 support, confirming breakout momentum toward 1.3490. Near-term bullish bias holds above 1.3435 with upside potential.
-------------------
Share your opinion in the comments and support the idea with a like. Thanks for your support!

GBPUSD(20250925)Today's AnalysisMarket News:
Chicago Fed President Goolsbee, a voting member of the FOMC this year, warned against a series of rate cuts, stating that he remains concerned about inflation and is unwilling to support a rate cut at the next meeting. San Francisco Fed President Mary Daly, however, believes that slowing economic growth and labor force growth, coupled with lower-than-expected inflation, may warrant further rate cuts.
Technical Analysis:
Today's Buy/Sell Levels:
1.3465
Support and Resistance Levels:
1.3566
1.3528
1.3504
1.3427
1.3403
1.3365
Trading Strategy:
If the market breaks above 1.3465, consider a buy entry, with the first target at 1.3504.
If the market breaks below 1.3427, consider a sell entry, with the first target at 1.3403.

GBPUSD: Bearish Head and Shoulders Pattern Targeting Previous Lo📊 GBPUSD is currently forming a clear bearish Head and Shoulders pattern 🦅. This setup suggests potential continuation to the downside, with price already showing signs of being under pressure.
🔎 My immediate focus is on previous lows as logical downside targets, as highlighted on the chart 📉.
⚠️ Disclaimer: This analysis is for educational purposes only and not financial advice. Always apply proper risk management.

GBPUSD Analysis todayHello traders, this is a complete multiple timeframe analysis of this pair. We see could find significant trading opportunities as per analysis upon price action confirmation we may take this trade. Smash the like button if you find value in this analysis and drop a comment if you have any questions or let me know which pair to cover in my next analysis.

GBPUSD: A Bearish MSS Has Happened! Sell it!The -FVG gave a 2 a clean 2 candle rejection to the market.
The bearish market structure shift validates a bearish bias.
Time to go!
Sells are valid.
What do you think? Leave a comment.... and/or boost!

GBPUSD Daily Forecast UPDATE -Q3 | W39 | D24 | Y25|📅 Q3 | W39 | D24 | Y25|
📊 GBPUSD Daily Forecast Update
🔍 Analysis Approach:
I’m applying Smart Money Concepts, focusing on:
Identifying Points of Interest on the Higher Time Frames (HTFs) 🕰️
Using those POIs to define a clear trading range 📐
Refining those zones on Lower Time Frames (LTFs) 🔎
Waiting for a Break of Structure (BoS) for confirmation ✅
This method allows me to stay precise, disciplined, and aligned with the market narrative, rather than chasing price.
💡 My Motto:
"Capital management, discipline, and consistency in your trading edge."
A positive risk-to-reward ratio, paired with a high win rate, is the backbone of any solid trading plan 📈🔐
⚠️ Losses?
They’re part of the mathematical game of trading 🎲
They don’t define you — they’re necessary, they happen, and we move forward 📊➡️
🙏 I appreciate you taking the time to review my Daily Forecast.
Stay sharp, stay consistent, and protect your capital
— FRNGT 🚀
FX:GBPUSD

Is GBPUSD pulling back before the next BIG push UP ???- If buyers hold this support zone, price is expected to push up toward the next resistance (the top grey zone).
-FYI: Not Financial advice

GBPUSD Daily Forecast -Q3 | W39 | D24 | Y25|📅 Q3 | W39 | D24 | Y25|
📊 GBPUSD Daily Forecast
🔍 Analysis Approach:
I’m applying Smart Money Concepts, focusing on:
Identifying Points of Interest on the Higher Time Frames (HTFs) 🕰️
Using those POIs to define a clear trading range 📐
Refining those zones on Lower Time Frames (LTFs) 🔎
Waiting for a Break of Structure (BoS) for confirmation ✅
This method allows me to stay precise, disciplined, and aligned with the market narrative, rather than chasing price.
💡 My Motto:
"Capital management, discipline, and consistency in your trading edge."
A positive risk-to-reward ratio, paired with a high win rate, is the backbone of any solid trading plan 📈🔐
⚠️ Losses?
They’re part of the mathematical game of trading 🎲
They don’t define you — they’re necessary, they happen, and we move forward 📊➡️
🙏 I appreciate you taking the time to review my Daily Forecast.
Stay sharp, stay consistent, and protect your capital
— FRNGT 🚀
FX:GBPUSD

GBP/USD Price Outlook – Trade Setup 📊 Technical Structure
GBP/USD has pulled back from recent highs and is now trading just above 1.3500. The chart highlights a resistance zone near 1.3521–1.3529, where sellers are expected to remain active. Price action shows rejection at this zone, suggesting limited upside momentum. On the downside, the support zone sits near 1.3451–1.3457, which aligns with recent lows.
🎯 Trade Setup
Entry: 1.3521 (near resistance rejection)
Stop Loss: 1.3538 (above resistance zone)
Take Profit: 1.3457 (support zone)
Risk-to-Reward (R:R): ~1 : 4.14
🌐 Macro Background
The Pound faces pressure after UK September PMI data disappointed, with the Composite index falling to 51.0 from 53.5, signalling weakening economic momentum. Manufacturing PMI slid further into contraction territory, while Services PMI also declined, painting a softening growth picture. This adds to concerns about sluggish trade and worsening job losses.
Meanwhile, the Bank of England (BoE) remains cautious, holding rates steady at 4% but unlikely to pivot to cuts soon given sticky inflation near 3.8%. In contrast, the Federal Reserve’s Powell emphasized a slow and steady approach to rate cuts, signalling no urgency to ease aggressively, which lends support to the US Dollar. The upcoming US PCE inflation report will be a key driver — a hotter reading could strengthen USD further, while a softer report may limit downside.
Overall, the macroeconomic divergence favours USD strength over GBP in the short term, aligning with the bearish technical setup.
🗝️ Key Technical Levels
Resistance: 1.3521 / 1.3529
Support: 1.3451 / 1.3457
Psychological Level: 1.3500
📌 Trade Summary
GBP/USD remains under pressure as weak UK PMI data reinforces economic fragility while the Fed maintains a cautious stance, supporting USD. A short entry at resistance near 1.3521 with targets toward 1.3457 aligns both technical rejection and macro headwinds.
⚠️ Disclaimer
This analysis is for reference only and does not constitute trading advice. Trading involves significant risk, and proper risk management is essential.

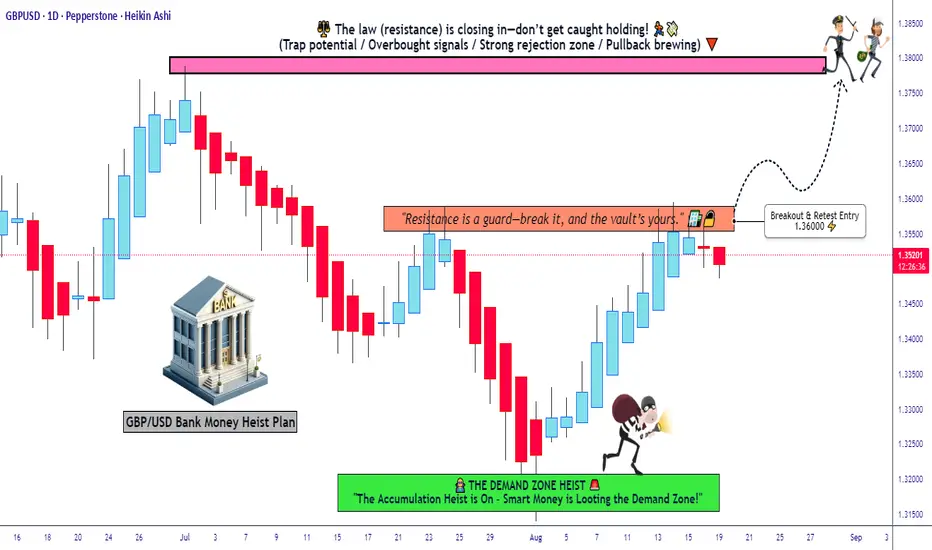
GBP/USD Cable Heist | Thief Robbery Layers – Big Escape🌍 Dear Ladies, Gentlemen & Thief OG’s 🕶️💰
The GBP/USD “Cable” Forex Market is about to face our next heist plan 🎭.
We thieves don’t rush – we wait for the perfect breakout strike ⚡.
🔑 Entry (The Break-In Point)
👉 The robbery starts only after breakout @1.36000 🚨
Once confirmed, our layer entry method gets activated:
1st Buy Limit Layer: 1.36000 🔑
2nd Buy Limit Layer: 1.35500 🗝️
3rd Buy Limit Layer: 1.35000 🕶️
(You can add more limit layers if the police delay their chase…) 🚔
Thief Strategy = Multiple layered pending orders (DCA style).
We don’t rob all at once – we stack layers & scale in like professionals 🏆
🛑 Stop Loss (The Thief Escape Hatch)
Thief SL placed at 1.34000 📍
But remember OG’s: always adjust SL based on your own risk & lot size.
Place SL only after breakout confirms 🚦
🎯 Target (Escape with the Money)
Police barricade spotted near 1.38000 🚔
So our escape target = 1.37500 💰💸
Grab the bag & vanish before the police close the roads! 🏃♂️💨
📢 Thief Reminder
⚡ Always set alerts for breakout confirmation
⚡ Never place orders before the breakout – patience = profit
⚡ Rob smart, escape smarter
💎 Support the Thief Trading Gang – hit that Boost Button 🚀
Every boost = stronger robbery crew 🤝💰
Stay tuned for the next heist blueprint 🕶️🎭
GBPUSD Recovered, But the Bearish Target Remains 1.32As I explained a few days back, GBPUSD reversed from resistance and confirmed the bearish case by breaking under the confluence support zone.
The market reached as low as 1.3450, before recovering part of the losses, with price currently hovering near the 1.3500 handle.
The key question now: is this just a corrective bounce, or the start of a deeper reversal?
From my perspective, the broader structure still favors the downside:
• The recent recovery looks corrective in nature, lacking strong bullish momentum.
• The previous confluence support is now acting as resistance.
• Macro factors and USD strength remain supportive of further GBP weakness.
As soon as this correction completes, I expect the bearish leg to resume, with 1.3200 remaining my downside target.
For traders, this means opportunities will likely appear on short setups after spikes into resistance, as long as 1.36 is not decisively reclaimed.

GBPUSD Daily Forecast - Q3 | W39 | D23 | Y25|📅 Q3 | W39 | D23 | Y25|
📊 GBPUSD Daily Forecast
🔍 Analysis Approach:
I’m applying Smart Money Concepts, focusing on:
Identifying Points of Interest on the Higher Time Frames (HTFs) 🕰️
Using those POIs to define a clear trading range 📐
Refining those zones on Lower Time Frames (LTFs) 🔎
Waiting for a Break of Structure (BoS) for confirmation ✅
This method allows me to stay precise, disciplined, and aligned with the market narrative, rather than chasing price.
💡 My Motto:
"Capital management, discipline, and consistency in your trading edge."
A positive risk-to-reward ratio, paired with a high win rate, is the backbone of any solid trading plan 📈🔐
⚠️ Losses?
They’re part of the mathematical game of trading 🎲
They don’t define you — they’re necessary, they happen, and we move forward 📊➡️
🙏 I appreciate you taking the time to review my Daily Forecast.
Stay sharp, stay consistent, and protect your capital
— FRNGT 🚀
FX:GBPUSD

GBPUSD(20250923)Today's AnalysisMarket News:
Federal Reserve Chairman Bostic: There is currently little reason to cut interest rates further, and only one rate cut is expected this year. Musallem: There is limited room for further rate cuts. If inflation risks increase, further rate cuts will not be supported. Hammak: We should be very cautious when lifting policy restrictions. My estimate of the neutral interest rate is on the higher side. Milan: I believe the appropriate interest rate is in the mid-2% range. I do not support adjusting the 2% inflation target at this time.
Technical Analysis:
Today's Buy/Sell Levels:
1.3493
Support and Resistance Levels:
1.3564
1.3538
1.3520
1.3466
1.3449
1.3422
Trading Strategy:
If the price breaks above 1.3520, consider entering a buy/sell position, with the first target at 1.3538.
If the price breaks below 1.3493, consider entering a sell position, with the first target at 1.3466

Q3 | W39 | D22 | Y25| -GBPUSD Daily Forecast📅 Q3 | W39 | D22 | Y25|
📊 GBPUSD Daily Forecast
🔍 Analysis Approach:
I’m applying Smart Money Concepts, focusing on:
Identifying Points of Interest on the Higher Time Frames (HTFs) 🕰️
Using those POIs to define a clear trading range 📐
Refining those zones on Lower Time Frames (LTFs) 🔎
Waiting for a Break of Structure (BoS) for confirmation ✅
This method allows me to stay precise, disciplined, and aligned with the market narrative, rather than chasing price.
💡 My Motto:
"Capital management, discipline, and consistency in your trading edge."
A positive risk-to-reward ratio, paired with a high win rate, is the backbone of any solid trading plan 📈🔐
⚠️ Losses?
They’re part of the mathematical game of trading 🎲
They don’t define you — they’re necessary, they happen, and we move forward 📊➡️
🙏 I appreciate you taking the time to review my Daily Forecast.
Stay sharp, stay consistent, and protect your capital
— FRNGT 🚀
FX:GBPUSD
