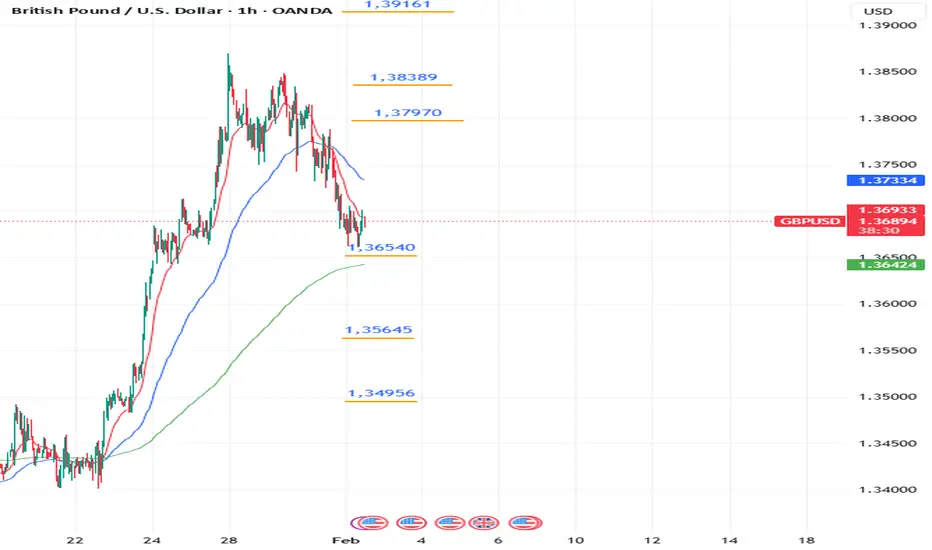
Coinranger|GBPUSD. Potential return to growth🔹DXY has made its first wave up. The potential of a move is still up to 97.43, but we could already be starting to reverse.
🔹Manufacturing PMI (18:00 UTC+3) and budget funding vote today
🔹The earnings season continues in the US
Levels:
Above
1.39161 - first upward extension
1.38389 - full set up
1.37970 - first upward wave
Below
1.36540 - full set down
1.35645 - first downward extension
1.34956 - second downward extension
The situation is still unclear. While the PMI most likely will influence the trend, it's difficult to say how the pice will react on the vote. Let's watch the US session.
---------------
Share your thoughts in the comments!
Gbpusdforecast
GBPUSD — FRGNT DAILY FORECAST Q1 | D3 | W5 | Y26
📅 Q1 | D3 | W5 | Y26
📊 GBPUSD — FRGNT DAILY FORECAST
🔍 Analysis Approach
I’m applying a developed version of Smart Money Concepts, with a structured focus on:
• Identifying Key Points of Interest (POIs) on Higher Time Frames (HTFs) 🕰️
• Using those POIs to define a clear and controlled trading range 📐
• Refining those zones on Lower Time Frames (LTFs) 🔎
• Waiting for a Break of Structure (BoS) as confirmation ✅
This process keeps me precise, disciplined, and aligned with market narrative, rather than reacting emotionally or chasing price.
💡 My Motto
“Capital management, discipline, and consistency in your trading edge.”
A positive risk-to-reward ratio, combined with a high-probability execution model, is the backbone of any sustainable trading plan 📈🔐
⚠️ On Losses
Losses are part of the mathematical reality of trading 🎲
They don’t define you — they are necessary, expected, and managed.
We acknowledge them, learn, and move forward 📊➡️
🙏 I appreciate you taking the time to review my Daily Forecast.
Further context and supporting material can be found in the Links section.
Stay sharp 🧠
Stay consistent 🎯
Protect your capital 🔐
— FRGNT 🚀📈
FX:GBPUSD

GBPUSD ShortThe previous trading session we had a weak Dollar Currency and this juggernaut every pair against the dollar, only for now and short term; I can see a pullback happening as the dollar will be doing some recovery for the previous big move. The MACD also showing and signaling momentum to the downside at least for now. FPMARKETS:GBPUSD

Coinranger|GBPUSD. Uncertainty at 1.37953🔹DXY has completed a full set of downward extensions on h1. Ideally, it should pullback, but its size is still uncertain. We could continue to fall.
🔹Today at 22 UTC+3 is the Fed rate. At 22:30 UTC+3 is the FOMC press conference. The rate is expected to remain at the same level as before - 3.75%.
🔹It's earnings season in the US.
Levels:
Above
1.38405 - the full set up on h1
1.38942 - the first extension on h1
Below
1.36119 - a potential downward pullback if we don't hold at current levels soon or don't go up.
Like the euro, small M5/M15 waves are emerging (small on the GBP scale) now. A continuation of the movement or a reversal is possible in the near future. We'll be able to say something specific after the rate decision.
---------------
Share your opinion in the comments!

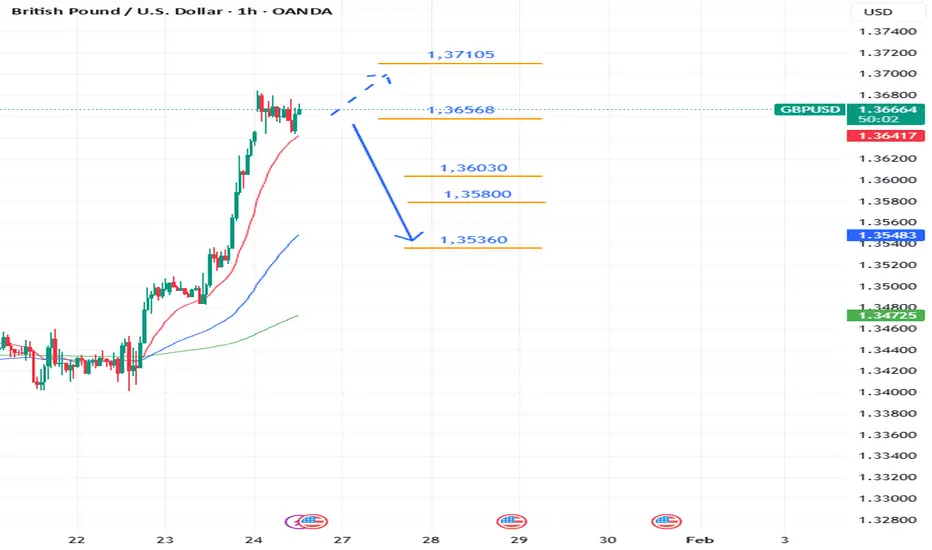
Coinranger|GBPUSD. Potential for a decline to 1.35800🔹DXY fell even more overnight than on Friday. It could go even lower, but it's unlikely to reverse.
🔹No interesting news for the pound today.
🔹Earnings season is starting in the US, but there's nothing particularly interesting there today.
Current levels:
Below:
Preliminary downward wave set on M15
1.36030
1.35800
1.35360
Above:
1.36568 - the end of the upward wave set
1.37105 - the end of the first upward extension (we may finish it off)
After a significant rise, we'll likely correct today, most likely to 1.35800
-------------------
Share your thoughts in the comments!
GBPUSD bouncing off the key orderblcokGBPUSD upon creating the order block price has just rejected off the key level. Upon formation of double bottom at price level 1.3400 price bounced off the order block with cross over 20ema and 10ema.
THe current 4h candlestick is closed with a wick passed 3 sessions low candle closed above the key level giving a higher probability of uptrend continuation.

Coinranger|GBPUSD. Uncertainty around 1.34730. Continued🔹Yesterday, the DXY failed to achieve a reversal, and today there's nothing left to do one.
🔹Today at 12:30 UTC+3, preliminary UK manufacturing and services PMI. Davos continues.
Levels:
Below:
These are still holding, will reassess them by Monday.
1.34113 or 1.33930 - first potential wave down
1.33637 - a full set down
1.33106 - first downside extension
Above:
1.35269 - this is the first extension of the wave set from above. We're almost certainly taking it.
1.35671 - this is the second extension for the set from above. This one is potential, but I leave it here.
-------------------
Share your thoughts in the comments!

Coinranger| GBPUSD. Uncertainty around 1.34730🔹DXY has finally decided to fall and has already reached the potential pullback area of 98.3. A non-pullback downside to 98.1 is still possible. We'll have to see what happens next.
🔹Davos continues.
🔹The pound has completed a full set of upward waves during the DXY decline. It could also begin to decline again, but more on that below.
Level:
Below:
The levels are tentatively calculated; it's difficult to say more precisely until the uptrend is complete.
1.34350 - first potential downward wave
1.34083 - full downward set
1.33590 - first downward set extension
Above:
1.35269 - this is the first extension of the upward wave set. Whether we come there depends heavily on the DXY's performance.
Both the dollar and the pound are at important levels, but there's no clear direction at the moment. We're keeping an eye on the DXY.
-------------------
Share your thoughts in the comments.

Coinranger| GBPUSD: Pullback and fall to 1.33237🔹The DXY has faded a bit in its rise, but there's no clear indication of a significant reversal on the elder timeframes yet. So, it's very likely that after the pullback is realized, we'll continue to rise to the 99.23 area and higher, to 99.44.
🔹No news today, except for the International Economic Forum in Davos.
🔹The pound reached its second extension on h1, so the rally on the pullback was (or still may be) aggressive. But overall, we're continuing to decline.
Levels:
Below:
1.33626 - a full set of downward waves
1.33406 - first extension
1.33237 - second extension
Above:
1.34300 - possible continuation of the pullback, but no guarantees. We'll watch the DXY here.
The overall sentiment is still down. We're keeping an eye on DXY
-------------------
Share your thoughts in the comments

GBPUSD possible sell areaGBPUSD has breaken the daily spport with possible further downside move in this market.The daily candle closed just below recent support level with a complete break of strucure and price is currently retesting the previous support as resistance.
With a possible break of trend line above price level 1.3445 is high probability sell area.

GBPUSD resume uptrend?GBPUSD has got rejected off the daily order block with multipel liquidity sweep on the daily support level.
4H timeframe has crossed over 20ema and 10ema with multiple rejection off the key support level.
Daily down move previous week that was a full breakdown to daily order block which is a signal of potential rejection fromt he support level.
Therefore it is high probability price may continue to rise upto the daily resistance level.

GBPUSD Analysis todayHello traders, this is a complete multiple timeframe analysis of this pair. We see could find significant trading opportunities as per analysis upon price action confirmation we may take this trade. Smash the like button if you find value in this analysis and drop a comment if you have any questions or let me know which pair to cover in my next analysis.

GBPUSD is in demand area!GBPUSD with daily massive bullish engulfting pattern crossing 20ema, GBPUSD is dropping to key level of support where price may have a higher chance of bouncing back to resistance level.
The major trend is up, with continued series of higher low, market structure is still bullish.
Crossing below 1.3414 with a larger ATR candlestick pattern is a high probably bullish setup.

GBPUSD possible bullish for 1.3420#gbpusd 5th November daily inside candle/bar, confined range within the previous candle/bar range. 6th November daily insurance candle. formed morning start pattern on daily three candles 4th, 5th & 6th novemver daily candles. weekly chart is also forming higher high and higher low. 1.3218-1.3179 daily demand zone for another bullish move. split risk into two positions equally at 1.3218 & 1.3182 with stop loss: 1.3165. target: 1.3420

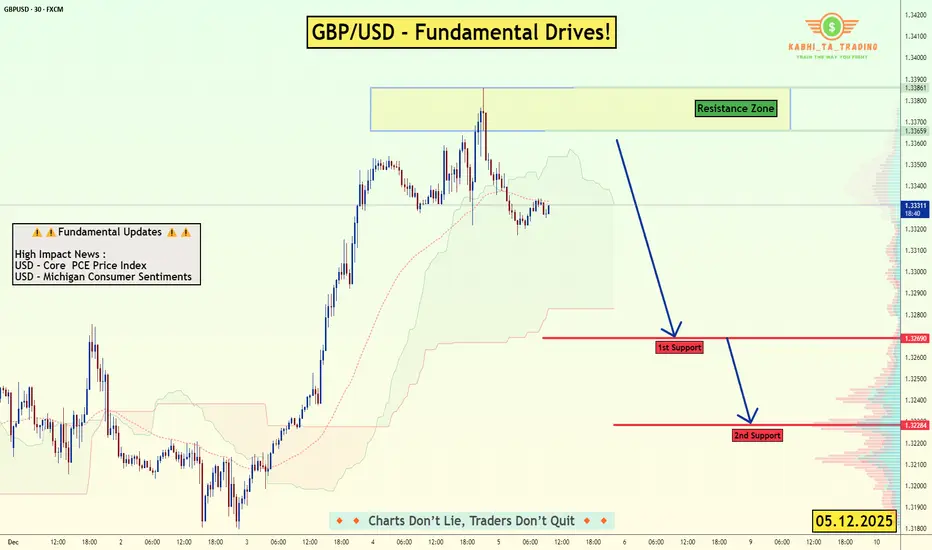
GBP/USD – Fundamentals Drive the Move! (05.12.2025)📝 Description FX:GBPUSD
GBP/USD is currently trading below the resistance zone after failing to hold recent bullish momentum. With USD Core PCE Price Index and Michigan Consumer Sentiment releasing today, the pair may see increased volatility, potentially pushing the price lower if USD strengthens.
A rejection from the resistance zone combined with weakening intraday structure suggests a possible bearish continuation toward support levels.
📌 Key Support & Resistance Levels
🔺 Resistance Zone: 1.3359 – 1.3386
🟥 1st Support: 1.3269
🟥 2nd Support: 1.3228
⚠️ Fundamentals Today
1️⃣ USD – Core PCE Price Index (High Impact)
2️⃣ USD – Michigan Consumer Sentiment (High Impact)
#GBPUSD #ForexAnalysis #PriceAction #Fundamentals #USDNews #TechnicalAnalysis #TradingPlan #ChartAnalysis #FXTrading #TradingView #Kabhi_TA_Trading
⚠️ Disclaimer
This chart is for educational purposes only, not financial advice.
Always use stop-loss and manage position size according to your risk tolerance.
👍 Support the Analysis❤️ Please LIKE💬 Drop a COMMENT
🔁 SHARE if you found this helpful!
GBPUSD possible bearish for 1.3100 wait for correction @GBPUSD daily chart forming lower low and lower high which is indication of bearish trend. Price broke and closed below 1.3141 which is month support level of the month of August. wait for price to pullback with low volume to test supply zone for another lower wave. sell limit 1.3345-50. stop loss: 1.3380, target: 1.3100

GBP.USD Breakdown for the 2nd week of NovGU Weekly Outlook
My analysis this week for GU is focused on where this current bullish move could take us next.
- Scenario (A):
If price retraces back to the 12hr demand zone, I’ll be looking for potential bullish reactions from that POI — ideally waiting for a Wyckoff accumulation to form before taking any buys.
- Scenario (B):
If price continues pushing higher, I’ll watch how it reacts at the nearby supply zone. A rejection there could trigger a short-term pullback back towards demand, giving us another chance to buy from a better position.
Either way, we’ll see which POI gets tapped first and adapt from there. Let’s have a great trading week and catch those pips! 💪📈

GBPUSD melting for possible rate cut?Goldman Sachs to revise its forecast and project a likely 25bp cut now is more high probable? as previous decision due to hold the rate due to 2 weeks earlier inflation data has, increased in probablity to cut despite inflation.
Techincal chart with GBPUSD is relecting the possible move in 24 hours few high impact news based on BOE.
As the market is in stong downtrend, price potentially contine to drop to long term support level and sell entry upon price action confrimation is high probable.

EURUSD and GBPUSD Analysis todayHello traders, this is a complete multiple timeframe analysis of this pair. We see could find significant trading opportunities as per analysis upon price action confirmation we may take this trade. Smash the like button if you find value in this analysis and drop a comment if you have any questions or let me know which pair to cover in my next analysis.

GBP/USD Long from current price.GU Weekly Outlook
After a steady bearish run last week, GU has now entered a strong discounted demand zone that previously caused a break of structure to the upside. Price has already shown signs of Wyckoff accumulation and is now pushing toward the nearest supply zones.
I’ve marked two potential supply areas close by, but I suspect the first (8hr) supply may be violated as the premium one above looks stronger. My plan is to look for short-term buys up to that supply, then prepare for potential sell setups to continue the overall bearish trend.
Confluences:
- GU has been bearish, breaking structure to the downside
- Two nearby supply zones above current price
- Price currently in a strong demand zone, likely to cause a short-term correction
- Liquidity resting below waiting to be taken
- DXY showing bullish movement, aligning with this outlook
P.S. I wouldn’t be surprised if GU rallies from this demand zone toward the premium level around 1.32000 before continuing its downward move.

GBP/USD Bullish Setup Above 1.3371FenzoFx—GBP/USD is trading in the previous week's range while defending the bullish fair value gap from October 14. The price is yet below the 20-period SMA, despite the oversold signal by stochastic and the impulsive upside momentum yesterday.
From a technical perspective, GBP/USD can potentially aim for the weekly highs at 1.3471. However, for this scenario to unfold, the price must close above the 1.3371 immediate resistance. Furthermore, for the bullish outlook to remain valid, the mean threshold of the 4H fair value gap must remain intact.

GBPUSD possible bullish for 1.34351st August formed a daily key reversal bar, made a new low closed towards the high. Daily demand zone range 1.3243-3145. Discount level of the zone 1.3200. Stop loss: 1.3125 split your risk into two position with 0.5% risk each. first order at 1.3200, 2nd order from 1.3145. target: 1.3435.

GBPUSD possible bearish for 1.3360 & 1.3300#gbpusd tested monthly support level of this month 1.3333 in last week and then in moving in corrective wave as pullback. 1.3510-3536 is supply zone for another downside leg move. stop loss may set as 1.3550-55. target: 1.3360 & 1.3300.
