GBP/USD Price Outlook – Trade Setup📊 Technical Structure
FPMARKETS:GBPUSD GBP/USD remains under short-term pressure after failing to sustain gains above the 1.3643–1.3652 resistance zone.
Price has now retraced back toward the 1.3600–1.3610 support area, which aligns with prior demand and short-term structure support.
The pair is currently trading below the resistance band and showing lower highs on the intraday chart, suggesting fading bullish momentum.
As long as price stays below 1.3650, the short-term bias remains mildly bearish.
🎯 Trade Setup (Bearish Bias)
Entry Zone: 1.3643 – 1.3652
Stop Loss: 1.3655
Take Profit 1: 1.3610
Take Profit 2: 1.3600
Extended Target: 1.3585
Risk–Reward Ratio: Approx. 1:3.15
📌 Invalidation:
A sustained break above 1.3655 would invalidate the bearish structure and shift momentum back to the upside.
🌐 Macro Background
The British Pound remains pressured after softer UK Q4 GDP data.
Q4 GDP QoQ: 0.1% (vs 0.2% expected)
Industrial & Manufacturing Production also disappointed
This reinforces expectations of a Bank of England rate cut in March, weighing on GBP.
Meanwhile, strong US Nonfarm Payrolls data reduced expectations for a March Fed rate cut, supporting the US Dollar.
However, markets still price in at least two Fed cuts later in 2026, which may limit aggressive USD upside.
Traders now focus on US Initial Jobless Claims and Friday’s US CPI report for further direction.
🔑 Key Technical Levels
Resistance Zone: 1.3643 – 1.3652
Support Zone: 1.3601 – 1.3612
Breakdown Level: Below 1.3601
Upside Invalidation Level: Above 1.3655
📌 Trade Summary
GBP/USD is trading below resistance with weakening momentum.
Preferred strategy: Sell rallies below 1.3655, targeting a retest of 1.3600 support, while staying cautious ahead of US CPI.
⚠️ Disclaimer
This analysis is for reference only and does not constitute trading advice. Financial markets involve significant risk; proper risk and position management are essential.
Gbpusdsell

GBPUSD: Bearish Drop to 1.334?FX:GBPUSD is eyeing a bearish reversal on the 4-hour chart , with price testing resistance after recent highs in an upward trendline from June 2025, converging with a potential entry zone that could spark downside momentum if sellers defend amid volatility. This setup suggests a pullback opportunity post-rally, targeting lower support levels with more than 1:2 risk-reward .🔥
Entry between 1.3566–1.3586 for a short position. Target at 1.3341 . Set a stop loss at a close above 1.3664 , yielding a risk-reward ratio of more than 1:2 . Monitor for confirmation via a bearish candle close below entry with rising volume, leveraging the pair's dynamics near resistance.🌟
Fundamentally , GBPUSD is trading around 1.357 in early February 2026, with key events this week. For the US Dollar, Nonfarm Payrolls (Jan, forecast 50K) on February 6 at 1:30 PM UTC, the week's highlight—weak data could favor GBP upside. 💡
📝 Trade Setup
🎯 Entry (Short):
1.3566 – 1.3586
(Entry from current price is valid with proper risk & position sizing.)
🎯 Target:
• 1.3341
❌ Stop Loss:
• Close above 1.3664
⚖️ Risk-to-Reward:
• > 1:2
💡 Your view?
Is this the start of a healthy pullback toward 1.3340, or will GBP bulls push through resistance and extend the rally? 👇

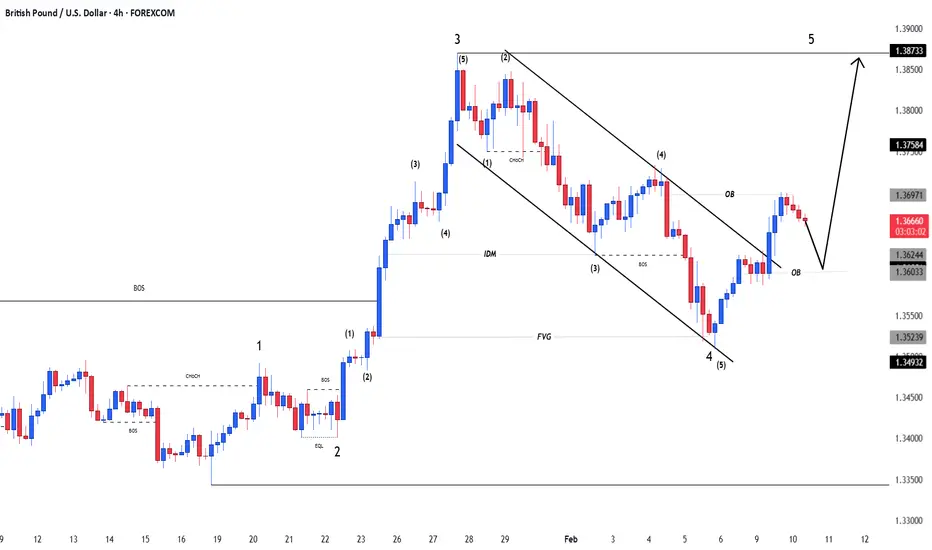
GBPUSDGBPUSD
- Bearish Channel as an corrective pattern in Short Time Frame
- IDM
- Fair Value Gap
- Completed " 1234 " Impulsive Waves
- Order Block
GBPUSD: Intraday Trading Idea Possible Sell Worth 250+ PipsDear Traders,
I hope you’re doing well. We’re seeing strong selling pressure at the current price range and believe the price could drop around 1.3500, a 250+ pip move. We’re waiting for a strong bearish candle to close to confirm the bearish drop.
If you like our work, please like and comment. Follow us for more.
Team Setupsfx_

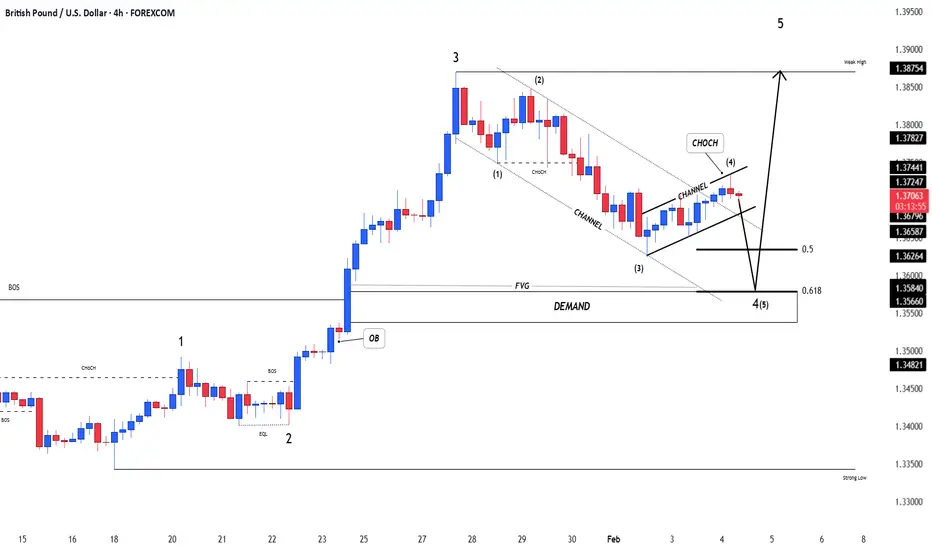
GBPUSDGBPUSD
- Fair Value Gap
- Bullish Channel as an corrective pattern in Short Time Frame and Bearish Channel in Long Time Frame
- Demand Zone
- Fibonacci Level - 50.00% / 61.80%
- Completed " 123 " Impulsive Waves
GBP/USD Gave Fake Breakout , Short Setup Valid To Get 200 Pips !Here is my 1H Chart on GBP/USD , We Have A Fake Breakout and then the price Back below my old res and we have a very good bearish Price Action on 1 And 2 Hours T.F Also the price playing very good around my res and i`m waiting the price to retest the broken area and giving a good bearish price action For the second time on smaller time frames to can get a confirmation to enter , So i see it`s a good chance to sell this pair if it go up a little to retest the broken area and then we can sell it and targeting 100 to 150 pips . and if we have a daily closure again above my new res then this idea will not be valid anymore .
Reasons To Enter :
1- Perfect Breakout .
2- Clear Bearish Price Action .
3- Bigger T.F Giving Good Bearish P.A .
4 - Perfect 15 Mins Closure .
5- The Price Respect The Res Again .

TheGrove | GBPUSD BUY | Idea Trading AnalysisGBPUSD is moving in an UP and broke Support line
The chart broke through the dynamic Support line and we expect a decline in the channel after testing the current level which suggests that the price will continue to rise
We expect a decline in the channel after testing the current level
Hello Traders, here is the full analysis.
I think we can soon see more fall from this range! GOOD LUCK! Great BUY opportunity GBPUSD
I still did my best and this is the most likely count for me at the moment.
-------------------
Traders, if you liked this idea or if you have your own opinion about it, write in the comments. I will be glad ⚜️
GBPUSD Supply Zone Reaction – Expect Further DropGBPUSD – 30M Analysis (Bearish Bias)
Strong bullish move exhausted: Price rallied aggressively and is now showing signs of weakness near the top.
Clear rejection from supply zone: Multiple candles failed to hold above the marked resistance → seller dominance confirmed.
Lower high formation: Momentum is shifting from bullish to bearish continuation.
Key support broken / being tested: The marked horizontal zone around 1.3480 is acting as the first breakdown level.
Ichimoku cloud support below: Price moving toward the cloud increases the probability of a deeper pullback.
Sell Scenario
Sell below: 1.3480 (confirmed breakdown)
Target 1: 1.3440
Target 2: 1.3410
Invalidation: Strong candle close back above 1.3520
Market Structure Bias
➡️ Short-term trend: Bearish correction
➡️ Overall structure: Bullish → Pullback phase

GBP/USD Price Outlook – Trade Setup📊 Technical Structure
FPMARKETS:GBPUSD GBP/USD is showing signs of a short-term bearish reversal after being rejected from the 1.3501–1.3506 resistance zone. The recent failure to sustain gains above this resistance has triggered a pullback, indicating weakening bullish momentum.
Price action suggests a corrective move lower is unfolding. As long as GBP/USD remains capped below the resistance zone, the near-term structure favors a continuation toward the 1.3469–1.3472 support zone, which coincides with the lower boundary of the channel and a key demand area.
🎯 Trade Setup (Bearish Bias)
Entry Zone: 1.3501 – 1.3506
Stop Loss: 1.3511
Take Profit 1: 1.3472
Take Profit 2: 1.3469
Risk–Reward Ratio: Approx. 1 : 2.93
📌 Invalidation
A sustained break and close above 1.3511 would invalidate the bearish setup and signal a resumption of the broader bullish trend.
🌐 Macro Background
Despite the upside surprise in UK Retail Sales, which rose 0.4% MoM in December versus expectations of a -0.1% decline, GBP/USD has struggled to extend gains and is showing signs of exhaustion near resistance.
Broader market sentiment remains cautious as investors digest geopolitical developments linked to President Trump’s trade stance and Greenland ambitions, which continue to inject uncertainty into risk markets.
On the US side, the Dollar has stabilized modestly after recent weakness, as expectations of aggressive near-term Fed easing have been pushed back. This macro backdrop supports a near-term corrective pullback in GBP/USD rather than an immediate continuation higher.
🔑 Key Technical Levels
Resistance Zone: 1.3501 – 1.3506
Support Zone: 1.3469 – 1.3472
Bearish Invalidation: Above 1.3511
📌 Trade Summary
GBP/USD has been rejected from a key resistance zone and is showing signs of short-term distribution. As long as price remains below 1.3501–1.3506, the bias favours a sell-on-rallies approach, targeting a pullback toward the 1.3472–1.3469 support region.
⚠️ Disclaimer
This analysis is for reference only and does not constitute trading advice. Financial markets involve significant risk; proper risk and position management are essential.
#GBP/USD Sell Trade Scenario.Here’s an up-to-date GBP/USD Sell trade outlook (technical + fundamental) to help you assess whether positioning for a Downside makes sense right now.
Thank You......

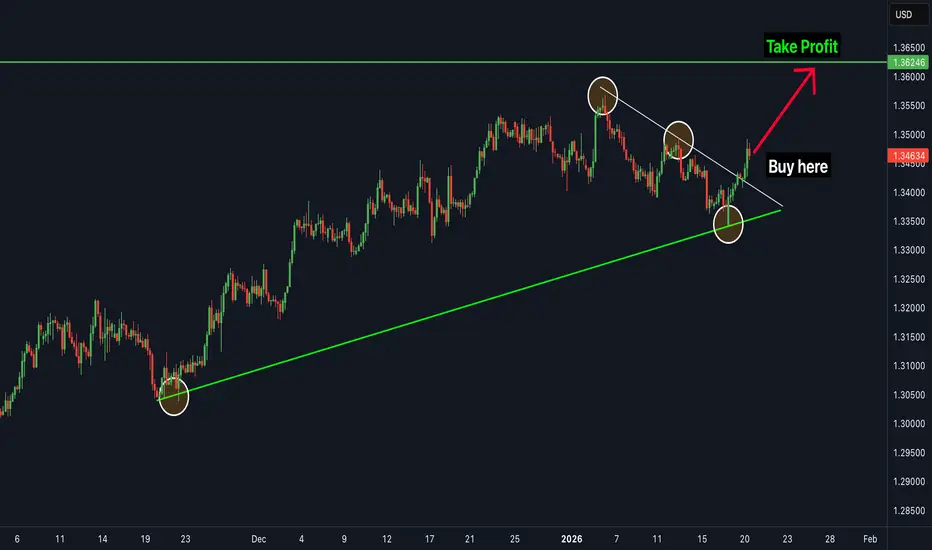
Time to buy GBPUSD nowGBPUSD was in a recent downtrend for the last few weeks and struggled to stay bullish, but recently it has just broken a strong resistance trend line which it tested several times and failed to break through. GBPUSD is very likely to hit the next major resistance zone which is marked as the "TAKE PROFIT" LEVEL. There are many clear signs of new bullish movements. Buy GBPUSD.
GBPUSD Sell Momentum | Gap Open + Order Block BreakGBPUSD H4 Bearish Since 05 January 2026, price has been moving inside a bearish channel CHOCH BOS confirmed, indicating a clear bearish shift Internal Order Block is in play and has been respected MACD supports the bearish momentum. The lower order block has been broken.
Targets downside liquidity.

GBPUSD Bearish Breakout!
HI,Traders !
#GBPUSD made a bearish
Breakout of the rising support
Line and we are bearish biased
So we will be expecting a
Further bearish move down !
Comment and subscribe to help us grow !
GBPUSD Short IdeaConfluences of the sell:
1- Break of H4 ascending channel last touch
2- MACD divergence
3- Rejection of the channel on M30
Follow us for more ideas and trades
Dont forget your risk management calculation
[CRT]Weekly outlook -> EURUSD & GBPUSD (week of January 12)After a bearish week and to everyone’s surprise considering it was NFP week, leaving one of the targets uncompleted (specifically the two-week timeframe one), and in order not to lose track of last week’s CRT analysis , we already have direction for the start of this week:
Biweekly timeframe chart for FX:EURUSD
Here we have two targets for Monday or Tuesday:
The low of Friday, January 9 of this year
The low of Thursday, December 9, 2025
But before going into more intraday trading details, let’s analyze higher timeframes from a broader perspective:
Yearly timeframe chart for FX:EURUSD
As we already concluded last week when analyzing the yearly close , our target is the wick of the 2025 high, but that does not mean price will head there in a straight line right at the start of the year.
Let’s now move down to the semiannual chart. This time we will look at euro futures CME:6E1! because the semiannual close is very close to the high of the first six months of 2025, and the picture may change depending on whether the second semester actually closes inside or not for our analysis:
Semiannual timeframe chart for EURUSD futures CME:6E1!
And indeed, it closes inside the range, so we have a first possible reversal point at the low of the second semester of the year, which happens to be August 1, 2025:
Daily timeframe chart for EURUSD futures CME:6E1!
We all agree that this target is still very far away , but it never hurts to keep it in mind to see whether it aligns with lower timeframe targets .
Let’s remember that last week we were considering the possibility of a monthly failure swing, speculating that price was already ready to move lower without the need to take December’s high , and it seems we were right, so we also mark December’s low as a target:
Daily timeframe chart of FX:EURUSD
If we take a look at DXY, we also confirm targets and direction for the upcoming week:
Monthly chart of TVC:DXY
Let’s now bring things down to what we can expect for this week, which I expect to be another bearish one:
For me to confidently enter short positions, I would expect price to take the high left by NFP, because that is where the most important movements occurred and it also coincides exactly with Friday’s PO3 zone:
4h timeframe chart of FX:EURUSD
Why those highs and not the high of the next 4h candle?
Because even though the trend is bearish and bullish ranges usually do not complete, those highs are where the “most relevant” movement took place (even though it was a rather weak NFP), and that is where price is more likely to be attracted.
Before finishing, let’s take a quick look at the British pound:
Weekly timeframe chart of the FX:GBPUSD
The pound last week activated a bearish weekly range from which the internal target has already been taken, but the external one is still pending, which—if we are not wrong on FX:EURUSD — FX:GBPUSD should also complete.
So my sell zone is more or less the same as for FX:EURUSD , but with a small nuance:
4h timeframe chart of the FX:GBPUSD
FX:GBPUSD , by liquidating the high generated by NFP, is also liquidating Friday’s high, so if price reaches this zone, there will be more confluences for bearish continuation than on its European cousin $FX:EURUSD.
And that’s it for my weekly projection for this week. I hope it was useful and, above all, don’t forget to like the post and follow me if you want to support this type of content!
Have a great start to the week everyone and many profits!
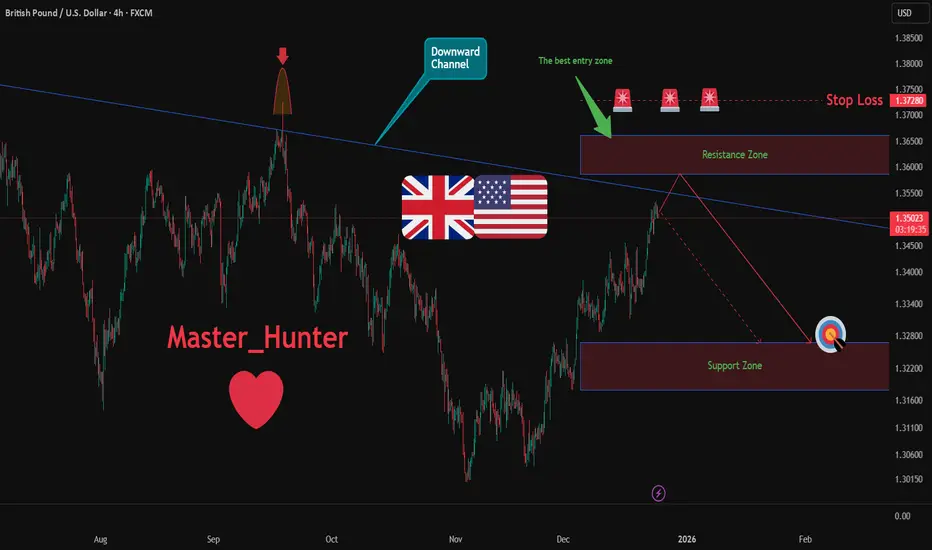
GBPUSD: Bearish Drop to 1.327?As the previous analysis worked exactly as predicted, FX:GBPUSD is eyeing a bearish reversal on the 4-hour chart , with price testing a key resistance zone after forming lower highs in a downward channel, converging with a potential entry area that could spark downside momentum if sellers defend amid recent volatility. This setup hints at a pullback opportunity in the uptrend, targeting lower support levels with risk-reward exceeding 1:2 .🔥
Entry between 1.3586–1.3660 for a short position (entry at these levels with proper risk management is recommended). Target at 1.3268 . Set a stop loss at a close above 1.3728 , yielding a risk-reward ratio of more than 1:2 . Monitor for confirmation via a bearish candle close below entry with rising volume, leveraging the channel's bearish bias.🌟
Fundamentally , GBPUSD is trading around 1.351 in late December 2025, with no major high-impact economic releases for GBP or USD this week due to Christmas (December 25) and New Year holidays, resulting in thin trading volumes and potential increased volatility from low liquidity. Markets are expected to remain quiet, with focus shifting to upcoming data in early January 2026. 💡
📝 Trade Setup
🎯 Entry (Short):
1.3586 – 1.3660
(Entry at these levels is valid with proper risk & capital management.)
🎯 Target:
1.3268
❌ Stop Loss:
• Close above 1.3728
⚖️ Risk-to-Reward:
• > 1:2
💡 Your view?
Does GBPUSD reject the 1.36 resistance zone and rotate lower toward 1.3268, or will thin holiday liquidity fuel a squeeze higher first? 👇
Also, Merry Christmas :))
GBP/USD Price Outlook – Trade Setup📊 Technical Structure
FOREXCOM:GBPUSD GBP/USD has rebounded sharply from the 1.3449–1.3454 support zone, but the recovery has stalled near the 1.3479–1.3484 resistance zone, which aligns with a descending trendline resistance from the late-December highs. This confluence has capped upside attempts so far.
On the 1-hour chart, price action shows hesitation candles near resistance, suggesting that bullish momentum is losing strength. The broader structure remains corrective within a descending trend, with price still trading below the key trendline.
As long as GBP/USD fails to sustain above 1.3484, the technical bias favours a pullback back toward support.
🎯 Trade Setup (Bearish Bias)
Entry Zone: 1.3479 – 1.3484
Stop Loss: 1.3492
Take Profit 1: 1.3454
Take Profit 2: 1.3449
Estimated Risk-to-Reward: approx. 1 : 2.19
The bearish setup remains valid as long as price stays below 1.3484 on an hourly closing basis.
🌐 Macro Background (Simplified)
From a macro perspective, expectations of Federal Reserve rate cuts in 2026 continue to weigh on the US Dollar, which has helped GBP/USD stabilize above recent lows. However, short-term USD weakness may already be partially priced in.
At the same time, the Bank of England’s gradual easing path limits aggressive upside in Sterling. BoE officials have emphasized that each subsequent rate cut will be a “closer call,” keeping policy relatively cautious compared with market expectations for the Fed.
In short: macro forces support near-term stability, but technical resistance suggests limited upside and a corrective pullback risk.
🔑 Key Technical Levels
Resistance Zone: 1.3479 – 1.3484
Support Zone: 1.3454 – 1.3449
Bearish Invalidation: Hourly close above 1.3484
📌 Trade Summary
GBP/USD has recovered from support but is struggling to break above a key resistance zone reinforced by a descending trendline. With upside momentum fading near 1.3484, a short-term pullback toward 1.3454–1.3449 is favoured.
The bearish outlook remains valid unless price breaks and holds above 1.3484, which would signal a shift toward bullish continuation.
⚠️ Disclaimer
This analysis is for reference only and does not constitute trading advice. Financial markets involve significant risk; proper risk and position management are essential.

SHORT ON GBP/USDGU is over brough and has given us a change of character to the downside on the lower timeframe.
The (DXY) Dollar is also showing strength to rise from taking out previous day/week lows.
I and looking to catch 100-150 pips on GU.

Is the Cable Preparing for a Deeper Slide? GBP/USD Outlook🎯 GBP/USD "THE CABLE" - Cash Flow Heist Setup 🏴☠️💰
📊 Market Overview
The Cable is showing bearish momentum as we approach key resistance zones. This swing/day trade setup focuses on capturing downside movement with strategic risk management.
🔍 Trade Setup Details
Direction: 🐻 BEARISH
Entry Zone: FLEXIBLE - Multiple entry opportunities available at current price levels
Stop Loss: 🛡️ 1.35000 (Invalidation level - protect your capital!)
Target: 🎯 1.33300 (Strong support zone + oversold conditions)
📈 Technical Analysis
Key Observations:
Resistance Overhead: Price facing rejection at upper levels
Support Target: 1.33300 confluence zone with multiple factors:
Historical strong support
Oversold territory expected
Potential trap zone for late shorts
⚠️ Risk Management Note:
Fellow traders, these levels are MY analysis points. Your risk tolerance = Your rules. Adjust SL/TP based on YOUR account size and strategy. Lock profits along the way - don't get greedy! 💼
🌐 Related Pairs to Watch
Keep an eye on these correlated instruments:
EUR/USD - Euro strength/weakness impacts Cable
DXY (US Dollar Index) - Inverse correlation with GBP/USD
GBP/JPY - Confirms GBP momentum
EUR/GBP - Shows relative strength between pairs
💵 USD Pairs Correlation:
OANDA:AUDUSD - Risk sentiment gauge
OANDA:NZDUSD - Commodity currency correlation
FX:USDJPY - Safe haven flows indicator
Key Point: If DXY strengthens, expect additional downside pressure on Cable. Monitor EUR/USD for confirmation of USD strength vs. weakness in GBP specifically.
🎓 Strategy Notes
This is a "cash flow management" approach - meaning we're looking to capture liquidity moves and bank profits systematically. The setup combines:
✅ Technical levels
✅ Market structure
✅ Risk-reward optimization
✅ Exit strategy before reversal zones
Pro Tip: Consider scaling out at 1.33500 to secure partial profits before the final target!
✨ If you find value in my analysis, a 👍 and 🚀 boost is much appreciated — it helps me share more setups with the community!
#GBPUSD #TheCable #ForexTrading #SwingTrading #DayTrading #TechnicalAnalysis #ForexSignals #CashFlow #BearishSetup #PriceAction #SupportAndResistance #RiskManagement #ForexStrategy #DXY #CurrencyTrading #TradingIdeas #ForexCommunity #MarketAnalysis

GBP/USD Price Outlook – Trade Setup📊 Technical Structure
FPMARKETS:GBPUSD GBP/USD continues to consolidate around the 1.3330 level after last week’s strong rebound, with price holding above the 1.3316–1.3326 support zone while repeatedly failing to break the 1.3358–1.3370 resistance zone. A descending trendline from prior highs continues to cap upside momentum, forming a compression pattern as the pair approaches the Federal Reserve decision.
The 4H structure suggests that price may retest the resistance zone once more before potentially rolling over. As long as GBP/USD stays below 1.3358–1.3370, bearish rejection scenarios remain likely. A decisive break above the trendline would shift momentum to the upside, while a break below 1.3316 opens the door toward deeper support.
🎯 Trade Setup
Idea: Sell from resistance, looking for rejection below the descending trendline.
Entry: 1.3358 – 1.3370
Stop Loss: 1.3372
Take Profit 1: 1.3326
Take Profit 2: 1.3316
Risk–Reward Ratio: ≈ 1 : 3.1
As long as price stays below the descending trendline and below 1.3370, the bearish setup remains valid. A 4H close above the resistance zone invalidates this scenario.
🌐 Macro Background
Markets are waiting for the Federal Reserve interest rate decision on Wednesday, and traders aren’t willing to push GBP/USD aggressively in either direction. The USD stays weak because investors expect the Fed to cut interest rates again, which lowers the dollar’s yield advantage and generally supports GBP/USD.
On the UK side, the end of budget uncertainty gives the British Pound some support. The UK government announced tax adjustments to stabilize public finances, helping calm investor concerns and giving GBP a firmer footing.
Overall, GBP/USD trades in a tight range because both sides—USD weakness from Fed expectations and GBP support from fiscal clarity—are balancing each other until the FOMC meeting provides new direction.
🔑 Key Technical Levels
Resistance Zone: 1.3358 – 1.3370
Support Zone: 1.3316 – 1.3326
Invalidation Level: 1.3372 (4H close above)
📌 Trade Summary
GBP/USD consolidates near 1.3330 as traders wait for the Fed. The technical picture favours selling the resistance zone at 1.3358–1.3372 due to trendline pressure and repeated rejection. However, macro factors remain mixed ahead of the FOMC decision. Downside targets sit at 1.3316 and 1.3316 unless price breaks above 1.3372 which would signal bullish continuation.
⚠️ Disclaimer
This analysis is for reference only and does not constitute trading advice. Trading involves significant risk, and proper risk management is essential.

GBPUSD: Rallies Are Getting Sold, & Dollar Still Has Upper HandEvery time GBPUSD tries to lift its head, it seems to run straight into supply. Zooming out, this chart feels like a classic distribution phase after a strong first-half rally. Fundamentally, that makes sense. Sterling has lost its earlier policy edge, while the dollar continues to benefit from relative growth resilience and sticky US yields. From here, GBPUSD looks more like a corrective bounce inside a bigger bearish structure than the start of a fresh uptrend.
Current Bias
Bearish.
GBPUSD is trading below key trend resistance, and recent upside attempts are being capped. Until price can reclaim and hold above the upper supply zones, rallies look vulnerable to renewed selling.
Key Fundamental Drivers
Bank of England vs Fed divergence fading
Earlier GBP strength was built on the idea that the BoE would be more restrictive for longer. That narrative has weakened. UK inflation has cooled, growth data is soft, and rate cuts are firmly on the table for 2026.
Meanwhile, the Fed is preparing to cut, but at a cautious pace. That keeps US rate differentials from swinging decisively against the dollar.
UK growth fragility
UK activity data continues to point to sluggish growth and a vulnerable consumer. This limits how aggressive the BoE can be, especially compared to a US economy that is slowing but not stalling.
USD demand and risk backdrop
In periods of uncertainty or policy repricing, USD demand remains strong. GBP does not benefit from safe-haven flows and tends to underperform when global risk sentiment wobbles.
Macro Context
Interest rate expectations
Markets are pricing gradual easing from both central banks, but the Fed is seen as more patient and reactive to data. That keeps US yields relatively supported versus the UK.
Economic growth trends
The US is slowing from above-trend levels; the UK is closer to stagnation. That relative growth story still favors USD over GBP.
Geopolitics and policy risk
Trade tensions, election risk, and global policy uncertainty tend to support USD over cyclical currencies like GBP.
Overall, the macro backdrop aligns with a bearish GBPUSD bias rather than a sustained recovery.
Primary Risk to the Trend
The main risk to the bearish view would be:
A sharp deterioration in US data that forces the Fed into faster or deeper rate cuts than currently expected, or
A surprise reacceleration in UK inflation or growth that pushes the BoE into a less-dovish stance.
Either scenario could weaken USD or boost GBP enough to invalidate the downside structure.
Most Critical Upcoming News/Event
US data: CPI, PCE, NFP and Fed speakers, particularly anything that materially shifts rate-cut expectations.
UK data: CPI, labor market reports, GDP updates, and BoE communication confirming or challenging the easing bias.
At the margin, USD-side events remain more influential for direction.
Leader/Lagger Dynamics
GBPUSD is a lagger.
It tends to follow moves in DXY and US yields, rather than lead them.
Cable often confirms broader USD strength or weakness after it shows up first in DXY or pairs like USDJPY.
GBP crosses (such as GBPJPY or EURGBP) can sometimes move first and give early clues for GBPUSD.
Key Levels
Support Levels:
1.3200–1.3180: Near-term support and prior reaction area.
1.3000–1.2950: Major downside magnet if bearish momentum accelerates.
Resistance Levels:
1.3350–1.3400: Key supply zone where recent rallies have stalled.
1.3700–1.3800: Major macro resistance and bearish invalidation area.
Stop Loss (SL):
Above 1.3800 on a daily closing basis, which would signal a structural shift back to GBP strength.
Take Profit (TP):
First target around 1.3200,
Extension toward 1.3000 if USD strength persists and risk sentiment weakens.
Summary: Bias and Watchpoints
GBPUSD remains bearish, both structurally and fundamentally. The BoE is drifting further into an easing cycle while the Fed remains cautious, keeping relative yield support tilted toward the dollar. As long as price stays capped below the 1.3350–1.3400 resistance zone, rallies look like selling opportunities rather than trend reversals.
Key levels to watch are support near 1.3200 and the larger downside target around 1.3000. A daily close above 1.38 would force a reassessment, but until then, Cable appears to be a lagging pair that reflects broader USD strength, not a driver of it.

GBPUSDGBPUSD
- Break of Structure
- Bearish Channel as an corrective pattern in Long Time Frame
- RSI - Divergence
- Demand Zone
- Change of Characteristics

gbp_usdGiven that we expect the dollar index to strengthen, we plan to sell the pound as indicated on the chart.
