GBPUSD: Intraday Buying Setup 04/02/2026The FX:GBPUSD pair dropped after the DXY reversed to bullish. Since the start of this week, the price has been declining. We’ve identified a potential buying zone where we believe the price will likely move. Once the price reaches our marked ‘point of interest’ the trade will activate and you can set a stop loss based on your analysis and risk management.
If you agree with our work, please comment below.
Team Setupsfx_
Gbpusdsignals

GBPUSD Rising Suport Ahead!
HI,Traders !
#GBPUSD is about to retest
The rising support while
Trading in an uptrend so
I am bullish biased and
I think that we will see
A local bullish rebound !
Comment and subscribe to help us grow !

GBPUSD: Intraday Trading Idea Possible Sell Worth 250+ PipsDear Traders,
I hope you’re doing well. We’re seeing strong selling pressure at the current price range and believe the price could drop around 1.3500, a 250+ pip move. We’re waiting for a strong bearish candle to close to confirm the bearish drop.
If you like our work, please like and comment. Follow us for more.
Team Setupsfx_

GBPUSD: Highly Probable +1400 Pips Trading Setup! Dear Traders,
📌GBPUSD has shown strong bullish momentum, with price action indicating upward pushes. However, caution is advised as temporary pullbacks are possible before sustained rallies resume. The pair’s movement is influenced by the US Dollar Index (DXY), which is showing signs of potential weakness. This supports the bullish outlook for GBPUSD.
📌Currently, the pair is in a bullish trend with temporary corrective dips expected. There’s a safe entry area for buyers around the ‘blue marked’ arrow. Three profit targets are marked, each for partial or full profit-taking. Avoid early entries near the ‘red marked’ arrow area, as it carries higher risk. Instead, prefer entries after the price breaks above the trend line, confirms liquidity absorption, and retests the breakout zone.
📌Furthermore, the US Dollar Index (DXY) is likely to decline due to upcoming economic data and market sentiment, which will favour GBP strength. The UK economic outlook is positive, supporting Sterling’s resilience. However, US economic uncertainty, with slowing growth and potential interest rate adjustments, may further pressure the dollar.
📌Finally, wait for the price to revisit the ‘blue marked’ support for a safer entry opportunity. Enter long positions after the trend line breaks and retests confirmation. Aim for the three defined targets, scaling out positions progressively. Maintain disciplined risk management throughout.
If you enjoy our work, please like and comment on the post. Your support means the world to us and encourages us to share more educational trading setups. If you’d like us to analyse any other trading plans, please comment below, and we’ll analyse them as soon as possible. 📊❤️
⚠️Disclaimer⚠️
This is not financial advice and is only for educational purposes. Please do your own research and make decisions based on your own knowledge and chart analysis. Financial markets can lead to serious losses, so have a thorough trading plan and risk management strategy.
Thank you❤️
Team Setupsfx_

#GBPUSD: +910 PIPS Buying Setup! Swing Setup! GBPUSD broken through the bearish trend line liquidity now we think price is likely to continue uptrend with around 910+ pips swing buying setup. We also have important news coming up this week so be careful while trading also use accurate risk management while trading.
Good luck and trade safe!
Team Setupsfx_

GBP/USD Price Outlook – Trade Setup📊 Technical Structure
FPMARKETS:GBPUSD GBP/USD is rebounding from the 1.3810–1.3820 support zone, which aligns with prior demand and the lower boundary of the recent consolidation structure. Price has reclaimed short-term momentum after holding above support, suggesting buyers are defending this area.
The broader structure shows a higher low formation, while price is now pushing back toward the 1.3870–1.3880 resistance zone, where previous supply capped upside moves. As long as price remains above the support zone, the near-term bias favors further upside continuation.
🎯 Trade Setup (Bullish Bias)
Entry Zone: 1.3810 – 1.3820
Stop Loss: 1.3800
Take Profit 1: 1.3842
Take Profit 2: 1.3870 – 1.3880
Risk–Reward Ratio: Approx. 1 : 2.89
❌ Invalidation
A decisive break and sustained close below 1.3800 would invalidate the bullish setup and signal renewed downside risk.
🌐 Macro Background
GBP/USD remains supported near multi-year highs as the US Dollar stays under pressure following the Federal Reserve’s neutral rate hold and ongoing uncertainty surrounding future Fed leadership. While the Fed offered no clear dovish signal, markets continue to price in medium-term USD softness amid political and policy uncertainty.
In this environment, Sterling strength remains intact, allowing GBP/USD to stay bid as long as key technical support holds.
🔑 Key Technical Levels
Resistance Zone: 1.3870 – 1.3880
Support Zone: 1.3810 – 1.3820
Bullish Invalidation: Below 1.3800
📌 Trade Summary
GBP/USD is holding above a well-defined support zone and showing signs of continuation toward the upper resistance band. As long as price stays above 1.3810, dips are viewed as buy-the-pullback opportunities, targeting 1.3870–1.3880.
⚠️ Disclaimer
This analysis is for reference only and does not constitute trading advice. Financial markets involve significant risk; proper risk and position management are essential.

GBPUSD Final rally before a 2026 collapse.The GBPUSD pair has been trading within a giant Bullish Megaphone pattern for the past 3 years. This week will most likely be the first to close green after three straight bearish 1W candles. It is likely however to be the last one as having broken below its 1W MA50 (blue trend-line) in November 2025, the pair has confirmed the start of a new Bear Cycle.
So far, that is similar to the 2019 - 2021 Bullish Megaphone, which after making a 1W MA100/ 200 Bearish Cross and breaking below its 1W MA50, it confirmed a massive Bear Cycle that first hit its bottom on the 0.836 Fibonacci level and then broke the pattern to the downside making a new market Low.
As a result, we expect this week's bullish sentiment to reverse on the Lower Highs Resistance (2021 also displayed one) and towards the end of 2026 test the 0.836 Fib at 1.2400. Notice also the striking similarities among the 1W RSI sequences of those two fractals.
---
** Please LIKE 👍, FOLLOW ✅, SHARE 🙌 and COMMENT ✍ if you enjoy this idea! Also share your ideas and charts in the comments section below! This is best way to keep it relevant, support us, keep the content here free and allow the idea to reach as many people as possible. **
---
💸💸💸💸💸💸
👇 👇 👇 👇 👇 👇

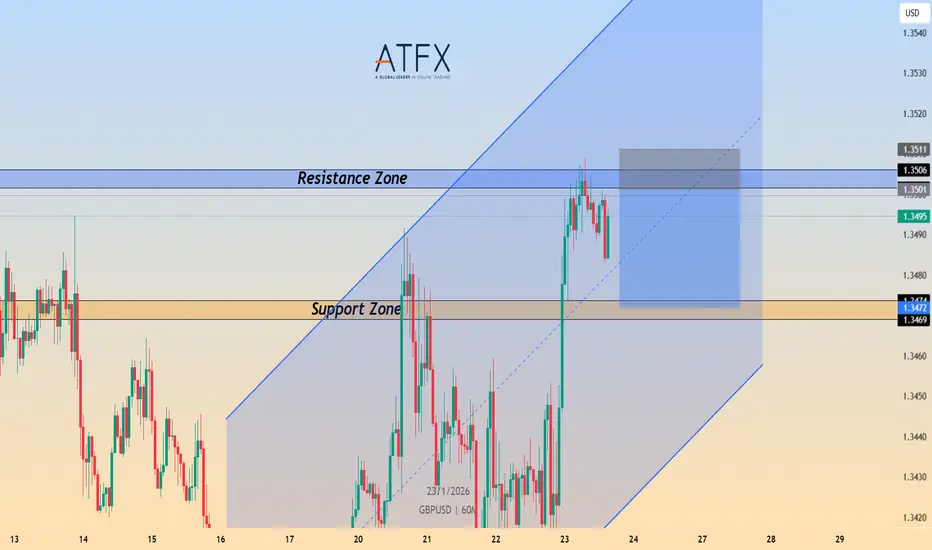
GBP/USD Price Outlook – Trade Setup📊 Technical Structure
FPMARKETS:GBPUSD GBP/USD is showing signs of a short-term bearish reversal after being rejected from the 1.3501–1.3506 resistance zone. The recent failure to sustain gains above this resistance has triggered a pullback, indicating weakening bullish momentum.
Price action suggests a corrective move lower is unfolding. As long as GBP/USD remains capped below the resistance zone, the near-term structure favors a continuation toward the 1.3469–1.3472 support zone, which coincides with the lower boundary of the channel and a key demand area.
🎯 Trade Setup (Bearish Bias)
Entry Zone: 1.3501 – 1.3506
Stop Loss: 1.3511
Take Profit 1: 1.3472
Take Profit 2: 1.3469
Risk–Reward Ratio: Approx. 1 : 2.93
📌 Invalidation
A sustained break and close above 1.3511 would invalidate the bearish setup and signal a resumption of the broader bullish trend.
🌐 Macro Background
Despite the upside surprise in UK Retail Sales, which rose 0.4% MoM in December versus expectations of a -0.1% decline, GBP/USD has struggled to extend gains and is showing signs of exhaustion near resistance.
Broader market sentiment remains cautious as investors digest geopolitical developments linked to President Trump’s trade stance and Greenland ambitions, which continue to inject uncertainty into risk markets.
On the US side, the Dollar has stabilized modestly after recent weakness, as expectations of aggressive near-term Fed easing have been pushed back. This macro backdrop supports a near-term corrective pullback in GBP/USD rather than an immediate continuation higher.
🔑 Key Technical Levels
Resistance Zone: 1.3501 – 1.3506
Support Zone: 1.3469 – 1.3472
Bearish Invalidation: Above 1.3511
📌 Trade Summary
GBP/USD has been rejected from a key resistance zone and is showing signs of short-term distribution. As long as price remains below 1.3501–1.3506, the bias favours a sell-on-rallies approach, targeting a pullback toward the 1.3472–1.3469 support region.
⚠️ Disclaimer
This analysis is for reference only and does not constitute trading advice. Financial markets involve significant risk; proper risk and position management are essential.
GBP/USD Price Outlook – Trade Setup📊 Technical Structure
FOREXCOM:GBPUSD GBP/USD is currently trading just below a key resistance zone at 1.3456–1.3464, where price has shown clear rejection after the recent upside attempt. The latest rally failed to produce a sustained breakout above the prior high, forming a high-zone rejection + pullback consolidation structure.
From a price-action perspective, bullish momentum is fading, and the market is starting to roll over beneath resistance. The projected path suggests a minor rebound into the resistance band, followed by a downside continuation toward the 1.3400–1.3390 support zone, rather than an immediate bullish breakout.
🎯 Trade Setup (Bearish Bias)
Entry Zone: 1.3456 – 1.3464
Stop Loss: 1.3472
Take Profit 1: 1.3401
Take Profit 2: 1.3393
Risk–Reward Ratio: Approx. 1 : 3.61
📌 Invalidation
A sustained break and close above 1.3472 would invalidate the bearish setup and require a reassessment of the market structure.
🌐 Macro Background
Fundamentally, while recent UK employment data provided short-term support for Sterling, markets are now waiting for the UK December CPI, PPI, and Retail Price Index releases, creating scope for a “buy-the-rumor, sell-the-fact” pullback.
On the US side, ongoing uncertainty surrounding the US–Greenland issue, along with renewed tariff threats from President Trump toward European countries, continues to fuel risk aversion. This environment raises the probability of a near-term technical rebound in the US Dollar. Against this backdrop, GBP/USD remains vulnerable to profit-taking and corrective downside pressure near the upper resistance band.
🔑 Key Technical Levels
Resistance Zone: 1.3456 – 1.3464
Support Zone: 1.3390 – 1.3400
Bearish Invalidation: Above 1.3472
📌 Trade Summary
GBP/USD is showing signs of rejection beneath a key resistance zone, with fading upside momentum. As long as price remains capped below 1.3456–1.3464, the bias favours a sell-on-rallies approach, targeting a pullback toward the lower support band.
⚠️ Disclaimer
This analysis is for reference only and does not constitute investment or trading advice. Financial markets involve risk, and traders should manage positions according to their own risk tolerance.

EURUSD and GBPUSD Analysis todayHello traders, this is a complete multiple timeframe analysis of this pair. We see could find significant trading opportunities as per analysis upon price action confirmation we may take this trade. Smash the like button if you find value in this analysis and drop a comment if you have any questions or let me know which pair to cover in my next analysis.

Coinranger| GBPUSD: Pullback and fall to 1.33237🔹The DXY has faded a bit in its rise, but there's no clear indication of a significant reversal on the elder timeframes yet. So, it's very likely that after the pullback is realized, we'll continue to rise to the 99.23 area and higher, to 99.44.
🔹No news today, except for the International Economic Forum in Davos.
🔹The pound reached its second extension on h1, so the rally on the pullback was (or still may be) aggressive. But overall, we're continuing to decline.
Levels:
Below:
1.33626 - a full set of downward waves
1.33406 - first extension
1.33237 - second extension
Above:
1.34300 - possible continuation of the pullback, but no guarantees. We'll watch the DXY here.
The overall sentiment is still down. We're keeping an eye on DXY
-------------------
Share your thoughts in the comments

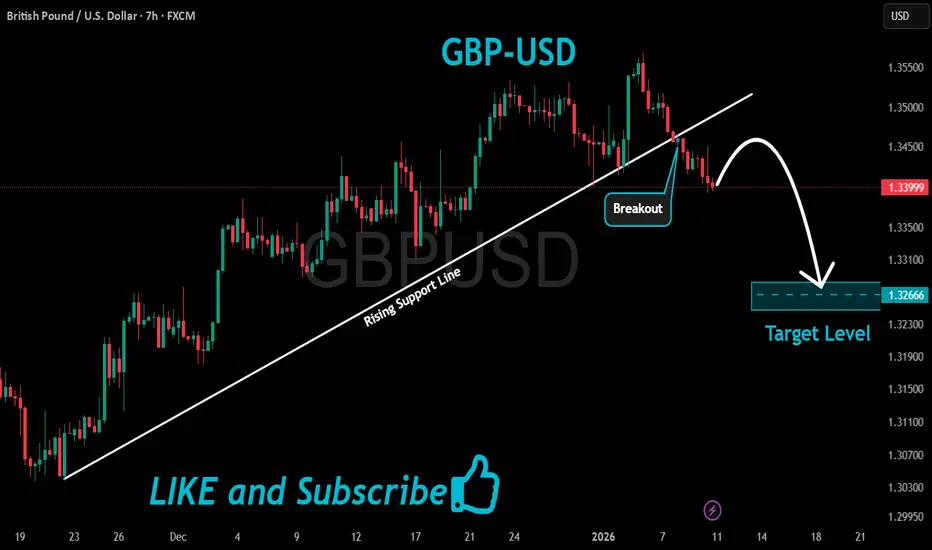
GBPUSD Bearish Breakout!
HI,Traders !
#GBPUSD made a bearish
Breakout of the rising support
Line and we are bearish biased
So we will be expecting a
Further bearish move down !
Comment and subscribe to help us grow !
GBP/USD Price Outlook – Trade Setup📊 Technical Structure
FPMARKETS:GBPUSD GBP/USD is currently trading within a short-term recovery phase after rebounding from the 1.3430–1.3440 support zone. Price action shows a clear rejection of lower levels, with buyers stepping in aggressively following the recent pullback.
The pair is now stabilizing above the former demand area, suggesting that downside momentum has eased. As long as GBP/USD holds above the highlighted support zone, the technical structure favours a bullish continuation, with price likely to consolidate briefly before attempting a move higher toward the upper resistance band around 1.3495–1.3504.
🎯 Trade Setup (Bullish Bias)
Entry Zone: 1.3430 – 1.3440
Stop Loss: 1.3422
Take Profit 1: 1.3495
Take Profit 2: 1.3505
Risk–Reward Ratio: Approx. 1 : 2.9
📌 Invalidation:
A sustained break and close below 1.3422 would invalidate the bullish setup and signal a deeper corrective move.
🌐 Macro Background
Sterling has found support amid renewed concerns over the independence of the U.S. Federal Reserve, which has weighed on the US Dollar and provided a near-term tailwind for GBP/USD. Political pressure on the Fed has increased uncertainty around future policy decisions, prompting USD softness across the board.
On the UK side, expectations for further Bank of England rate cuts remain, but markets appear to have largely priced in gradual easing. In the near term, attention is firmly on upcoming U.S. CPI inflation data, which could drive volatility. Until clearer direction emerges, GBP/USD remains supported on dips as long as USD sentiment stays fragile.
🔑 Key Technical Levels
Resistance Zone: 1.3495 – 1.3505
Support Zone: 1.3430 – 1.3440
Bullish Invalidation: Below 1.3422
📌 Trade Summary
GBP/USD has rebounded from a well-defined support zone and is holding above key demand. As long as price remains supported above 1.3430, the bias favours a buy-on-dips strategy, targeting a recovery toward the 1.3500 resistance area.
⚠️ Disclaimer
This analysis is for reference only and does not constitute trading advice. Financial markets involve significant risk; proper risk and position management are essential.

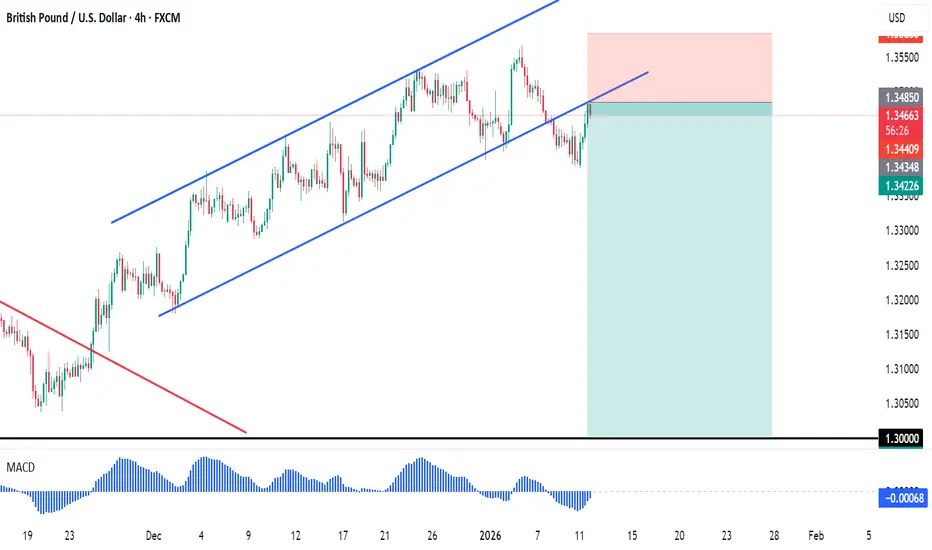
GBPUSD Short IdeaConfluences of the sell:
1- Break of H4 ascending channel last touch
2- MACD divergence
3- Rejection of the channel on M30
Follow us for more ideas and trades
Dont forget your risk management calculation
GBP/USD → Bullish Continuation Scenario🎯 GBP/USD "THE CABLE" SWING/DAY TRADE SETUP | Bullish Momentum Confirmed! 💷📈
📊 REAL-TIME MARKET DATA (January 12, 2026)
Current Price: 1.3403 💹
Daily Range: 1.3391 - 1.3453
Previous Close: 1.3434
52-Week Range: 1.2098 - 1.3790
🎨 TRADE SETUP OVERVIEW
📌 Asset: GBP/USD (British Pound / US Dollar)
🏷️ Nickname: "THE CABLE" 🔌 (Historical name from 1866 transatlantic telegraph cable connecting London & New York)
⏱️ Timeframe: SWING / DAY TRADE
📈 Bias: BULLISH ✅ Confirmed with Triangular Moving Average on 2H Chart
🎯 THE "THIEF" ENTRY STRATEGY 🥷
💰 ENTRY ZONES - LAYERED LIMIT ORDERS (DCA Style)
The "Thief" strategy uses multiple limit buy orders (layering technique) to build positions at favorable prices:
🔹 Layer 1: 1.34200
🔹 Layer 2: 1.34400
🔹 Layer 3: 1.34600
⚡ FLEXIBILITY: You can add MORE layers based on your risk appetite and capital allocation. The more layers = better average entry price! 💎
🆕 ALTERNATIVE: Can enter at ANY CURRENT PRICE LEVEL if momentum confirms bullish continuation above 1.3400 psychological level.
🎯 TARGET ZONE - "POLICE FORCE" RESISTANCE 🚔
🏁 PRIMARY TARGET: 1.35500 🎯
⚠️ Why This Level?
Strong resistance zone acting as "Police Force"
Potential overbought conditions near this level
Historical rejection zone + profit-taking area
Smart money trap area - ESCAPE WITH YOUR PROFITS! 💰
📢 DISCLAIMER (Thief OG's): This is NOT a rigid TP level. You can take profits at YOUR OWN DISCRETION based on:
✅ Price action signals
✅ Volume analysis
✅ Your personal risk tolerance
✅ Partial profit-taking strategy (Take 50% at 1.3500, let rest run to 1.3550+)
🛡️ STOP LOSS - RISK MANAGEMENT 🚨
🔴 THIEF SL: 1.34000 (Below recent support structure)
📢 DISCLAIMER (Thief OG's): This SL is a suggested level. Adjust based on:
⚠️ Your account size
⚠️ Risk per trade (1-2% recommended)
⚠️ Market volatility
⚠️ Your trading psychology
💡 PRO TIP: Trail your stop loss as price moves in your favor! Once price hits 1.3480, move SL to breakeven (entry price).
📌 CORRELATED PAIRS TO WATCH 🔍
🔗 USD-Based Pairs (Inverse Correlation)
DXY (US Dollar Index): Currently near 98.25 📉
Correlation: -0.97 (Nearly perfect inverse correlation)
DXY down ~10% year-on-year, supporting GBP/USD upside
Watch for DXY breakdown below 98.00 = ROCKET FUEL for Cable! 🚀
EUR/USD: Key resistance 1.1686-1.1748 📊
Note: EUR is 57.6% of DXY basket - strong correlation driver
EUR/USD strength = GBP/USD strength (typically)
Monitor for synchronized moves
USD/JPY: Safe-haven flows impact 🇯🇵
Risk-on sentiment favors GBP over safe havens
Watch for USD/JPY weakness confirming dollar weakness
AUD/USD & NZD/USD: Risk sentiment indicators 🌏
Commodity currencies moving higher = positive for GBP/USD
📰 FUNDAMENTAL & ECONOMIC FACTORS 🌍
🇬🇧 UK ECONOMY OUTLOOK
Recent Data:
UK CPI inflation fell to 3.2% in November 2025, down from 3.6% in October
UK GDP contracted 0.1% in October, showing economic weakness
S&P Global UK PMI rose to 52.1 in December, signaling business recovery post-Budget uncertainty
FTSE 100 broke historic 10,000 level in early January 2026 🎉
Bank of England (BoE) Policy:
BoE cut rates to 3.75% in December
88% probability of another 25bp cut at upcoming meeting
Further easing expected as inflation cools and labor market softens
2026 Growth Projections:
OECD forecasts 1.2% UK growth in 2026
Modest recovery expected but below historical averages
🇺🇸 US ECONOMY & FEDERAL RESERVE
Fed Policy Stance:
Fed cut rates 3 times in 2025, current range 3.50%-3.75%
Fed Governor Miran calls for 100+ basis points of cuts in 2026
CBO expects Fed funds rate to settle at 3.4% by end-2026
Economic Indicators:
Recent jobless claims at 199K vs forecast 219K, showing tight labor market
December NFP expected 60-70K jobs (released January 9)
Unemployment fell more than expected in December, reducing immediate rate cut expectations
💡 KEY INSIGHT: Dollar expected to weaken further 5% in 2026 on DXY basis, supporting GBP/USD bullish thesis! 📈
🌐 GEOPOLITICAL & MACRO THEMES
Trump Administration (January 2025):
Treasury Secretary Bessent says more Fed rate cuts needed for stronger economy
New Fed Chair to be appointed (Jerome Powell's term ends May 2026)
Potential AI productivity boost to economy being assessed
Central Bank Divergence:
Fed expected to cut further while ECB on hold
Rate spread moving in favor of EUR as Fed cuts more than priced
USD structural weakness bias into 2026
🔥 UPCOMING KEY EVENTS TO WATCH 📅
🇬🇧 UK Events:
BoE Interest Rate Decision (Watch for further cuts)
UK Employment & Wage Data
UK GDP Monthly Releases
PMI Manufacturing & Services Data
🇺🇸 US Events:
FOMC Meeting (End of January): ~90% probability of 25bp cut priced in
NFP Employment Reports
CPI & PPI Inflation Data
Retail Sales & Consumer Sentiment
Fed Chair Nominee Announcement
🌍 Global Risk Factors:
ECB Policy Decisions
Global Trade Policy Developments
Geopolitical Tensions
Stock Market Volatility (S&P 500, FTSE 100)
🎓 TECHNICAL ANALYSIS HIGHLIGHTS 📉📈
🟢 BULLISH SIGNALS:
✅ TRIANGULAR Moving Average trending upward on 2H chart
✅ Price broke above 1.3275-1.3280 confluence (200-day SMA + 38.2% Fib)
✅ Oscillators on daily chart holding in positive territory
✅ Higher highs and higher lows structure forming
✅ Ascending channel from November lows intact
🔴 KEY RESISTANCE ZONES:
⚠️ 1.3365: 50% Fibonacci retracement level
⚠️ 1.3400: Major psychological level
⚠️ 1.3455-1.3460: 61.8% Fibonacci retracement
⚠️ 1.3500: Major supply zone with multiple rejections
⚠️ 1.3550: TARGET ZONE - "Police Force" resistance
🟡 SUPPORT ZONES:
🛡️ 1.3380-1.3375: 200-day SMA + prior resistance breakpoint
🛡️ 1.3300: Round number psychological support
🛡️ 1.3280: Critical support - breakdown = bearish reversal
💡 TRADING PSYCHOLOGY TIPS 🧠
For The "Thief OG's":
📊 Risk Management is KING 👑
Never risk more than 1-2% of account per trade
Use proper position sizing based on your SL distance
🎯 Partial Profit Strategy
Scale out at multiple levels (50% at 1.3480, 30% at 1.3520, 20% at 1.3550+)
Prevents missing major moves while securing gains
🔄 Trail Your Stops
Move SL to breakeven once +80 pips in profit
Trail behind major support levels as trade progresses
📰 Stay Informed
Monitor economic calendar for surprise data releases
Be aware of central bank speeches and policy shifts
🚫 Avoid FOMO
Don't chase the trade if price runs away
Wait for pullbacks to your entry zones
Better to miss a trade than force a bad entry
💎 Diamond Hands on Winners
Let profitable trades run with trailing stops
Don't cut winners too early out of fear
⚠️ RISK DISCLOSURE 🚨
🔴 CRITICAL WARNINGS:
⚠️ Forex trading involves HIGH RISK and may not be suitable for all traders
⚠️ Past performance does NOT guarantee future results
⚠️ Leverage can amplify both profits AND losses significantly
⚠️ Only trade with capital you can afford to lose
⚠️ This is NOT FINANCIAL ADVICE - for educational purposes only
⚠️ Always conduct your own research and analysis
⚠️ Consider consulting a licensed financial advisor
⚠️ Market conditions can change rapidly - stay vigilant!
🎉 SUMMARY FOR THIEF OG's 🎉
THE PLAN:
✅ ENTRY: Layer limit orders at 1.34200 / 1.34400 / 1.34600 OR enter at current price on bullish confirmation
✅ TARGET: 1.35500 (adjust based on YOUR risk appetite)
✅ STOP LOSS: 1.34000 (adjust based on YOUR risk management)
✅ RISK-REWARD: Approximately 1:2.5 ratio from mid-entry to target
THE EDGE:
📈 Bullish technical structure + TMA confirmation
🌍 Fundamental support from Fed dovish stance and USD weakness
💹 EUR/USD forecast to 1.2400 by end-2026 supports broader USD weakness
🔥 Perfect storm for Cable to rally!
📣 STAY CONNECTED & ENGAGED! 🤝
👍 LIKE this idea if you agree with the analysis!
💬 COMMENT your thoughts and your own TP/SL levels!
🔔 FOLLOW for more professional setups and market insights!
📊 SHARE with your trading community!
🔗 USEFUL RESOURCES 📚
📌 Real-Time Data: TradingView GBP/USD
📌 Central Bank Calendars: Fed | BoE | ECB
📌 Correlation Tools: Check DXY, EUR/USD for confluence
🎯 Trade Smart | Trade Safe | Trade Profitable! 💎🙌

GBPUSD Channel Down starting new Bearish Leg.The GBPUSD pair has been trading within a 6-month Channel Down and appears to have just started its new Bearish Leg as Tuesday's Lower High was priced exactly on its top.
As the same time, it almost hit the 0.786 Fibonacci retracement level, which is where the previous (September 17 2025) Lower High was formed, while also the 1D RSI is on the decline after marginally turning overbought (above 70.00).
As a result, we expect the pattern's new Bearish Leg to unfold and can be confirmed as soon as the price breaks below the 1D MA200 (orange trend-line). The previous two Bearish Legs declined by -4.70% and -5.24% respectively, and in both cases the 1D RSI hit the 30.00 oversold barrier.
A new -4.70% decline would target 1.2930, but since this time the 1W MA100 (red trend-line) is in the way, which is the market's long-term Support, we expect a more fair Target to be 1.3050 until we can confirm further downside.
If the 1D RSI hits 30.00 before the price reaches 1.3050, we will take profit regardless.
---
** Please LIKE 👍, FOLLOW ✅, SHARE 🙌 and COMMENT ✍ if you enjoy this idea! Also share your ideas and charts in the comments section below! This is best way to keep it relevant, support us, keep the content here free and allow the idea to reach as many people as possible. **
---
💸💸💸💸💸💸
👇 👇 👇 👇 👇 👇

Mastering GBPUSD Pt 2: Structure as a Nervous SystemGBPUSD isn’t difficult because you lack skill. It’s difficult because it demands patience, structure, and trust.
In this three part series, I break down the art of mastering GBPUSD not through flashy setups or overcomplicated strategies, but through understanding how this pair actually moves and why it tests traders psychologically before it rewards them.
We’ll talk about structure, timing, execution, and the subtle mindset shifts that turn frustration into clarity. If you’ve ever felt like GBPUSD almost works for you—but not consistently—this series is designed to help you see what you’ve been missing.
This isn’t about trading more. It’s about trading with intention.
If this resonates, leave a comment, save the video, and let me know which part of GBPUSD you struggle with most. And if you want more breakdowns like this, follow the profile and turn on notifications so you don’t miss the next one.

GBP/USD Price Outlook – Trade Setup📊 Technical Structure
FOREXCOM:GBPUSD GBP/USD has rebounded sharply from the 1.3449–1.3454 support zone, but the recovery has stalled near the 1.3479–1.3484 resistance zone, which aligns with a descending trendline resistance from the late-December highs. This confluence has capped upside attempts so far.
On the 1-hour chart, price action shows hesitation candles near resistance, suggesting that bullish momentum is losing strength. The broader structure remains corrective within a descending trend, with price still trading below the key trendline.
As long as GBP/USD fails to sustain above 1.3484, the technical bias favours a pullback back toward support.
🎯 Trade Setup (Bearish Bias)
Entry Zone: 1.3479 – 1.3484
Stop Loss: 1.3492
Take Profit 1: 1.3454
Take Profit 2: 1.3449
Estimated Risk-to-Reward: approx. 1 : 2.19
The bearish setup remains valid as long as price stays below 1.3484 on an hourly closing basis.
🌐 Macro Background (Simplified)
From a macro perspective, expectations of Federal Reserve rate cuts in 2026 continue to weigh on the US Dollar, which has helped GBP/USD stabilize above recent lows. However, short-term USD weakness may already be partially priced in.
At the same time, the Bank of England’s gradual easing path limits aggressive upside in Sterling. BoE officials have emphasized that each subsequent rate cut will be a “closer call,” keeping policy relatively cautious compared with market expectations for the Fed.
In short: macro forces support near-term stability, but technical resistance suggests limited upside and a corrective pullback risk.
🔑 Key Technical Levels
Resistance Zone: 1.3479 – 1.3484
Support Zone: 1.3454 – 1.3449
Bearish Invalidation: Hourly close above 1.3484
📌 Trade Summary
GBP/USD has recovered from support but is struggling to break above a key resistance zone reinforced by a descending trendline. With upside momentum fading near 1.3484, a short-term pullback toward 1.3454–1.3449 is favoured.
The bearish outlook remains valid unless price breaks and holds above 1.3484, which would signal a shift toward bullish continuation.
⚠️ Disclaimer
This analysis is for reference only and does not constitute trading advice. Financial markets involve significant risk; proper risk and position management are essential.

GBPUSD Multi-year downtrend is starting.The GBPUSD pair has been quietly trading within a multi-decade Channel Down since its November 2007 market Top. The price is now the closest it has been to its 1M MA200 (orange trend-line) since it broke below in August 2014. This is also the 0.786 Fibonacci Channel level, the trend-line where that 2014 Bearish Leg started.
With the 1M RSI also rejected on its 65.00 Resistance, we believe the pair is starting a new multi-year Bearish Leg. The minimum such a Bearish Leg declined by within this pattern, has been -20.75%, which gives us a Target of at least 1.0950 by 2027. GBPUSD is perhaps one of the strongest long-term sell opportunities in the market right now.
---
** Please LIKE 👍, FOLLOW ✅, SHARE 🙌 and COMMENT ✍ if you enjoy this idea! Also share your ideas and charts in the comments section below! This is best way to keep it relevant, support us, keep the content here free and allow the idea to reach as many people as possible. **
---
💸💸💸💸💸💸
👇 👇 👇 👇 👇 👇

GBPUSD: Bullish Trend To Continue Dominating! Dear Traders,
Overview of GBPUSD📊📈
🔺The US dollar is expected to continue declining, which will likely push our GBPUSD price to an all-time high. As the new year begins, we believe this will be a key level for traders to monitor.
🔺🔺GBP has been bullish against other currencies. Next week’s price behaviour will be crucial in this trade.
Entry, Exit And Take Profit💥
🔺🔺Enter as shown in the chart, using strict risk management. Set your take profit to swing one at 1.44. For your stop loss, set it below 200 pips only if that aligns with your strategy.
Team SetupsFX_

GBP/USD Price Outlook – Trade Setup📊 Technical Structure
FPMARKETS:GBPUSD GBP/USD continues to consolidate around the 1.3330 level after last week’s strong rebound, with price holding above the 1.3316–1.3326 support zone while repeatedly failing to break the 1.3358–1.3370 resistance zone. A descending trendline from prior highs continues to cap upside momentum, forming a compression pattern as the pair approaches the Federal Reserve decision.
The 4H structure suggests that price may retest the resistance zone once more before potentially rolling over. As long as GBP/USD stays below 1.3358–1.3370, bearish rejection scenarios remain likely. A decisive break above the trendline would shift momentum to the upside, while a break below 1.3316 opens the door toward deeper support.
🎯 Trade Setup
Idea: Sell from resistance, looking for rejection below the descending trendline.
Entry: 1.3358 – 1.3370
Stop Loss: 1.3372
Take Profit 1: 1.3326
Take Profit 2: 1.3316
Risk–Reward Ratio: ≈ 1 : 3.1
As long as price stays below the descending trendline and below 1.3370, the bearish setup remains valid. A 4H close above the resistance zone invalidates this scenario.
🌐 Macro Background
Markets are waiting for the Federal Reserve interest rate decision on Wednesday, and traders aren’t willing to push GBP/USD aggressively in either direction. The USD stays weak because investors expect the Fed to cut interest rates again, which lowers the dollar’s yield advantage and generally supports GBP/USD.
On the UK side, the end of budget uncertainty gives the British Pound some support. The UK government announced tax adjustments to stabilize public finances, helping calm investor concerns and giving GBP a firmer footing.
Overall, GBP/USD trades in a tight range because both sides—USD weakness from Fed expectations and GBP support from fiscal clarity—are balancing each other until the FOMC meeting provides new direction.
🔑 Key Technical Levels
Resistance Zone: 1.3358 – 1.3370
Support Zone: 1.3316 – 1.3326
Invalidation Level: 1.3372 (4H close above)
📌 Trade Summary
GBP/USD consolidates near 1.3330 as traders wait for the Fed. The technical picture favours selling the resistance zone at 1.3358–1.3372 due to trendline pressure and repeated rejection. However, macro factors remain mixed ahead of the FOMC decision. Downside targets sit at 1.3316 and 1.3316 unless price breaks above 1.3372 which would signal bullish continuation.
⚠️ Disclaimer
This analysis is for reference only and does not constitute trading advice. Trading involves significant risk, and proper risk management is essential.

GBPUSD on a multi-year decline that's far from being over.The GBPUSD pair is currently on a 5-week rebound following the November 03 Low just below its 1W MA50 (blue trend-line). Despite this short-term reaction, the general long-term trend remains bearish following the June 30 2025 High.
That High started a Double Top sequence that is similar to both previous Cycle Tops since January 22 2018. Even though this latest one didn't take place exactly on the Lower Highs trend-line, it was priced on the closest level to the 1M MA200 (red trend-line) since September 2014.
At the same time, the 1W RSI printed the exact same 8-year Resistance Zone rejection pattern as the previous 4 times. Based on the previous 2 Cycles, we expect the 1st Leg of this long-term correction to approach the 1W MA200 (orange trend-line) on a -7.64% (minimum) drop, targeting 1.2750. Then after a bounce to retest and get rejected on the 1W MA50, we expect it to aim then 9-year Symmetrical Support Zone at 1.2100.
---
** Please LIKE 👍, FOLLOW ✅, SHARE 🙌 and COMMENT ✍ if you enjoy this idea! Also share your ideas and charts in the comments section below! This is best way to keep it relevant, support us, keep the content here free and allow the idea to reach as many people as possible. **
---
💸💸💸💸💸💸
👇 👇 👇 👇 👇 👇

GBPUSD Bullish Breakout!
HI,Traders !
#GBPUSD is trading in an
Uptrend and the pair made
A bullish breakout of the
Key horizontal level of 1.31882
And the breakout is confirmed
So we will be expecting a
Further bullish move up !
Comment and subscribe to help us grow !
