GOLD fluctuates sharply as labor data weakensSpot OANDA:XAUUSD closed nearly flat at $4,203.06 an ounce, down less than 0.1%, after a volatile session in New York. A significantly weaker-than-expected ADP report sent gold soaring to $4,241.60 an ounce, before profit-taking pressure and a sharp reversal in silver sent prices quickly tumbling back to $4,195 an ounce.
As of writing today, Thursday, December 4, spot gold was trading at $4,202 an ounce, up about $10 on the day.
ADP data showed the US private sector lost 32,000 jobs in November, in stark contrast to expectations for a gain of 10,000, the sharpest decline since March 2023. Win Thin (Nassau 1982) assessed that the ADP index had weakened continuously, reflecting a sustained downward trend in the labor market. Nela Richardson (ADP) noted the widespread slowdown across all business groups, especially the small and medium-sized sector, a sign of more cautious consumers in the context of macro instability.
While gold rebounded in response to the data, silver, which had touched $58.97/ounce in the early session yesterday, then fell sharply to $57.83/ounce, dragging the entire group of precious metals into a short-term correction.
Trump’s unexpected move causes market turmoil: Will the Fed chairmanship change soon?
A new political variable emerged when the White House abruptly canceled the interview schedule for the Fed chairman candidate this week. The Wall Street Journal commented that this move shows that President Trump may have finalized his choice to succeed Powell.
The market immediately raised the possibility that the leading candidate is Kevin Hassett, the White House economic adviser, who is seen as leaning towards a strong interest rate cut stance. The weak USD and recent recovery in gold partly reflect expectations that Hassett may push for a deeper easing cycle after Mr. Powell ends his term in May next year.
Steve Englander (Standard Chartered) said Hassett has an “impressive” track record, but worries about the Fed’s independence under political pressure. The Financial Times said bond investors have expressed concerns to the US Treasury that Hassett may prioritize short-term growth over price stability.
CME FedWatch currently prices an 89% chance of a Fed rate cut at its December 9-10 meeting. Markets are still waiting for September core PCE data, delayed until Friday, a key piece of the inflation puzzle.
Fundamental Outlook: Lower Yields Boost Gold, But Correction Risks Not Over
Given that gold is not yielding, expectations of QE are the central support. However, the combination of weak data, silver volatility and profit-taking pressure suggests that the road ahead for gold will be bumpy.
Macro trends – weak labor, softer USD, and political uncertainty surrounding the Fed Chair – continue to favor price support. But until we break above $4,400/oz with convincing liquidity, the momentum for acceleration will remain at the potential level.
Technical analysis and recommendations OANDA:XAUUSD
Gold is operating in a new bullish cycle: the price remains above the medium-term rising channel, making successive higher lows and closing above the short-term moving averages, indicating active buying.
The important support zone around $4,128–$4,130 (Fibo 0.236) is well defended; if maintained, the short-term bullish structure remains intact.
The RSI has recovered from the neutral zone, implying that the upside momentum is still strong but not overbought. The bullish scenario is complete when the price remains above the short-term MA21, does not break below $3,972–$3,973 (Fibo 0.382) and moves towards challenging the resistance zone of $4,300–$4,380 (channel top/Fibo extension).
Cyclical risk: a break below $3,972 would weaken the structure and could drag the price to a test of $3,846–$3,720.
SELL XAUUSD PRICE 4231 - 4229⚡️
↠↠ Stop Loss 4235
→Take Profit 1 4223
↨
→Take Profit 2 4217
BUY XAUUSD PRICE 4141 - 4143⚡️
↠↠ Stop Loss 4137
→Take Profit 1 4149
↨
→Take Profit 2 4155
Gc1!!

GOLD ANALYSIS 12/04/20251. Fundamental Analysis:
a) Economy:
• USD:
The USD is recovering slightly after a strong decline earlier this week, mainly due to profit-taking flows from gold and bonds. However, the overall trend of the USD remains weak because the market believes the Fed will keep interest rates low and maintain the rate-cutting cycle to support economic growth.
• U.S. Stock Market:
U.S. equities are rising modestly thanks to expectations of a rebound in Q4 corporate earnings and capital rotating back into the tech sector. This reduces safe-haven demand, but the bullish momentum is not strong enough to exert significant downward pressure on gold.
• FED:
The Fed continues to signal a dovish stance, prioritizing economic stability over inflation control. The market is pricing in the possibility of two rate cuts in 2026, providing strong support for gold.
• TRUMP:
The Trump administration is pushing aggressive stimulus packages and trade-protection policies. Uncertainty surrounding tax strategies and pressure on China–Mexico is creating a mild risk-off sentiment, supporting gold.
• Gold ETF (SPDR):
SPDR continued to sell 1.71 tons yesterday → a slightly negative signal, indicating institutional outflows from gold as prices approached all-time highs → mildly bearish for gold.
b) Geopolitics:
• Ongoing instability in the Middle East and Venezuela, with small conflicts occurring frequently.
• U.S.–China tensions persist over technology and trade.
These factors maintain a cautious market tone and form a supportive foundation for gold to rebound.
c) Market Sentiment:
The market is in a mildly risk-on state, but not stable. Funds still move into gold as a defensive asset whenever the USD or equities show signs of profit-taking.
→ Gold continues to trade within a range, but with a bullish bias.
Asian markets are entering the year-end physical-gold buying season → supportive for gold.
2. Technical Analysis:
Trend:
• Price is holding above the rising trendline.
• MA20 – MA50 are about to cross upward → signal of short-term recovery.
• RSI is rebounding from the 30 zone → selling pressure has weakened.
Pattern:
• The U.S. session bottom has formed → price is retesting the trendline and building a new bullish structure.
• Scenario: a pullback to the trendline followed by a bounce.
RESISTANCE: 4,229 – 4,241 – 4,264
SUPPORT: 4,206 – 4,194 – 4,186
3. Yesterday’s Market (03/12/25):
• Gold moved sideways gently within a 45-dollar range.
→ The bearish structure was rejected and left a long wick → a signal that buyers have returned.
4. Trading Strategy for Today (4/12/25):
🪙 SELL XAUUSD | 4232 – 4230
SL: 4236
TP1: 4224
TP2: 4218
🪙 BUY XAUUSD | 4171 – 4173
SL: 4167
TP1: 4179
TP2: 4185

GOLD ANALYSIS 12/05/20251. Fundamental Analysis
a) Economy
• USD:
The USD is weakening as the market expects the Fed to maintain its dovish, rate-cut stance in December.
• U.S. Stocks:
U.S. equities are rising on expectations of rate cuts in late 2025, but the rally lacks sustainability due to weak liquidity.
U.S. bond yields are slightly declining → easing pressure on gold.
This creates a mild risk-on environment, but not enough to push gold down strongly.
• Fed:
The Fed remains dovish, with a high probability of rate cuts in Q1/2026 → supportive for gold.
Recent Fed members’ comments lean toward “monitoring but not tightening,” further reducing pressure on precious metals.
• Trump Administration:
The Trump administration is focusing on domestic production support and corporate tax cuts.
However, tensions stirred by Trump in Venezuela and the Middle East provide geopolitical risk that supports gold.
• Gold ETF (SPDR):
SPDR bought an additional 4 tons yesterday → highest reserves in the past 2 months.
This is a strong bullish signal, indicating large capital inflows returning to the gold market.
b) Politics
The Middle East remains tense.
Venezuela – U.S. – China are experiencing conflicting strategic interests.
Escalating tensions push the market toward safe-haven assets → supportive for gold.
c) Market Sentiment
Mild risk-off: defensive flows are increasing, especially as USD weakens and SPDR buys more gold.
Investors are waiting for tomorrow’s Nonfarm Payroll data → gold likely to remain in a tight sideways range like recent sessions.
2. Technical Analysis
• Overall trend:
Gold is compressing within a short-term triangular consolidation pattern.
Short-term MAs are converging → market preparing for a strong breakout.
• Scenarios:
Scenario 1 – Bullish (Primary expectation):
Break above 4239 → 4263
→ Target: 4320
→ If 4320 breaks → price may reach a new all-time high.
Scenario 2 – Bearish deeper correction:
If price breaks 4174 → it may drop to 4120, aligning with the long-term rising trendline.
Scenario 3 – Sideways (likely before Nonfarm):
Price continues moving within the consolidation triangle
→ corresponds to weak liquidity this week.
RESISTANCE: 4239 – 4263 – 4320
SUPPORT: 4174 – 4163 – 4120
3. Yesterday’s Market (Dec 4, 2025)
Gold dipped slightly then rebounded thanks to ETF buying and a weaker USD.
Narrow trading range → consistent with a “waiting for major news” environment.
No strong selling pressure, suggesting buyers are still in control.
4. Trading Strategy Today (Dec 5, 2025)
🪙 SELL XAUUSD | 4264 – 4262
SL: 4268
TP1: 4256
TP2: 4250
🪙 BUY XAUUSD | 4182 – 4184
SL: 4178
TP1: 4190
TP2: 4196

GOLD ANALYSIS 13/02/2025Fundamental Analysis:
a) Economy:
• USD:
The USD slightly rebounded after a deep decline due to profit-taking flows during the week, but the broader trend remains weakening as the market expects the FED to keep or cut rates in upcoming meetings, supporting gold.
• US Stock Market:
Wall Street rose slightly; capital is leaning toward risk assets but not strongly. This prevents gold from being heavily sold and helps maintain stable buying momentum.
• FED:
FED officials signal maintaining a stable policy stance, with no signs of rate hikes returning. This continues to support gold in the medium term.
• TRUMP:
The Trump administration is applying trade pressure in multiple regions, creating a certain degree of uncertainty → gold benefits from geopolitical risks.
• Gold ETF (SPDR):
SPDR sold 1.72 tons as a probing move yesterday, showing institutional profit-taking. A negative signal for gold.
b) Politics:
• Geopolitical tensions in the Middle East and several hotspots remain unstable.
• New tensions in Europe regarding energy and borders.
→ These factors support gold in maintaining its upward bias.
c) Market Sentiment:
• The market is in a mild risk-off state, with defensive flows returning after yesterday’s sharp 70-dollar drop.
• Strong dip-buying appeared densely around the support area, causing price to rebound quickly.
• Gold demand in Asia rises during the year-end season, supporting gold.
→ Current sentiment leans toward buying when price corrects.
Technical Analysis:
M15 timeframe:
• Gold sharply flushed 70 dollars down to the support zone at 4,164 and bounced back.
• The bullish structure remains intact, not yet broken.
• MA20 – MA50 are converging, preparing to restore upward momentum.
• RSI bounced from the 30 zone → showing a clear counterattack from buyers.
• The neckline around 4,186 is being retested.
• If it breaks above 4,231 → next targets: 4,274 → 4,320 → 4,380.
→ Overall, the model still signals a continuing uptrend; yesterday’s drop was only a market reset.
→ When gold flushes, do not catch the falling knife, do not chase sells (Sell orders are dangerous because selling comes from panic, buying comes from greed). Wait for price to hit strong support and show bullish signals, then buy strongly. Still captures the move but safely.
RESISTANCE: 4,231 - 4,274 - 4,320
SUPPORT: 4,200 - 4,186 - 4,164
Market Recap (Dec 2):
• Gold dropped sharply by 70 dollars due to profit-taking and thin liquidity in the US session.
• Then it rebounded strongly, proving the uptrend has not been broken.
• SPDR’s probing sell indicates gradual profit-taking near ATH.
Strategy for Today (Dec 3):
🪙 SELL XAUUSD | 4277 – 4275
SL: 4281
TP1: 4269
TP2: 4263
🪙 BUY XAUUSD | 4191 – 4193
SL: 4187
TP1: 4199
TP2: 4205

GOLD breaks out of accumulation phaseOANDA:XAUUSD has moved from a consolidation phase to an active bull run: spot is trading around ~$4,200/oz, supported by expectations of Fed easing (markets are pricing in ~89% probability of a 25bp cut in December), central bank buying and a still uncertain geopolitical backdrop. In this context, a $5,000/oz target is no longer a pipe dream but a conceivable scenario, but only if a number of technical and fundamental conditions align.
Analysis (fundamentals — geopolitics)
1. Fundamentals: Central banks’ net buying (WGC: strong net buying), a weaker USD and falling real Treasury yields are the three fundamentals supporting gold. Recent weak US economic data (weak manufacturing PMI, ADP and PCE potentials reinforce cooling sentiment) push the market to price in higher interest rate cuts, reducing the opportunity cost of holding gold.
2. Geopolitics: Russia-Ukraine negotiations remain uncertain; regional tensions (Middle East, US-Venezuela relations…) maintain safe-haven demand. External shocks could spur rapid and strong demand for gold.
Conditions for the $5,000 scenario (necessary & sufficient)
• Necessary: The Fed makes at least one 25 bps cut in the near term (December) or the market is certain of a rate cut cycle; real yields continue to fall; the USD remains weak; the central bank continues to buy net.
• Sufficient: Price breaks the $4,216–$4,226 resistance zone on higher than average volume, accompanied by a sustained decline in real yields (-real basket) and no sharp reversal in the USD. When all three factors (technical break, real yield decline, sustained official demand) are present, the $5,000 target becomes a trackable possibility in the medium-long term.
Risks
Bear case risks include: the Fed unexpectedly takes a hard/clear stance without cutting, the USD strengthens again (e.g. due to better employment data), or market liquidity declines leading to massive profit-taking by funds. These factors could push gold back below $4,000 and break the short-term bullish structure.
In summary, the journey to $5,000 is a structurally plausible scenario: the macro fundamentals and the official demand flow are tilted to the upside, but that scenario will only be triggered by a volume-driven technical breakout combined with a sustained decline in real yields. I maintain a cautiously positive stance, closely monitoring the underlying geopolitical developments and yield developments to assess the sustainability of this rally.
Technical analysis and recommendations OANDA:XAUUSD
Gold price is maintaining a clear bullish structure as it continues to follow the medium-term rising channel and holds the important support zone around 4,128 – 4,130 USD/ounce (Fibo 0.236). The price continuously making higher lows and bouncing back above the short-term MA shows that active buying power is still dominant. The most recent candlestick pattern shows strong absorption at the support zone, implying that money flow is protecting the uptrend.
With no break below 3,973 USD/ounce (Fibo 0.382), the bullish structure continues to be consolidated. The next target of the current cycle is 4,300 – 4,380 USD/ounce, corresponding to the top of the rising channel and the extended Fibo zone. RSI is recovering from the neutral zone, showing that the upside momentum still has room to grow.
SELL XAUUSD PRICE 4277 - 4275⚡️
↠↠ Stop Loss 4281
→Take Profit 1 4269
↨
→Take Profit 2 4263
BUY XAUUSD PRICE 4191 - 4193⚡️
↠↠ Stop Loss 4187
→Take Profit 1 4199
↨
→Take Profit 2 4205

GOLD, silver climb as Fed enters decisive phaseOANDA:XAUUSD and OANDA:XAGUSD began December with sharp moves, reflecting the intersection of U.S. monetary policy expectations, weak growth pressure, and rising defensive sentiment across global markets.
Spot gold touched USD 4,264/oz, the highest level in six weeks, while silver surged to USD 58.82/oz, marking a historic record. This price momentum is driven not only by a weakening U.S. dollar and prospects of rate cuts, but also by strategic repositioning among funds ahead of a data-heavy week.
Rate-cut expectations have become the central catalyst, with markets pricing in a near-certain reduction in December. Dovish remarks from Fed officials—from Waller to Williams—together with soft manufacturing data reinforce the argument that growth risks are rising faster than inflation risks. Gold has reacted quickly, especially as the Dollar fell to a two-week low before recovering slightly.
Silver, meanwhile, is following a completely different trajectory. Since the start of the year, silver has risen over 100%, benefiting from both safe-haven demand and industrial demand—particularly from electronics and solar energy. Silver’s high sensitivity to policy expectations, combined with speculation about a more dovish-leaning Fed under potential new leadership, is making it difficult for the market to find equilibrium. The fact that White House economic adviser Kevin Hassett is viewed as a possible Fed Chair nominee further increases downward pressure on the Dollar—an effect silver responds to even more strongly than gold.
At the same time, U.S. PMI manufacturing data continues to show economic fatigue, with the November index falling to 48.2, marking the ninth consecutive month below the 50 threshold. Declining new orders, rising input costs, and increasing import-tariff risks are creating a more challenging policy environment for the Fed. And all of this comes just as markets await a wave of high-impact data: ADP employment, and PCE inflation, the Fed’s preferred metric.
In the bond market, a sharp adjustment took place following comments by BOJ Governor Kazuo Ueda, who hinted at possible rate hikes—rare after decades of ultra-easing. Japanese yields surged, transmitting upward pressure to U.S. bonds: the 10-year Treasury yield jumped to 4.096%, the strongest move since mid-July. Meanwhile, U.S. corporations like Merck returning to the market with large bond issuances (USD 8 billion) forced dealers to sell Treasuries for hedging, amplifying volatility.
Another layer of uncertainty comes from the search for the next Fed Chair, with expectations that the White House will make a decision before Christmas. Traders are closely monitoring this because it directly influences the rate path for 2026. The Dollar just had its worst week in four months, and a dovish appointment could extend the decline.
On the geopolitical front, the White House expressed “cautious optimism” about reaching a resolution to the Russia–Ukraine conflict following discussions with Ukrainian officials in Florida. While these signals slightly reduce systemic risk, they remain insufficient to reverse safe-haven demand for precious metals.
I believe the gold–silver market is entering a high-volatility phase, but the bullish structure remains intact.
Rate-cut expectations, a weaker Dollar, and soft economic data continue to form the three core pillars supporting prices. However, rising bond yields and uncertainty over Fed leadership may interrupt the upward momentum in the short term. Powell’s speech this week will serve as an important guidepost, particularly for Q1 2026 rate expectations.
From a strategic perspective, investors should closely monitor employment data, PCE, and bond-market dynamics. In an environment where the monetary-policy cycle is pivoting, gold remains a portfolio hedge, while silver continues to be the asset most reactive to market sentiment and macro expectations—high return, but also higher risk.
Technical analysis and suggestions to follow OANDA:XAUUSD
The main trend of gold remains structurally bullish. The series of higher lows (HL) and higher highs (HH) is intact, supported by the medium-term rising channel and the 0.236–0.382 Fibonacci retracement cluster is acting as a defensive zone. The price is currently trading around $4,223/oz, above the dynamic MA21 and maintaining the bullish market status.
Main Support Zones
• $4,128 – $4,130 (Fib 0.236): the nearest support zone and the boundary of the uptrend.
• $3,972 (Fib 0.382): stronger support; a break below would open a medium-term correction.
• $3,846 (Fib 0.5): the level that protects the large bullish structure.
Resistance – upside target
• 4,380 – 4,390 USD (Fib extension + upper limit of rising channel): next upside target if price holds above 4,128 USD.
• In case of strong momentum (RSI is recovering from the technical oversold zone), the possibility of price moving up to 4,450 – 4,500 USD is not excluded.
Bearish risk conditions
Correction risk is formed only when:
1. Price closes below 4,128 USD, signaling short-term weakness.
2. Breaks 3,972 USD, the mid-term bullish structure is violated, opening a downside zone to
o 3,846 USD,
o or deeper than 3,720 USD (Fib 0.618).
3. RSI fails to surpass the 50 zone.
If the above 3 conditions occur at the same time, the bullish momentum will temporarily lose its dominance.
SELL XAUUSD PRICE 4329 - 4327⚡️
↠↠ Stop Loss 4333
→Take Profit 1 4321
↨
→Take Profit 2 4315
BUY XAUUSD PRICE 4178 - 4180⚡️
↠↠ Stop Loss 4174
→Take Profit 1 4186
↨
→Take Profit 2 4192

GOLD ANALYSIS 12/02/20251. Fundamental Analysis:
a) Economy:
• USD:
The USD is seeing a mild rebound after a strong decline, mainly technical in nature, with no sufficiently strong data to reverse the trend. This only creates short-term pressure on gold.
• U.S. Stock Market:
U.S. markets are mixed due to concerns over slowing corporate earnings. This cautious sentiment is shifting capital flows toward gold.
• Federal Reserve (FED):
The FED maintains a dovish stance, prioritizing economic stability and considering rate cuts. This continues to support gold.
• Trump Administration:
The Trump administration is taking a tougher stance toward several countries, increasing geopolitical uncertainty and boosting safe-haven demand.
• Gold ETF – SPDR:
SPDR has been buying strongly for two consecutive sessions, reinforcing the medium-term uptrend for gold — a highly important factor.
b) Politics:
Multiple geopolitical hotspots occurring simultaneously:
• Ongoing Middle East conflict
• Intensifying strategic competition in Asia
• Russia–Ukraine tensions unresolved
• Venezuela–U.S. relations becoming a new focal point as the Trump administration takes a tougher stance
→ Overall: Risk-off sentiment rises sharply, benefiting gold.
c) Market Sentiment:
Safe-haven sentiment continues to dominate. Investors are reducing risk, pulling out of equities, and pouring into gold — especially with strong SPDR inflows. Asia is also entering its seasonal year-end gold-buying cycle.
2. Technical Analysis:
• Gold has broken out of a major wedge pattern and is currently retesting the breakout area.
• Price is trading above short-term moving averages, showing a clear bullish trend.
• The market is expected to retest the 4186–4190 zone before pushing higher again.
• Next target zones: 4274 → 4320 → 4380.
• M15 RSI is slightly oversold → suitable for a technical bounce.
RESISTANCE: 4,274 – 4,320 – 4,380
SUPPORT: 4,186 – 4,146 – 4,095
3. Previous Market Session (01/12/25):
• Gold maintained its primary uptrend, with only mild corrections that did not break structure.
• SPDR continued buying → confirms real demand.
• USD’s slight rebound did not significantly affect the overall bullish momentum.
• Gold dropped to the opening price at 4,217 and then surged back up to 4,264.
4. Trading Strategy for Today (02/12/25):
🪙 SELL XAUUSD | 4241 – 4239
SL: 4245
TP1: 4233
TP2: 4227
🪙 BUY XAUUSD | 4178 – 4180
SL: 4174
TP1: 4186
TP2: 4192

Gold Update 02DEC2025: Multiple Options Are PossibleThe price has been stuck in the range as expected for wave 4
Let’s navigate this chaos and build viable paths on the chart
Option 1: Ending Diagonal wave 5 — pink marks
This option is based on the idea that wave 4 looks disproportionately large compared to wave 2
It could already be over after the first large move down to the $3,900 area
The current ascending zigzag may be shaping an Ending Diagonal in wave 5 to retest the former top around $4,400
Option 2: Triangle — orange marks
I left this path on the chart last time for visualization and it still could play out
Waves A and B could be completed with waves C, D, E ahead
Option 3: Large sideways consolidation (range, box) — white marks
This scenario implies a flat correction within the established $4,400–$3,900 range
Which path do you think the price will take?
Share your thoughts in the comments below

GOLD ANALYSIS 12/01/20251. Fundamental Analysis:
a) Economy:
• USD:
The USD continues to weaken as the market prices in Fed rate cuts in 2026. The downward pressure on the dollar provides strong support for gold.
• U.S. Stocks:
U.S. equities edged higher on rate-cut expectations, but the gains are modest → cash flow is not fully risk-on, so gold maintains its safe-haven role.
• FED:
The Fed has signaled the end of its tightening cycle and opened the door to rate cuts starting in Q1/2026 → a strong medium-term catalyst for gold.
• TRUMP:
The Trump administration prioritizes increased defense spending, tax cuts, and tighter trade policies against China. This increases geopolitical risks → continues to support gold prices.
• Gold ETF – SPDR:
SPDR remains inactive, neither buying nor selling. During a long-term uptrend, the fact that SPDR is not selling is a positive signal.
b) Politics:
• Middle East tensions rising again.
• Russia–Ukraine conflict not cooling down.
• U.S.–China trade tensions may escalate.
• China–Japan tensions: Coast guard vessels from both countries repeatedly approach the Senkaku Islands. Japan is increasing military cooperation with the U.S., and China is responding strongly.
• The Trump administration is increasing pressure on Venezuela, threatening to re-impose heavy sanctions if no policy changes occur.
→ Geopolitical risks are rising, continuing to support gold prices.
c) Market Sentiment:
• Market sentiment is neutral–bullish.
• Geopolitical risks + Fed pivot expectations help maintain defensive cash flow.
2. Technical Analysis:
• Gold has broken out of the consolidation triangle and is retesting the previous resistance trendline → now acting as support.
• MA50 & MA20 are trending upward, indicating sustained bullish momentum.
• The 4,186 – 4,200 zone is an ideal retest area for price to rebound.
• Short-term targets: 4,274 → 4,300 → 4,380.
• Only if price breaks below 4,146 will the short-term trend weaken.
Overall technical view: Uptrend established – wait for retest to BUY safely.
RESISTANCE: 4,244 – 4,274 – 4,380
SUPPORT: 4,186 – 4,146 – 4,095
3. Previous Market Session (28/11/25):
• Gold traded in a narrow range, tested the upper trendline, and bounced back.
• No major movement due to lack of big news and SPDR staying inactive.
• Buyers maintain underlying support but not yet strong enough for a breakout.
• Price action mainly technical-driven.
4. Strategy for Today (01/12/25):
🪙 SELL XAUUSD | 4277 – 4275
SL: 4281
TP1: 4269
TP2: 4263
🪙 BUY XAUUSD | 4191 – 4193
SL: 4187
TP1: 4199
TP2: 4205

XAUUSD Another correction below 3900 is likely.Last week (November 24, see chart below), we gave a buy signal on Gold (XAUUSD), which has already hit Target 1 at $4180 and is about to hit Target 2 at $4275:
This time we move on to the longer time-frames, namely the 1W, where Gold's 2-year Channel Up suggests that another correction is likely at this point.
The reason is the 1D MA100 (black trend-line), which Gold has hit 3 times out of the 4 corrections it has had within this 2-year pattern. October's pull-back saw it pull-back just above the 1D MA50 (red trend-line) but it didn't break, something that always happened during these past corrections.
At the same time, it is very likely to hit the 0.382 Fibonacci retracement level (has done so 2 out of 4 times) once the 1D MA100 contact is made, which gives us a medium-term Target at $3860. That would make a perfect Higher Low on the Channel Up.
Notice also how during the past 3 corrections, the 1W RSI always hit the Support Zone. If this is get hit before the price reaches $3860, it is technically a good idea to take profit earlier.
---
** Please LIKE 👍, FOLLOW ✅, SHARE 🙌 and COMMENT ✍ if you enjoy this idea! Also share your ideas and charts in the comments section below! This is best way to keep it relevant, support us, keep the content here free and allow the idea to reach as many people as possible. **
---
💸💸💸💸💸💸
👇 👇 👇 👇 👇 👇

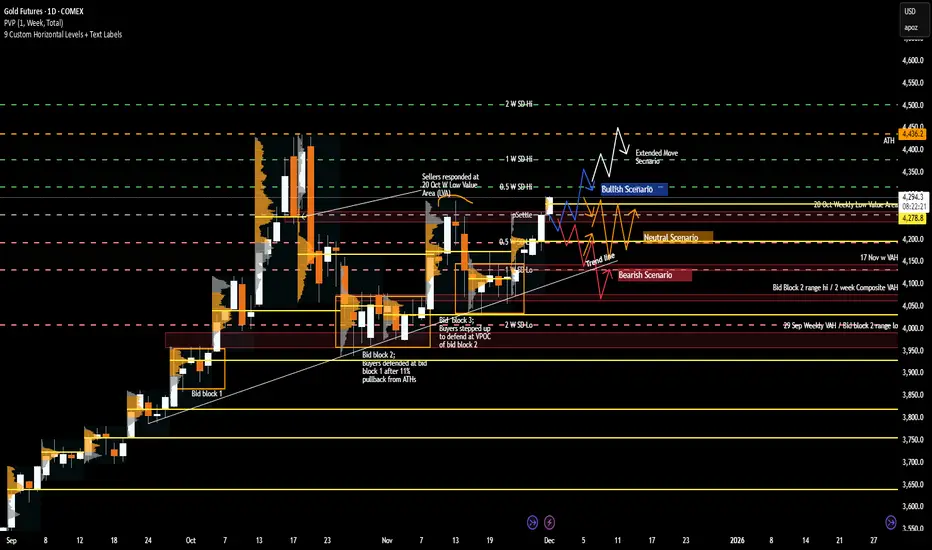
Gold Weekly Playbook: Key Levels, Scenarios & Sentiment Triggers1. Macro Update
Gold continues to trade within a macro environment defined by shifting rate expectations and evolving recession probabilities. With the Fed maintaining a data-dependent stance, the market remains highly sensitive to inflation and employment prints. Cooling inflation supports the case for rate cuts, pulling real yields lower and creating a constructive backdrop for gold.
Conversely, stubborn inflation pushes the narrative toward “higher for longer,” often slowing upside momentum and encouraging more rotational price action. This doesn’t immediately turn GC bearish, but it does cap impulsive continuation as traders reassess forward guidance.
Recession sentiment is the second major driver. Rising recession odds tend to benefit gold as investors rotate into safe-haven assets, even without imminent Fed easing. A persistent soft-landing narrative—stable labor markets, steady consumption—can reduce defensive flows and temper gold’s velocity. Overall, the macro backdrop remains cautiously supportive, but still very catalyst-driven.
2. What Has the Market Done?
Gold has exhibited constructive price action, with the recent week imbalancing up and out of the 17 Nov weekly balance/value area. Importantly, the market closed at the highs of the week, signaling sustained buyer aggression and broad acceptance of higher prices.
Weekly value and Volume point of Control (VPOC) have shifted upward, reinforcing a meaningful change in participant behavior: buyers are willing to transact at progressively higher prices, and sellers have not shown the ability to force price back into prior balance. This upward migration of value marks a firm shift in short-term sentiment.
The market is also now at an important structural zone at 4251.3—the 13 Oct weekly VPOC and the 20 Oct weekly Low value area (LVA). How the market reacts at this level—rejecting, stalling, or accepting—will be a telling indicator of whether buyers maintain control or whether sellers can slow the advance.
3. What to Expect in the Coming Week
The key level to watch this week:
4254.9 - Previous week/month’s settlement price
This level acts as a major pivot for directional conviction. Holding above settlement supports the case for continuation; a sustained move below it increases the likelihood of rotation or deeper testing.
Bullish Scenario
If the market holds and accepts above 4254.9, upside continuation becomes likely.
Target 1: 4378.6 (Weekly 1 Standard Deviation (SD) High) – expect responsive sellers.
If market accepts above 4378.6:
Target 2: 4436.2 (ATH region) – extended bullish objective.
Bearish Scenario
If the market fails to hold above 4254.9, expect sellers to target 4195.3 (previous week’s VPOC).
Additional downside triggers:
If buyers cannot reclaim 4261.3 (previous week’s high), pressure may push price through prior value toward 4136.5.
If buyers then fail to reclaim back above 4195.3:
Next target: 4131.2 (Weekly 1 SD Low / 17 Nov VPOC / Bid Block 3 midpoint).
Continued seller control may extend the move toward 4070/80, aligned with the 2-week composite VAH and upper boundary of Bid Block 2.
Neutral Scenario
If neither buyers nor sellers show conviction, expect two-way consolidation around previous week’s settlement, 4254.9, between 4316.7 and 4193.1 (10 Nov weekly high / 20 Oct LVA / weekly 0.5 SD high).
This remains the most probable balance zone unless a macro catalyst drives breakout behavior.
This week’s structure is clean: one major pivot and clearly defined pathways for both sides. Whether GC breaks out or slips back into rotation will hinge on how price behaves around 4254.9.
What’s your outlook for Gold this week? Drop a comment and give this post a boost so more traders in the community can join the discussion!
Disclaimer: This is for educational purposes only and not financial advice. Always trade your own plan with proper risk management.
XAU — H8 (01-12-2025) | Bullish Bias — Follow the Extensions🔔 XAU — H8 (01-12-2025) | Bullish Bias — Follow the Extensions
From my perspective, the market appears to have completed red wave 4 from the high at 4381.73, forming a contracting triangle ABCDE (yellow) with the final low at 4022.57.
After that, price continued to push higher into red wave 5. Within this move, I can identify five smaller blue impulsive waves, forming white wave 1. Price may extend a bit higher to complete white wave 1, before pulling back into white wave 2.
Primary Scenario: Wait for white wave 2 to complete, then look for buy opportunities in alignment with white wave 3 of red wave 5.
Invalidation: Price breaks below 4022.57 → wave count must be re-evaluated.
Trade Tips: Wait for clear price-action confirmation, use a tight stop-loss, and maintain strict risk management. 📈🛡

GOLD: Bullish! Look For Valid Buys!In this Weekly Market Forecast, we will analyze the Gold (XAUUSD) for the week of Dec. 1-5th.
Gold rallied last week, breaking the rangy consolidation. The strong close indicates the potential for some bullish follow through going into this week.
Look for valid buys.
Enjoy!
May profits be upon you.
Leave any questions or comments in the comment section.
I appreciate any feedback from my viewers!
Like and/or subscribe if you want more accurate analysis.
Thank you so much!
Disclaimer:
I do not provide personal investment advice and I am not a qualified licensed investment advisor.
All information found here, including any ideas, opinions, views, predictions, forecasts, commentaries, suggestions, expressed or implied herein, are for informational, entertainment or educational purposes only and should not be construed as personal investment advice. While the information provided is believed to be accurate, it may include errors or inaccuracies.
I will not and cannot be held liable for any actions you take as a result of anything you read here.
Conduct your own due diligence, or consult a licensed financial advisor or broker before making any and all investment decisions. Any investments, trades, speculations, or decisions made on the basis of any information found on this channel, expressed or implied herein, are committed at your own risk, financial or otherwise.

GOLD bounces back amid Fed signals and political turmoilOANDA:XAUUSD opened the Asian trading week with strong upward momentum, reflecting rising confidence that the Federal Reserve will cut interest rates as early as December. Spot gold reached $4,256.31/oz, gaining $37 within just a few hours — the highest level in five weeks.
Shifting rate-cut expectations remain the dominant driver. A series of dovish comments from Fed officials, combined with weakening economic data following the U.S. government shutdown, has led the market to price in an 87% probability of a rate cut, according to FedWatch. As the opportunity cost of holding gold decreases, capital is rapidly flowing into non-yielding safe-haven assets.
Long-term support remains intact: accelerating purchases by central banks and significant inflows into gold ETFs helped push prices to a historical peak of $4,380/oz in October. With an almost uninterrupted rally since the start of the year, gold is on track for its strongest annual performance since 1979.
However, the monetary-policy outlook is clouded by political uncertainty. President Trump announced he had chosen a successor to Chairman Jerome Powell and asked the nominee to commit to a more aggressive rate-cutting cycle.
Kevin Hassett, a senior White House economic advisor, is now estimated by markets to have a 64% probability of being appointed — a sharp rise from last week. A more politically influenced Fed could increase volatility across asset markets.
On the geopolitical front, early signs of reconciliation between the U.S. and Ukraine have temporarily reduced safe-haven demand, but not enough to slow gold’s upward momentum. Washington’s decision to send envoy Steve Witkov to Moscow this week signals a new diplomatic phase, though risk levels remain elevated.
Today’s main focus is the ISM Manufacturing PMI. A stronger-than-expected reading may support the USD in the short term, slowing gold’s advance. Conversely, weaker data would reinforce rate-cut expectations and continue to support the metal’s upward trend.
With rapidly changing policy expectations, firm technical momentum, and persistent geopolitical risk, the gold market enters December with a clearly bullish structure — but also heightened sensitivity as the Fed and the White House reshape policy direction simultaneously.
Technical Analysis & OANDA:XAUUSD Outlook
• Trend structure: Price is maintaining a medium-term ascending channel, continuously forming higher lows and higher highs, indicating that the primary uptrend remains intact.
• Key level has been reclaimed: Price closed above the 4,128–4,216 USD resistance zone (Fib 0.236 and horizontal resistance), while also holding above the short-term MA21. This satisfies both the necessary condition (holding above support/trendline) and the sufficient condition (breaking and confirming a key resistance zone) for an uptrend cycle to be considered underway.
• Momentum indicators: RSI has recovered above the mid-range and is not yet overbought, suggesting there is still room for upside momentum.
• Technical conclusion: With a close and sustained move above 4,216 USD, the bullish structure is confirmed. The next immediate technical target is to retest the all-time high around ~4,380 USD/oz, with the next extension zone near 4,500 USD in a strong capital-inflow scenario.
SELL XAUUSD PRICE 4331 - 4329⚡️
↠↠ Stop Loss 4335
→Take Profit 1 4323
↨
→Take Profit 2 4317
BUY XAUUSD PRICE 4191 - 4193⚡️
↠↠ Stop Loss 4187
→Take Profit 1 4199
↨
→Take Profit 2 4205

GOLD MARKET ANALYSIS AND COMMENTARY - [Dec 01 - Dec 05]This week, international OANDA:XAUUSD prices rose from 4,040 USD/oz to 4,226 USD/oz and closed at 4,219 USD/oz.
Gold prices continued to rise this week because the market is “betting” that the FED will cut interest rates this coming December. In addition, gold demand surged in China as inventories at the Shanghai Gold Exchange (SGE) fell to their lowest level in a decade.
In reality, the slowdown in private-sector job growth and limited data from the U.S. government indicate weak economic activity and subdued inflation. This will continue to fuel expectations of a FED rate cut.
Next week, the market will receive several important data releases. On Monday, attention will be on the ISM Manufacturing PMI for November, followed by the ISM Services PMI on Wednesday, along with ADP private-sector employment data for October, which will be monitored more closely than usual due to the absence of NFP data. On Thursday, the U.S. will release weekly jobless claims, core PCE, and the preliminary University of Michigan Consumer Sentiment Survey for December.
📌Technically, on the H4 chart, the gold price has broken through the Downtrend line and is moving towards the next resistance zone around 4245. If it breaks this level, the gold price will approach the 4370-4380 zone. If it fails to break the 4245 barrier, the gold price will likely move sideways within the 4045-4245 range.
SELL XAUUSD PRICE 4276 - 4274⚡️
↠↠ Stop Loss 4280
BUY XAUUSD PRICE 4178 - 4180⚡️
↠↠ Stop Loss 4174

GOLD breaks above $4,190, time to exit accumulation4,190 USD/oz is a temporary step forward, with price testing the upper boundary amid thin liquidity (holiday period) and sharply rising expectations of Fed easing. However, confirming an uptrend requires a daily close above the stronger technical resistance zone (around 4,216 USD) and sustaining that level.
Reasons not to rush to confirm a “breakout from the accumulation range”
• The 4,190 USD level appeared during a low-liquidity session, making it prone to “false breaks” caused by thin trading.
• Recent volatility has been driven largely by monetary policy expectations (FedWatch ~80% probability of a December rate cut) rather than any immediate fundamental shift in gold’s supply–demand balance. Expectations can reverse quickly if Fed outlook or economic data changes.
• Geopolitical scenarios (Ukraine, Middle East) and central bank gold demand provide medium–long-term support, but these are “slow” drivers and cannot replace the need for technical confirmation to start a new bull phase.
Elements supporting a breakout (if sustained)
• Dovish comments from Fed officials (Waller, Daly, Williams) continue to reinforce rate-cut bets, while news about the potential Fed Chair candidate (Hassett) increases expectations of easier policy.
• Stable physical demand from Asia (India has recently kept importing strongly at ~14.7B USD) and steady official purchases by central banks.
• Rising global risk sentiment (shift into safe-haven assets) may push gold above 4,200 if accompanied by stronger Fed-easing signals.
Warning factors for a pullback (downside risks)
• Unexpectedly strong U.S. economic data (labor, retail sales) may reduce rate-cut expectations, pushing USD/yields higher and pressuring gold lower.
• Thin holiday liquidity increases the risk of gaps and exaggerated moves.
Outlook:
If policy conditions and geopolitics continue to support (dovish Fed + geopolitical risk), gold has a high probability of breaking out from the accumulation range and starting a true bullish cycle before/early 2026. In the short term (a few sessions to a few weeks), the market remains vulnerable to fake-outs.
Technical Analysis – OANDA:XAUUSD
Gold price has surpassed the 4,190 USD/oz zone—a positive sign but not yet enough to confirm a new uptrend.
Structurally, price remains within the medium-term ascending channel, holding above the trendline and above the short-term MA21 (~4,056 USD).
Notable Fibonacci levels:
• 0.236 ≈ 4,128 USD
• 0.382 ≈ 3,973 USD
The 3,970–4,000 USD zone remains a major support shield.
RSI is recovering from the neutral region (not overbought), showing the uptrend has a foundation but hasn't accelerated.
Necessary condition:
Hold above 3,972–4,000 USD and avoid breaking below the ascending channel trendline.
Sufficient condition (confirmation of a new bullish cycle):
A daily close above 4,216 USD/oz (Fib resistance zone / intraday peak).
Accompanied by:
• RSI breaking above 55–60
• Price holding above MA21 with a successful retest
If these conditions appear together, the probability of moving toward 4,300 — 4,380 USD/oz increases significantly.
Short-term bearish reversal scenario:
Failure to hold 3,972 USD opens the door to a deeper correction toward 3,846 USD (Fib 0.5) and then 3,720 USD (Fib 0.618).
Risk management note:
Volatility is still heavily driven by Fed news and geopolitics. Keep position sizes small, set clear stop-losses, and avoid holding large positions during policy events.
Trade Ideas (as provided)
SELL XAUUSD at 4213 – 4211 ⚡️
• Stop Loss: 4217
• Take Profit 1: 4205
• Take Profit 2: 4199
BUY XAUUSD at 4134 – 4136 ⚡️
• Stop Loss: 4130
• Take Profit 1: 4142
• Take Profit 2: 4148

GOLD retreats slightly, market gains bets on easing cycleOANDA:XAUUSD edged slightly lower after a strong rally yesterday, as the market continued to expand expectations that the Federal Reserve will begin its rate-cutting cycle as early as December. This development occurred despite positive U.S. economic data, indicating that the main support for gold now comes more from monetary policy expectations than from growth signals.
U.S. Treasury yields fell and the U.S. Dollar weakened, with the DXY index down 0.20% to 99.60, helping gold maintain its recovery momentum. Although initial jobless claims fell to 216,000 — the lowest since April — and durable goods orders rose more strongly than expected, these data had little impact on rate-cut expectations.
According to FedWatch, the probability of a Fed rate cut at the December meeting remains near 85%, a sharp increase from below 30% last week.
Geopolitical conditions, however, are shifting in a direction less supportive of gold. Signs suggest Russia and Ukraine are moving closer to a de-escalation agreement, with consultations in Geneva and positive remarks from both sides reducing the geopolitical risk premium that has supported gold for months. A Russian adviser told Al Jazeera that the U.S. plan contains “many positive aspects,” implying that diplomatic progress may be approaching.
Even so, the Fed’s policy outlook remains the dominant driver. JPMorgan Chase has reversed its forecast and now expects the Fed to cut rates in December instead of delaying until January. Michael Feroli’s economics team cited dovish comments from key Fed officials — especially New York Fed President Williams — as the reason for the shift. JPMorgan had previously expected the Fed to stay put after the September jobs report.
A new variable also attracting attention is the selection process for the next Fed Chair. Bloomberg reports that White House economic adviser Kevin Hassett — seen as dovish — has emerged as a leading candidate. The likelihood of a more dovish Fed leadership further strengthens expectations of rate cuts, pressuring the dollar and supporting gold. Treasury Secretary Bessant said the nomination could be announced before Christmas.
Overall, markets perceive that the key question now is how quickly the Fed can implement the rate-cutting cycle. Karl Schamotta of Corpay noted that markets are leaning toward expectations of more aggressive easing. In a similar move, Deutsche Bank raised its 2026 gold price forecast to 4,450 USD/oz, based on steady investment inflows and rising central bank gold-reserve demand.
While geopolitical risks appear to be easing, the outlook for U.S. monetary policy continues to be the primary driver shaping gold’s direction in the short and medium term.
Technical Analysis OANDA:XAUUSD
Gold price is maintaining the main uptrend on the daily timeframe, still moving within the ascending channel established since August. The latest session closed around 4,147 USD/oz, trading above the short-term MA21 and approaching the technical resistance zone at 4,128 (Fib 0.236) and the major resistance at 4,216 USD.
• Structure: Series of higher lows + rising channel intact → underlying trend remains bullish.
• Key support: 3,972–4,000 USD (Fib 0.382 + channel lower boundary/MA21). If this zone holds, the bullish outlook remains valid.
• Short-term resistance: 4,128 USD (Fib 0.236). A breakout above this level opens the path toward 4,216 USD and beyond.
• Momentum: RSI rebounded from the neutral zone → buying pressure has returned but remains moderate; no clear bearish divergence.
• Conclusion: Market structure remains bullish, but confirmation is needed via a breakout above 4,128 USD to validate a new bullish cycle.
Summary:
The main trend is still upward, but the market is awaiting a confirmed breakout of the 4,128–4,216 USD zone to enter a strong bullish phase. If price falls below 3,972–4,000 USD, the plan should be reassessed due to the risk of a pullback toward the 3,846 zone (Fib 0.5).
Trading Plan
SELL XAUUSD — 4195–4193 ⚡️
Stop Loss: 4199
Take Profit 1: 4187
Take Profit 2: 4181
BUY XAUUSD — 4109–4111 ⚡️
Stop Loss: 4105
Take Profit 1: 4117
Take Profit 2: 4123

GOLD ANALYSIS 11/28/20251. Fundamental Analysis:
a) Economy:
• USD:
The USD is slightly weakening after the holiday period; low market liquidity means the decline is not strong. Investors are waiting for new signals from next week’s data. Gold may spike unexpectedly if Japan intervenes in the Yen, causing USD weakness.
• U.S. Stock Market:
U.S. equities were closed for Thanksgiving. The general trend remains slightly positive with mild risk-on flow, but not strong enough to push gold in the opposite direction.
• FED:
The Fed maintains a “cautious” stance with no new signals. The scenario still leans toward keeping interest rates unchanged, which provides mild support for gold. A change in the Fed Chair increases the probability of rate cuts, which is supportive for gold.
• TRUMP:
The Trump administration continues to move toward corporate tax cuts and promoting domestic production. This creates medium-term pressure on the USD → indirectly supporting gold.
• Gold ETF – SPDR:
SPDR made no buys or sells; holdings remain unchanged. This reflects a wait-and-see sentiment, with no major capital inflow into gold yet.
b) Geopolitics:
No significant developments in the last 24 hours. Global conflicts remain simmering but not strong enough to create a major boost for gold during the holiday session.
c) Market Sentiment:
• The market is still in a sideways state with mild risk-on sentiment.
• Capital has not fully flowed back into gold, so any upside moves mainly come from technical factors rather than fundamental news.
2. Technical Analysis:
The 15-minute chart shows:
• Price has broken out of the 4,155–4,170 accumulation zone with strong upward momentum.
• RSI is rising steeply and has entered extreme overbought → short-term uptrend is intact but a slight correction is expected.
• Price structure has just formed an accumulation pattern.
• Technical target based on range box and projection: 4,207.
• EMA 20–50 are sloping upward, confirming bullish momentum.
Note: Morning breakouts are often retested → watch for BUY entries at the breakout zone.
RESISTANCE: 4,193 – 4,207
SUPPORT: 4,136 – 4,096
3. Yesterday’s Market (27/11/25):
• GOLD traded almost sideways within 4,143 – 4,170 throughout the day due to low liquidity from Thanksgiving.
• SPDR stayed out; the market is waiting for U.S. data to return.
• The accumulation structure lasted 24 hours → this morning’s breakout followed the pattern precisely.
4. Strategy for Today (28/11/25):
🪙 SELL XAUUSD | 4235 – 4233
SL: 4239
TP1: 4227
TP2: 4221
🪙 BUY XAUUSD | 4162 – 4164
SL: 4158
TP1: 4170
TP2: 4176

GOLD ANALYSIS 11/27/2025🟦 1. Fundamental Analysis:
a) Economy:
• USD:
The USD continues to weaken due to expectations that the FED will cut interest rates in 2026. Falling bond yields reduce the opportunity cost of holding gold → positive for GOLD.
• US Stock Market:
The U.S. market remains in the green thanks to expectations of monetary easing and the new administration’s stimulus package. Risk-on sentiment increases but does not pressure gold because the USD is still weak.
• FED:
The FED maintains a dovish tone, implying that inflation is moving in the right direction and they are ready to ease → supports gold’s bullish trend.
• TRUMP:
Plans for tax cuts and increased public spending → risk of a larger budget deficit → markets increase demand for hedging → gold becomes favored.
• Gold ETF – SPDR:
SPDR resumed strong net buying (4.57 tons yesterday), confirming large inflows returning to gold. This reinforces the current bullish trend.
b) Geopolitics:
Tensions in the Middle East remain unresolved, and Ukraine continues to escalate locally.
→ Safe-haven demand stays elevated, supporting gold.
c) Market Sentiment:
Current sentiment: risk-mixed
• Rising stocks → risk-on
• Falling USD + SPDR net buying → risk-off leaning toward gold
→ Overall: gold still holds a bullish advantage. However, the Thanksgiving holiday is reducing trading activity this week.
🟩 2. Technical Analysis:
Trend:
Gold is in a short-term uptrend after breaking the downtrend line, retesting successfully, and continuing upward.
Price Structure:
• Price consolidates around 4.36–4.173
• MA20–MA50 sloping upward
• RSI remains above 50 → buyers dominant
• Technical targets: 4.193 → 4.244
Key Levels:
• Resistance: 4.173 – 4.193 – 4.244
• Support: 4.136 – 4.096 – 4.062
🟧 3. Yesterday’s Market (26/11/25):
GOLD:
• Tapped support at 4.136 and bounced strongly to 4.173
• No bearish reversal candlestick
• Uptrend remains solid with stable volume
USD:
USD weakness is clear → supports GOLD’s bullish continuation.
SPDR:
SPDR continues net buying, confirming strong demand.
🟥 4. Trading Strategy Today (27/11/25):
🪙 SELL XAUUSD | 4195 – 4193
SL: 4199
TP1: 4187
TP2: 4181
🪙 BUY XAUUSD | 4109 – 4111
SL: 4105
TP1: 4117
TP2: 4123

GOLD ANALYSIS 11/26/20251. Fundamental Analysis:
a) Economy:
USD:
• The USD is leaning toward a slight decline as the market expects the FED to keep interest rates unchanged and possibly make minor cuts in the coming months.
• This supports gold because a weaker USD → bullish for gold in the short term.
U.S. Stock Market:
• U.S. equities have rebounded following stable corporate earnings; risk-on flows are returning.
• This limits gold’s upside, but does not create strong pressure as the bullish momentum is not too strong.
FED:
• The FED continues to emphasize a cautious policy stance, with no additional rate hikes.
• This keeps bond yields low → supportive for gold in the medium term.
TRUMP (Trump Administration):
• Trump’s policies on boosting manufacturing and cutting taxes continue to create expectations of rising inflation.
• Higher inflation → long-term positive for gold, although it may cause short-term volatility.
Gold ETF – SPDR:
• SPDR has not sold off and maintains holdings around 104 tons.
• The “no selling” stance → neutral to slightly bullish signal.
b) Geopolitics:
• Conditions remain relatively stable over the past 24 hours.
• The market continues to monitor trade tensions and financial conflicts between major economic blocs.
• Any geopolitical disturbance increases safe-haven demand for gold.
c) Market Sentiment:
• Overall sentiment is slightly risk-on: U.S. stocks stable, risk appetite improving.
• However, the market maintains a degree of caution ahead of upcoming GDP and PCE reports.
• Therefore, gold may not rise strongly, but it maintains solid price support and short-term upside.
• End-of-month and end-of-year periods typically see lower trading activity.
2. Technical Analysis:
a) Market Structure:
• Gold remains in a short-term uptrend with a clear sequence of higher lows from the 4029 zone.
• The rising trendline is still intact.
b) Price Action Signals:
• The 15m chart shows a clean bullish pattern.
• A retracement to 4096 may occur before heading higher.
• Upside targets remain toward 4193.
c) Technical Indicators:
• RSI is neutral → suitable for a pullback before continuation.
• MA20 – MA50 expanding upward → reinforces the bullish bias.
d) Main Scenario:
• Pullback to 4096, then bounce upward → targets: 4158 → 4193.
• Strategy is to follow price action at key levels. At resistance zones, always wait for confirmation of breakout or rejection before trading. Favor setups aligned with the main trend.
e) Key Levels:
Resistance: 4158 – 4193 – 4244
Support: 4096 – 4062 – 4029
3. Market Summary (25/11/25):
• GOLD tested the 4040–4060 area and bounced upward according to trend structure.
• Price range was relatively narrow but still maintained a bullish base.
• No major news catalysts; market moved mainly on technicals.
4. Strategy for Today (26/11/25):
🪙 SELL XAUUSD | 4213 – 4211
SL: 4217
TP1: 4205
TP2: 4199
🪙 BUY XAUUSD | 4133 – 4135
SL: 4129
TP1: 4141
TP2: 4147

GOLD opened with a significant increaseOANDA:XAUUSD opened the morning of November 26 with a significant gain, following a volatile session yesterday when the market absorbed two conflicting signals: unexpected progress in Russia-Ukraine peace talks and growing expectations that the Federal Reserve will cut interest rates as early as December.
In the European session yesterday, spot gold fell to a daily low of $4,109.47/ounce, as news that Ukraine had “basically” agreed to a US-proposed peace plan boosted global risk appetite. Market sentiment immediately reflected capital flows out of defensive assets.
However, in the New York session, gold reversed sharply, hitting a peak of $4,159.39/ounce, recovering nearly $50 from the previous low. At the end of Tuesday’s session, gold stood at $4,130.76/ounce, down slightly by 0.1%. By this morning, November 26, the price had returned to the $4,164/ounce area, up nearly 1% on the day.
Geopolitics: Peace Signals Weaken Need for Shelter, But Not Enough to Change the Game
Kyiv has agreed in principle to Washington’s peace proposal, according to US and Ukrainian officials. Some sensitive details remain to be worked out, but many contentious points have been tweaked. The Trump administration’s original 28-point plan has been whittled down to 19, with some provisions “at least worth considering,” according to The Washington Post.
Negotiations began in Geneva on November 23, and both Bloomberg and US officials described the process as streamlined to reach a quick deal. President Trump even declared a peace deal “very close.” This news immediately sent gold prices sharply lower yesterday, demonstrating that the market remains sensitive to geopolitical developments, even when peace signals are still preliminary.
Technical analysis and suggestions OANDA:XAUUSD
Gold price maintains the main uptrend on the daily chart, trading around $4,160/oz within the medium-term ascending channel. The price is currently above the short-term MA21 (~4,056) and has bounced from the support zone around Fib 0.382 (≈3.973); RSI is recovering slightly from the neutral zone, indicating weakening selling pressure.
The 4.128 (0.236 Fib) zone is the first short-term resistance; 4.216 is the key resistance that determines the possibility of opening a new bullish cycle (extremely important). If the price holds above 3.972–4.000 and closes sustainably above 4.128, the possibility of continuing to challenge 4.216 → 4.380 increases. Conversely, a break below 3.972 will weaken the bullish structure and open the door to the 3.846 (0.5 Fib) zone or lower.
Macro backdrop: Fed easing expectations and geopolitical risks continue to be the support base; positive news on interest rate cuts will increase the probability of a breakout above the 4.216 resistance.
BUY XAUUSD PRICE 4235 - 4233⚡️
↠↠ Stop Loss 4239
→Take Profit 1 4227
↨
→Take Profit 2 4221
SELL XAUUSD PRICE 4153 - 4155⚡️
↠↠ Stop Loss 4149
→Take Profit 1 4161
↨
→Take Profit 2 4167

Pre Open heads up on Gold. And overall draw. Bullish it isCOMEX:GC1!
Looking for higher prices on Gold. It should deliver towards the buyside and successive highs from here on. Need a CISD on the 4H timeframe

Pre open Heads Up. Index NSYECME_MINI:NQ1!
Looking for bearish prices on the Index triads for this NYO while the overall thought process is bullish on the HTF
