Powell tightens, Dollar flies high, GOLD is falling!US Dollar Accelerates, Gold “Slides” After Fed Chairman Powell’s Cautious Speech OANDA:XAUUSD spot prices plunged in the latest session as the US dollar and Treasury yields rose in tandem, following a cautious speech by US Federal Reserve Chairman Jerome Powell.
Powell: “Caution remains the priority”
In his speech on Tuesday, Mr. Powell said the Fed still needs to carefully consider the two parallel risks: high inflation and a weak labor market. According to him, current monetary policy is still “sufficient to respond to the underlying economic developments,” although it is still limited.
Powell this time appeared “more open but tough,” as if to emphasize that the Fed cannot rush to cut interest rates when inflationary pressures are still persistent.
Yields and US Dollar put pressure
The sharp fall in gold prices also came from rising US Treasury yields. The 10-year yield inched up 3 basis points to 4.137%, while real yields rose nearly 3.5 basis points to 1.767%. This made gold, which does not yield interest, less attractive.
The US dollar index (DXY) also rose 0.66% to 97.85, making US dollar-denominated gold more expensive for investors holding other currencies.
Markets await US economic data
Traders are now focused on US GDP data, jobless claims and personal consumption expenditure (PCE) for fresh clues on monetary policy.
The gold market is reacting to both the Fed comments and geopolitical tensions.
Russia-Ukraine tensions and the haven factor
On the geopolitical front, US President Donald Trump unexpectedly declared support for Ukraine, asserting that “Kiev can take back all its territory”. At the same time, the Ukrainian army said it had attacked two oil pumping stations in Volgograd (Russia).
In the context of instability, gold is often considered a safe haven. However, with the acceleration of the dollar and bond yields, the pressure on gold is still quite large.
Outlook
The Fed will continue to rely on economic data to make decisions, thereby directly affecting the US dollar, interest rates and market sentiment.
Investors now expect the Fed to cut interest rates by 25 basis points at each of its remaining meetings in 2025, with another cut in the first quarter of 2026.
However, with interest rates still an “unknown” factor, gold, which does not generate income, will find it difficult to break out if the Fed does not send a clear signal about the pace of policy easing.
Technical outlook analysis of OANDA:XAUUSD
Overall Trend
• The daily chart (D1) shows that gold has been in an uptrend channel since August, with breakout candles accompanied by high volume.
• Current price: 3,734 USD/oz (after testing resistance near 3,750 – 3,791).
• The main trend is still up, but the price is having a technical correction after a hot rally.
Key technical milestones
Key Technical Levels
• Near Resistance:
3,791 USD (Fib 0.382 + recent high).
3,825 USD (Fib 0.5).
• Far Resistance:
3,872 USD (Fib 0.618).
3,938 USD (Fib 0.786).
4,022 USD (maximum target according to Fib 1.0).
• Important Support:
3,720 USD (Fib 0.236 + MA zone).
3,628 USD (Fib 0.0 – stronger support, in case of deep correction).
RSI
• RSI has reached the overbought zone (>70) and cooled down → supporting a short-term correction before continuing to increase.
Personal trading idea
• Entry 1 (cautious): Wait for the price to correct to 3.720 – 3.730 (nearby support) to buy.
• Entry 2 (risky): Can enter immediately when the price holds above 3.734 with a short stoploss.
• Stoploss: Below 3.700 (safer than below 3.628 if you want to hold long-term).
• Take Profit (TP):
o TP1: 3.791 (nearby resistance).
o TP2: 3.825 (Fib 0.5).
o TP3: 3.872 – 3.938 (strong resistance).
o Further: 4.022 (maximum target in an uptrend).
SELL XAUUSD PRICE 3767 - 3765⚡️
↠↠ Stop Loss 3771
→Take Profit 1 3759
↨
→Take Profit 2 3763
BUY XAUUSD PRICE 3700 - 3702⚡️
↠↠ Stop Loss 3696
→Take Profit 1 3708
↨
→Take Profit 2 3714
Gc1

Gold Long Setup: Tight Stop, 29x Risk/Reward#DayTrading #Gold
TVC:GOLD trade with a tight stop loss. Risk/Reward 29. I ignored gold’s uptrend for a while but decided to try a long position with a short stop loss. Looking at the 6-month chart, there’s still room to climb.
Entry: $3,642
Stop Loss: $3,609
First Take Profit: $4,600
Risk/Reward: 29.03
Chart:

GOLD has all-round support, Fed, geopoliticsOn September 23, the OANDA:XAUUSD market experienced a “roller coaster”: initially soaring to a record $3,791/ounce in the European session, then cooling significantly when the US Federal Reserve Chairman Jerome Powell spoke. However, gold still closed higher than at the beginning of the day, showing that the big uptrend has not been shaken.
As of the time of writing, gold has adjusted down slightly to $3,754/oz, equivalent to a decrease of 0.25% and about $10 on the day.
What keeps gold “shining”?
• Fed monetary policy: Powell stressed that the Fed must balance high inflation with a weakening job market. The Fed cut interest rates last week and the FedWatch tool shows a nearly 90% chance of further cuts in October. Lower interest rates make gold more attractive than bonds or savings.
• Fed view: While Powell has been cautious, other officials such as Bowman have warned that the Fed may be “slowing down” and need to cut interest rates faster if the economy worsens. This further reinforces expectations that gold will benefit.
• Hot geopolitics: NATO accused Russia of repeatedly violating the airspace of member countries, while Russia-Ukraine tensions were further complicated by the latest statement from former President Donald Trump. After meeting with President Zelensky, Trump unexpectedly strongly supported the possibility of Ukraine regaining all of its territory. This escalation of tensions has caused a sharp increase in safe-haven demand for gold.
• Market demand: Commerzbank pointed out that in addition to interest rates, factors such as ETF capital flows, doubts about the independence of the Fed and global political risks are simultaneously pushing up gold prices.
Fundamental Outlook:
Investors are focusing on the Personal Consumption Expenditures (PCE) index, the Fed’s preferred inflation measure, due later this week. If inflation continues to run hot, the Fed may be more cautious, but the pressure of US public debt and international instability remains a “golden support” for the price of this precious metal.
Since the beginning of the year, gold prices have increased by nearly 40%, the strongest pace since the late 1970s. With low interest rates, political risks and increased demand for shelter, the general trend still favors gold to maintain its “halo”.
Technical outlook analysis of OANDA:XAUUSD
• Main trend:
Gold price is still in the uptrend channel, each correction to the lower edge bounces up → buyers are in control.
• MA line:
Price is firmly above the EMA21 line, and the EMA21 is still pointing up → confirming the uptrend. The EMA plays a quite effective dynamic support role.
• Important support:
o Nearby: 3,720 – 3,738 USD (Fibo 0.236 zone + lower channel edge).
o Stronger support: around 3,628 USD (Fibo 0 bottom).
• Resistance – target above:
o Nearby: 3,779 – 3,791 USD (Fibo 0.382 + previous candle high).
o Next target: 3,825 USD (Fibo 0.5) → 3,872 USD (Fibo 0.618). If the breakout is successful, the possibility of advancing to the 3,939 USD zone is still open.
• RSI & momentum:
RSI is high, but has not yet fallen into extreme overbought. Momentum shows that there is still momentum, but there may be a pause (small pullback) before continuing to increase.
• Candlestick structure:
Recent candles have small bodies, narrow fluctuations → signs of market accumulation around the top. If the breakout is accompanied by liquidity, the possibility of further increase is very high.
The current gold trend is still inclined to increase. As long as the price stays above the support zone of 3,720 - 3,738 USD, the prospect of conquering the 3,779 - 3,825 - 3,872 USD marks is completely feasible.
SELL XAUUSD PRICE 3826 - 3824⚡️
↠↠ Stop Loss 3830
→Take Profit 1 3818
↨
→Take Profit 2 3812
BUY XAUUSD PRICE 3728 - 3730⚡️
↠↠ Stop Loss 3724
→Take Profit 1 3736
↨
→Take Profit 2 3742

GOLD (XAUUSD): Bullish! Continue To Buy! In this Weekly Market Forecast, we will analyze the Gold (XAUUSD) for the week of Sept. 22 - 26th.
Gold is bullish on all HTFs. Selling is not an option. Wait for a pullback, and jump on the uptown train! Dips are your friend, so be patient and wait this market to take a breather.
Selling is only valid when there is a bearish break of structure. Until that happens, buy it, my friend.
Be wary of the pullback, as that move is likely to be corrected, but that would set up a great long opportunity!
Enjoy!
May profits be upon you.
Leave any questions or comments in the comment section.
I appreciate any feedback from my viewers!
Like and/or subscribe if you want more accurate analysis.
Thank you so much!
Disclaimer:
I do not provide personal investment advice and I am not a qualified licensed investment advisor.
All information found here, including any ideas, opinions, views, predictions, forecasts, commentaries, suggestions, expressed or implied herein, are for informational, entertainment or educational purposes only and should not be construed as personal investment advice. While the information provided is believed to be accurate, it may include errors or inaccuracies.
I will not and cannot be held liable for any actions you take as a result of anything you read here.
Conduct your own due diligence, or consult a licensed financial advisor or broker before making any and all investment decisions. Any investments, trades, speculations, or decisions made on the basis of any information found on this channel, expressed or implied herein, are committed at your own risk, financial or otherwise.

GOLD continues to set records, market awaits Powell's speechIn the Asian trading session on the morning of September 23, the spot OANDA:XAUUSD price fluctuated around 3,745 USD/ounce, after just setting a new record. Previously, in the first session of the week (September 22), gold increased sharply by 62.23 USD (equivalent to 1.7%), closing at 3,746.63 USD/ounce and on this trading day, it jumped to 3,759.29 USD/ounce, the highest level in history.
OANDA:XAUUSD was supported by expectations that the US Federal Reserve would continue to cut interest rates. Low interest rates are generally beneficial for the precious metal because they do not yield. Despite being considered “overbought”, gold has yet to show any signs of technical weakness.
Last week, Fed Chairman Jerome Powell “poured cold water” on expectations of too-fast policy easing after the Fed cut interest rates. However, the move did not stop money from pouring into gold ETFs, with holdings rising the most in more than three years.
This week, global investors are focused on a series of speeches from Fed officials, especially Mr. Powell's public speech on Tuesday afternoon (US time). According to the schedule, he will attend the "Economic Outlook Lunch" event in Rhode Island on September 24, where he will dialogue with more than 500 business and civil leaders. This is considered an opportunity for the market to grasp more about the upcoming monetary policy direction from the Fed.
Technical analysis of OANDA:XAUUSD outlook
Main Trend
Gold is in a steep uptrend channel, showing strong momentum.
The most recent candles are all sticking to the channel line and above the MA line, showing that the uptrend is still maintained.
Support and Resistance zones
Important support: 3,707 USD and 3,673 USD/ounce (Two green lines on the chart). This is the zone where if the price corrects, it is likely to bounce back.
Nearest resistance: 3,779 USD (Fibonacci level 0.382). If broken, gold can head towards: 3,825 USD (Fib 0.5), 3,872 USD (Fib 0.618), further: 3,938 USD (Fib 0.786).
Technical indicators
RSI: is in the high zone (above 70, signaling “overbought”), but has not given a strong reversal signal → indicating that the market still has upward momentum.
MA: moving average is sloping up, price is much higher than MA → strengthening the uptrend.
Trend analysis
Gold may have some short-term corrections to “gain momentum” around the $3,707 – $3,673 range, but the medium-term trend remains bullish. If the price channel is maintained and the support zone is not breached, there is a high possibility that gold will conquer the $3,779 → $3,825 → $3,872 range in the near future.
SELL XAUUSD PRICE 3789 - 3787⚡️
↠↠ Stop Loss 3793
→Take Profit 1 3781
↨
→Take Profit 2 3775
BUY XAUUSD PRICE 3726 - 3728⚡️
↠↠ Stop Loss 3722
→Take Profit 1 3734
↨
→Take Profit 2 3740

XAUUSD Very aggressive Bullish Leg started.Gold (XAUUSD) is on a remarkable bounce just after marginally breaking below the 4H MA50 (blue trend-line) and reaching the bottom of the 1-month Channel Up, which is technically the new Bullish Leg of the pattern.
The previous one extended all the way to +10.65% (which gives us a $4000 long-term Target) before the 4H RSI started to decline on Lower Highs, which on a sidenote gave us the bullish confirmation required when the RSI broke above them today.
On the short-term however, we are looking for a much more plausible Target at $3800, which has been the standard mini-rally sequence that this Channel Up has offered.
-------------------------------------------------------------------------------
** Please LIKE 👍, FOLLOW ✅, SHARE 🙌 and COMMENT ✍ if you enjoy this idea! Also share your ideas and charts in the comments section below! This is best way to keep it relevant, support us, keep the content here free and allow the idea to reach as many people as possible. **
-------------------------------------------------------------------------------
💸💸💸💸💸💸
👇 👇 👇 👇 👇 👇

GOLD MARKET ANALYSIS AND COMMENTARY - [Sep 22 - Sep 26]Last week, OANDA:XAUUSD prices fluctuated strongly: opening at 3,645 USD/oz, falling to 3,626 USD/oz, rebounding to 3,707 USD/oz after the FED cut interest rates by 0.25%, but being under profit-taking pressure and cautious statements from Chairman Powell, the price fell to 3,627 USD/oz before recovering and closing at 3,685 USD/oz.
The Dot Plot shows that the FED may only cut 2 more times in 2025 and 1 time in 2026, while Powell's speech is no longer highly appreciated by the market due to the end of his term and the influence of President Trump.
In the short term, gold may adjust and accumulate, waiting for US economic data, US-China trade and geopolitical tensions. This week, the focus will be on the August PCE index: if it exceeds 3% YoY, the FED may postpone the interest rate cut, creating downward pressure on gold; if it is around 2.9% or lower, gold will be supported.
📌According to technical analysis, the gold price continues to be in the overbought zone. If the gold price does not surpass 3,708 USD/oz this week, it will quickly be pushed down to 3,626 USD/oz. If this level cannot be maintained, the gold price is at risk of falling to the 3,550 USD/oz area, or lower. On the contrary, if it surpasses 3,708 USD/oz, the gold price next week may reach 3,750 USD/oz.
Notable technical levels are listed below.
Support: 3,673 – 3,614 – 3,600 USD
Resistance: 3,700 – 3,707 USD
SELL XAUUSD PRICE 3751 - 3749⚡️
↠↠ Stop Loss 3755
BUY XAUUSD PRICE 3549 - 3551⚡️
↠↠ Stop Loss 3545

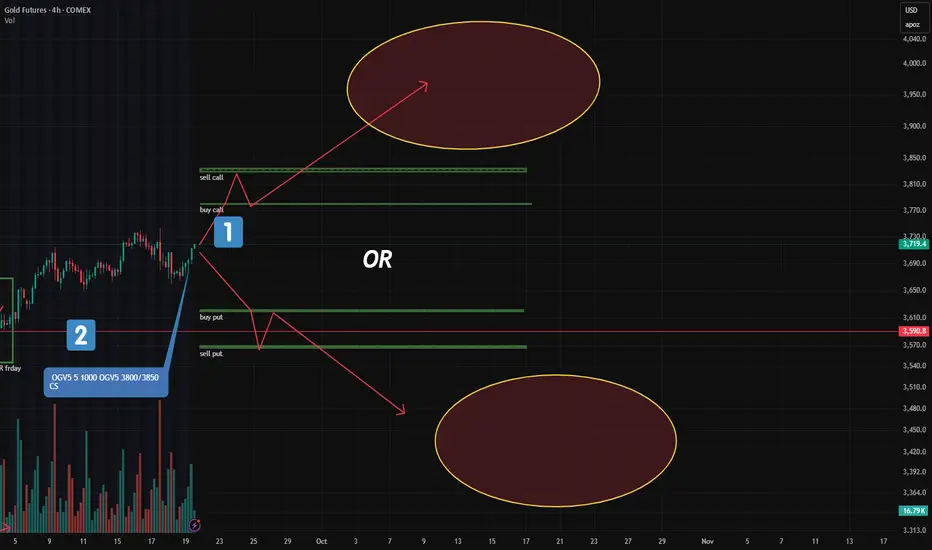
Gold: Major New Option Portfolios Signal Strong Moves AheadFriday’s CME report showed a surge in large option blocks in gold — two of them stand out.
🔹 1. "Long Condor" on December Futures (GCZ24)
This is the most significant structure added:
Targets a move below $3,620 or above $3,780
In other words: a breakout is expected, not consolidation
📌 Key point:
A "Long Condor" profits from volatility, not direction.
It wins if price moves sharply — up OR down — but loses if it stays flat.
💡 My note:
When I first encountered delta-neutral strategies like this as a Forex trader — my brain exploded.
No directional bias… yet clearly positioned for action?
That was the moment I realized: options are a different game.
🔹 2. Bull Call Spread (Oct Series): $3800–$3850
Another key play:
A classic bullish call spread at 3800/3850
Target: upside beyond current levels
But here’s the difference:
Unlike the "Long Condor", this one needs a clear upward move — and soon. Within a few days.
This isn’t about volatility.
It’s a directional bet that gold will rise.
🧠 Bottom Line:
One portfolio says: "Breakout coming — no matter which way."
Another says: "Gold goes up — and soon."
Are they aligned?
Contradictory?
Or could both win?
Trade smarter, not harder! Looking to boost your profits with valuable market insights and data-driven entry points? Join us or keep moving!
XAUUSD (GOLD) Forecast✨📊 XAUUSD (GOLD) Forecast – Intraday & Swing Outlook ✨💰
Asset Class: XAUUSD (GOLD CFD)
Closing Price: 3,685.11 📍 (20th Sept 2025, 12:50 AM UTC+4)
🔎 Multi-Lens Technical Analysis
🕯 Candlestick & Patterns
📉 Head & Shoulders → Watching neckline at 3,660
📈 Bull Trap/ Bear Trap → Possible fakeouts near 3,700 zone
🔄 Harmonics + Fibonacci → Reversal signals align around 3,640 – 3,650
🌊 Theories in Play
Elliott Waves → Wave 5 completion likely near 3,710 – 3,725
Wyckoff → Distribution phase signs visible 🔔
Gann → Time/price square shows resistance 3,720 – 3,730
Ichimoku → Cloud support at 3,655
📊 Indicators & Tools
RSI: 64 → Near overbought ⚠️
Bollinger Bands: Upper band at 3,710 = overextension risk
VWAP: Anchored VWAP support at 3,660
Moving Averages:
EMA20 (H1) = 3,662 ✅
Golden Cross intact (Bullish bias)
⏱ Trading Time Frames
Intraday Focus: 5m / 15m / 1H / 4H
Swing Focus: 4H / Daily / Weekly
🎯 Trading Strategy
Intraday Plan (Sept 20 – 23)
🟢 Buy Zone: 3,655 – 3,665 (Target: 3,690 – 3,705)
🔴 Sell Zone: 3,710 – 3,725 (Target: 3,670 – 3,650)
Swing Plan (Sept 20 – 27)
🟢 Swing Long Entry: 3,640 – 3,655 (Target: 3,720 – 3,745)
🔴 Swing Short Entry: 3,730 – 3,745 (Target: 3,660 – 3,640)
🌍 Market Context
📰 Fed policy & USD strength will remain key drivers
⚔️ Geopolitical tensions = higher volatility expected
🛡 Gold remains safe-haven bid during risk-off
✅ Conclusion
📊 Gold (XAUUSD) trades in critical resistance zone near 3,700.
Short-term bias → Bullish, but cautious of traps
Swing bias → Range-bound 3,640 – 3,745
🎯 Traders should buy dips & sell rallies within zones
⚡Stay sharp, manage risk! ⚡
For individuals seeking to enhance their trading abilities based on the analyses provided, I recommend exploring the mentoring program offered by Shunya Trade. (Website: shunya dot trade)
I would appreciate your feedback on this analysis, as it will serve as a valuable resource for future endeavors.
Sincerely,
Shunya.Trade
Website: shunya dot trade
⚠️Disclaimer: This post is intended solely for educational purposes and does not constitute investment advice, financial advice, or trading recommendations. The views expressed herein are derived from technical analysis and are shared for informational purposes only. The stock market inherently carries risks, including the potential for capital loss. Therefore, readers are strongly advised to exercise prudent judgment before making any investment decisions. We assume no liability for any actions taken based on this content. For personalized guidance, it is recommended to consult a certified financial advisor.

GOLD "lost steam" after the peak because the US Dollar increasedThe world OANDA:XAUUSD fell in the session on Thursday (September 18) after hitting a record high of 3,707.40 USD/ounce the day before. The main reason came from profit-taking activities of investors and the strengthening of the US dollar and treasury bond yields. As of the time of writing on Friday (September 19), spot gold was trading at 3,648 USD/oz, equivalent to an increase of 0.12% on the day.
New economic data from the US weighed on the market: initial jobless claims fell to 231,000, lower than expected, while the Philadelphia Federal Reserve manufacturing index unexpectedly jumped to 23.2, a sharp improvement from the previous month. This pushed the greenback higher and made gold more expensive. The 10-year Treasury yield rose to 4.102%, while the real yield was close to 1.722%, adding to the pressure on the precious metal. This was largely a technical correction after gold hit a series of new highs.
However, the long-term outlook for gold remains positive. The precious metal typically benefits when the Fed enters a policy easing cycle. In fact, the Fed just cut interest rates by 25 basis points, although there was no absolute consensus. Chairman Jerome Powell called it a “risk-control” measure for the labor market, but also affirmed that the Fed is in no hurry.
In addition, data shows that gold exports from Switzerland to China increased 254% in August, reflecting strong demand from Asia. The trend of diversifying foreign exchange reserves of the BRICS bloc continues to be a major support for gold prices.
Since the beginning of the year, gold has increased by nearly 39%, and investors still believe that the target of $ 4,000 / ounce can be challenged in the near future.
Technical Outlook Analysis OANDA:XAUUSD
Gold has had two sessions of technical corrections, but it still has all the bullish conditions in place, while the initial conditions for a deep correction have not yet appeared. Currently, gold is trying to recover and is still above the 0.236% Fibonacci retracement level, which can be said to be the closest support at the moment. On the other hand, gold is still in an uptrend channel and is receiving major support from the EMA21.
As long as gold remains above the $3,600 base point, the declines should be viewed as a short-term correction or a fresh buying opportunity.
The relative strength index (RSI) is also moving sideways after testing the 80 level, and a steep RSI break below 80 would be considered a signal for a possible deeper correction.
For the day, the overall technical outlook for gold is bullish, and the key points to watch are listed below.
Support: $3,614 – $3,600
Resistance: $3,673 – $3,700 – $3,707
SELL XAUUSD PRICE 3678 - 3676⚡️
↠↠ Stop Loss 3682
→Take Profit 1 3670
↨
→Take Profit 2 3664
BUY XAUUSD PRICE 3606 - 3608⚡️
↠↠ Stop Loss 3602
→Take Profit 1 3614
↨
→Take Profit 2 3620

GOLD was clearly supported, but Powell stopped shortIn the trading session on September 17 in New York, the US financial market "spinned like a pinwheel" after the Federal Reserve's decision to lower interest rates and Chairman Jerome Powell's speech. The Dollar recovered after Mr. Powell's speech, causing gold to be sold off strongly. As of the time the article was completed (Thursday, September 18), the gold price was trading at 3,662 USD/oz.
The Fed officially cut interest rates by 25 basis points, bringing the federal funds rate band down to 4.00% - 4.25%, as expected. This is the first time the Fed has cut interest rates since December last year. This decision immediately caused the USD to plummet to a 4-year low against the euro, while spot gold prices jumped to a new record. However, after Powell's speech, the USD quickly recovered strongly, while gold fell from the peak due to profit-taking pressure.
The US stock market also fluctuated violently: all three major indexes rose sharply for a moment and then quickly reversed. Powell emphasized that the Fed was in no hurry to ease further and this move was considered a “risk management cut”.
In the statement after the meeting, the FOMC acknowledged that the US economy was “slowing”, employment was weakening, inflation was rising and the downside risks to the labor market were growing. However, the Fed still forecast two more 0.25% rate cuts this year, according to the “dotplot chart” tool showing the expectations of each official. New member Milan was the only one who opposed, wanting a sharp 0.5% cut.
Powell said future decisions would be considered “on a meeting-by-meeting basis,” suggesting the Fed is moving cautiously rather than aggressively easing. Officials are also increasingly converging on the idea that the Trump administration’s trade and tariff policies will only have a temporary impact on inflation.
Technical Outlook Analysis OANDA:XAUUSD
On the daily chart, gold has not been able to surpass the 3,700 USD price mark, the profit-taking momentum has caused the gold price to drop sharply and very quickly, but with the current position, it still has all the conditions to increase in price. Specifically, the main trend is still stable with the price channel as the medium-term trend, and the support from EMA21 as the main support, followed by the 0.50% Fibonacci extension level as the current nearest support.
On the other hand, in terms of momentum, the RSI has not yet signaled the possibility of a more significant downside correction, as the RSI is still operating in the overbought area and is mostly moving sideways, indicating that profit-taking in the market is limited, leading to limited downside momentum. A downward sloping RSI through the 80 level is the best signal for a more significant downside correction. During the day, if gold breaks above the 0.618% Fibonacci extension level again, it will be in a position to retest the $3,700 level, more so the $3,722 level once the original $3,700 level is broken.
Finally, the general trend of gold price on the daily chart is bullish and the notable points will be listed as follows.
Support: 3,645USD
Resistance: 3,677 – 3,700USD
SELL XAUUSD PRICE 3696 - 3694⚡️
↠↠ Stop Loss 3700
→Take Profit 1 3688
↨
→Take Profit 2 3682
BUY XAUUSD PRICE 3616 - 3618⚡️
↠↠ Stop Loss 3612
→Take Profit 1 3624
↨
→Take Profit 2 3630

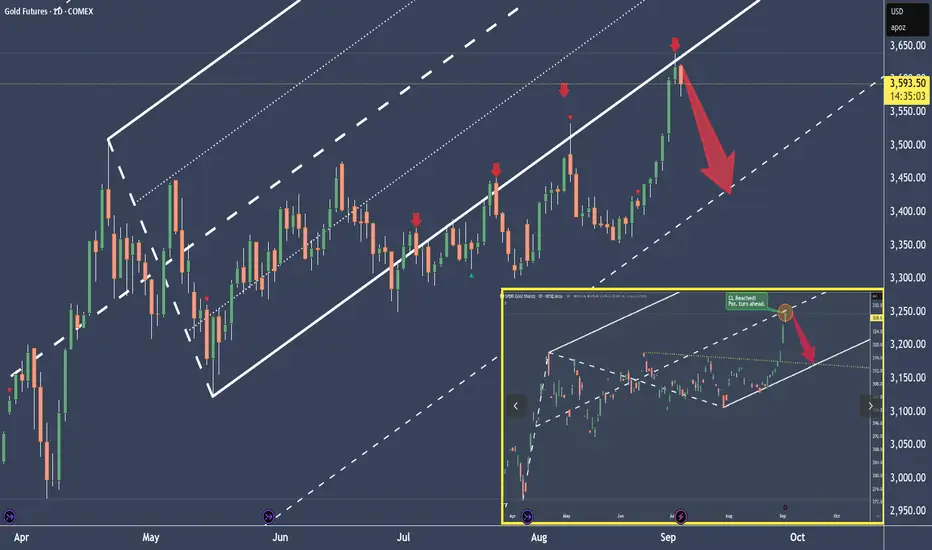
Gold — Fed Cut Fade: Overextended, Eyeing a ThrowbackGold — Fed Cut Fade: Overextended, Eyeing a Throwback 🎯
Gold ripped higher into the FOMC, but the 25 bp cut was fully priced in. Post-decision, we saw the classic whipsaw — down → up → slow fade into the close. With the dollar and real yields catching a bid, the metal looks due for digestion before the next leg.
Technicals (4h)
Overextended run: Vertical leg higher with no real basing.
Supply zone: Sellers showed up around 3.71–3.75k.
Volume magnet: Confluence of the broken trendline + HVN sits down at ~3.41k.
Thin profile: Gap between 3.52 → 3.41k leaves room for a fast move lower if momentum flips.
Trade Idea
Short bias: Fading the 3.71–3.74k zone or on breakdown acceptance below 3.69k.
Stop: Above 3.76k (invalidation).
Target: 3.41k (major HVN + retest zone).
Macro Context
The Fed’s move matches expectations. With positioning stretched and “buy the rumor / sell the news” in play, near-term risk is for a pullback. Medium term, the trend stays bullish if easing continues and real yields drift lower.
Not financial advice — just sharing the setup I’m watching.
#Gold #GC1 #Futures #ShortSetup #VolumeProfile #FOMC

GOLD price exceeds 3,700 USD, market waits for Fed decisionThe spot price of OANDA:XAUUSD has officially surpassed the $3,700/ounce mark, setting a new record. The main reason comes from the expectation that the US Federal Reserve (Fed) will cut interest rates this week. In addition, news that the Trump administration is considering imposing additional tariffs on imported auto parts has further boosted gold's status as a safe haven.
Current context: the global economy remains unstable, geopolitical tensions have not cooled down. The US dollar is weakening, falling to its lowest level since July, making gold more attractive. However, some investors have taken advantage of the opportunity to take profits ahead of the important Fed meeting on Wednesday.
Since the beginning of the year, gold has increased by more than 40% thanks to:
• The risk of a trade war, especially from US tax policy.
• Demand for gold from central banks, especially in emerging markets.
• A weak dollar and the possibility of further interest rate cuts.
According to CME Group’s FedWatch tool, investors are almost certain that the Fed will cut by 25 basis points, although there is still a (small) chance that the Fed will cut by 50 basis points.
Personally, I will continue to lean towards the upward trend of gold prices since the beginning of this year because gold has benefited from the low interest rate environment, making gold – which does not yield – more attractive. In addition, with President Trump publicly urging the Fed to “loosen aggressively”, the market is expecting a series of new interest rate cuts to be opened in the near future.
Technical outlook analysis of OANDA:XAUUSD
On the daily chart, gold briefly crossed the $3,700 mark in yesterday's US session, but then pulled back slightly.
Currently, the 0.618% Fibonacci extension level is the nearest support level, if the recovery from this $3,677 support level brings gold back to work above the $3,700 base point, this will be the most suitable condition for a new continued bullish cycle, and the target then is around $3,722 in the short term.
The 3,722 USD level is the price point of the 0.786% Fibonacci extension, in which the signal for a possible correction to the downside has not appeared in terms of momentum.
The RSI maintains its activity in the overbought area, but it is mostly moving sideways in this area, indicating that the market forces (profit taking/selling) are insignificant. A momentum signal for a possible correction to the downside is the RSI folding down below the 80 mark with a significant slope.
In case gold is sold below the 3,677 USD mark, it may fall further to retest the 3,645 USD mark, but the trend and the main bullish conditions will remain unchanged.
Finally, the bullish trend of gold prices will be noticed again by the following positions.
Support: 3,677 – 3,645 USD
Resistance: 3,700 – 3,722 USD
SELL XAUUSD PRICE 3729 - 3727⚡️
↠↠ Stop Loss 3735
→Take Profit 1 3721
↨
→Take Profit 2 3715
BUY XAUUSD PRICE 3653 - 3655⚡️
↠↠ Stop Loss 3649
→Take Profit 1 3661
↨
→Take Profit 2 3667

GOLD hits new all-time high, watch out for FedOANDA:XAUUSD continued to rise sharply, renewing all-time highs, currently trading around 3,678 USD/oz. Gold rose thanks to the weak Dollar and US Treasury yields. In addition, there was new news about Trump's tariffs. The US plans to add steel and aluminum derivatives to the tariff list. Trade uncertainty has contributed to the increase in gold prices.
The US Dollar Index TVC:DXY fell 0.3% on Monday and is now down another 0.11% at 97.235, hitting a one-week low, and the 10-year Treasury yield also weakened, reflecting that investors are preparing for a possible rate cut ahead of the Federal Reserve's highly anticipated meeting this week. The weaker dollar makes dollar-denominated gold more attractive because of the inverse correlation between the two assets.
Regarding Trump's tariffs, according to a notice issued by the U.S. Department of Commerce on Monday, the U.S. Bureau of Industry and Security (BIS) has established a process to include additional steel and aluminum derivatives in the tariff scope authorized by President Trump under Section 232 of the Trade Expansion Act of 1962. The notice said the filing period for the September 2025 period has begun. The filing period will begin on September 15, 2025, and end at 11:59 p.m. Eastern Time on September 29, 2025.
Traders are gearing up for the Federal Open Market Committee (FOMC) monetary policy meeting on September 16-17. Expectations for a rate cut are high, and as a result, US Treasury yields fell sharply on Monday. Gold prices are reflecting the restart of the Fed's easing cycle amid mixed data. Inflation remains high, but a revised jobs report last Tuesday showed that job growth from April 2024 to March 2025 was overestimated by 911,000, raising concerns about a labor market downturn.
As a result, last week’s data and Fed Chairman Jerome Powell’s abrupt change of heart at the Jackson Hole symposium in late August have opened the door to a 25 basis point rate cut. However, few still expect the Fed to cut by 50 basis points.
Along with their decision, Fed officials will also release their latest economic projections and a “dot plot” of interest rates, in which the committee charts the future path of the federal funds rate.
Investors will be watching U.S. retail sales data on Tuesday ahead of the Federal Reserve’s policy decision on Wednesday, which could shape gold’s price direction ahead of the Fed’s decision.
Focus on Federal Reserve Decision
The Federal Reserve will meet this week under unusually heavy pressure as US President Trump seeks greater influence over monetary policy and the Senate clears a seat for White House economic adviser Milan to join the rate-setting committee in time for a vote at its policy meeting on Wednesday.
On Monday, Trump tweeted that he was calling on Federal Reserve Chairman Powell to cut the benchmark interest rate “much more aggressively,” and hinted at the need for more aggressive monetary easing, citing the housing market as an example. This came just ahead of this week’s Fed meeting.
Traders have fully priced in a 25 basis point rate cut at the September 16-17 FOMC meeting and see a 5% chance of a 50 basis point rate cut, according to the Chicago Mercantile Exchange’s (CME) FedWatch tool.
Technical Outlook Analysis OANDA:XAUUSD
On the daily chart, gold continues to renew its all-time high, surpassing the 0.618% Fibonacci extension level noted by readers in the previous issue. And now, it is likely to continue towards the full price level of $3,700 with all the technical indicators in place.
The RSI is operating in the overbought area (80-100) but has not shown any signal for a possible price decrease, a signal for a corrective price decrease is when the RSI bends down below 80. Therefore, in terms of momentum, gold remains very resilient.
The short-term trend is highlighted by the price channel, while the main support is from the EMA21.
As long as gold remains above the raw price point of $3,600, the main technical outlook in the short-term is bullish, the dips should only be viewed as a short-term correction or a new buying opportunity.
During the day, the bullish outlook for gold will be highlighted again by the following positions.
Support: $3,677 – $3,645
Resistance: $3,700 – $3,722
SELL XAUUSD PRICE 3699 - 3697⚡️
↠↠ Stop Loss 3703
→Take Profit 1 3691
↨
→Take Profit 2 3685
BUY XAUUSD PRICE 3645 - 3647⚡️
↠↠ Stop Loss 3641
→Take Profit 1 3653
↨
→Take Profit 2 3659

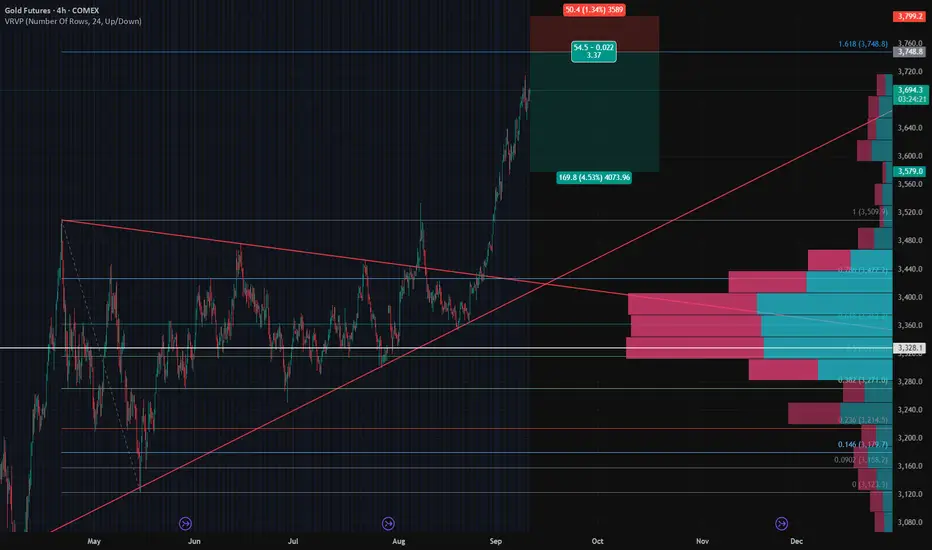
Gold Futures – Short Setup to Lock in Profits🟠 Gold Futures – Short Setup to Lock in Profits
Gold has had a strong breakout above the symmetrical triangle and has now pushed into an extended move near $3,700+. While the trend remains bullish on the higher timeframe, the current leg looks overextended, and I’m looking to hedge profits with a short setup.
🔑 Key Technicals
Pattern Breakout: Gold broke out of a long consolidation wedge and accelerated higher.
Resistance Zone: Price is testing the Fib 1.618 extension near $3,750, a potential exhaustion area.
Volume Profile: Strong demand zone sits between $3,300 – $3,360 where most volume is concentrated. A pullback could retest this area.
Risk-Reward: Setup gives ~1:3.4 RR with stop above recent highs and target into the HVN zone.
📉 Trade Idea – Protective Short
Entry: 3750
Stop Loss: 3800 (extension level).
Take Profit: $3580
⚖️ Strategy
This is not a reversal call – the larger trend is still bullish. The short setup is hedge/profit-protection only, aiming to capture a pullback after the parabolic leg.
I’ll be watching if buyers can defend $3,600 on the first dip; failure to hold could accelerate selling toward the high-volume zone.
📊 Bias
Short-term: Bearish (pullback expected)
Mid-term: Neutral to Bullish (trend intact above $3,300)
What do you think – do we see a healthy correction here, or is gold too strong to fade yet?
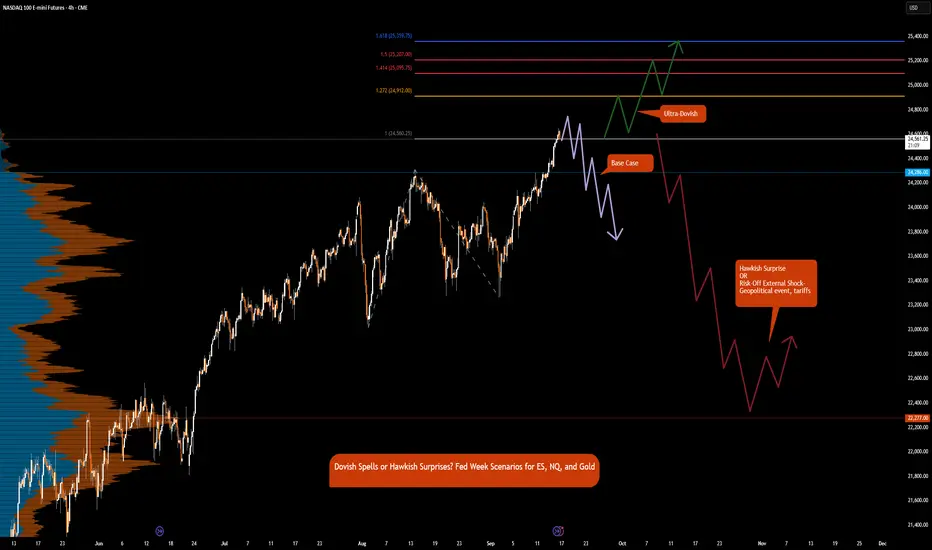
Dovish Spells or Hawkish Surprises? FOMC Prep for ES, NQ, GCLet’s start with the biggest event this week. Unless, of course, some unexpected headline swoops in and steals the spotlight — because markets love a good plot twist.
Emotions are running high, and volatility is flying around like confetti at a surprise party nobody asked for. But don’t worry, Chair Powell might just play the role of the calm voice in the chaos.
Markets are pricing in a 25 bps rate cut by the Fed this week. Interestingly, the future path of rate cut expectations has been in the doldrums. Is it a bird or a plane? No, it’s Superman. Likewise here, is it 1 cut or 2 cuts? No, it’s 3 cuts priced at this moment until the end of 2025.
Excuse the humor, but what fun is it if you cannot entertain yourself while analyzing the complexities of markets day in and day out. Execution is boring; risk management is much like dementors sucking out life force when risk is not respected. And analyzing and preparation is where the creativity and fun is.
And as Kurt Angle would say, it is “ True ”.
Index futures including ES futures and NQ futures have all climbed steadily higher since September 2 low. Markets are turning higher in anticipation of a new bull run.
Gold futures are rallying, currently trading above $3700. Since the Jackson Hole dovish pivot, gold has not looked back and has rocketed higher above major resistance.
Our focus is on the Fed meeting. All eyes will be on the forward guidance; risks to inflation, risks for the labor market and FED’s SEP (Summary of Economic Projections). This also includes GDP forecasts and the most anticipated Dot Plot.
Which of the two mandates will the Fed prioritize, labor market weakness or sticky inflation? The interesting thing to note is that despite sticky inflation, markets are anticipating 3 cuts of 25 bps for each of the meetings this year.
Thus far, as we have previously mentioned, the Fed will likely be moving away from their 2% inflation target to an average inflation target in the range of 2% to 3%.
This also implies that real rates i.e., nominal less inflation are going to fall sharply lower.
Given this, we anticipate gold to continue higher as the US Dollar's purchasing power erodes away, with mounting debt, higher inflation and falling real yields.
The real question we should be asking is:
What if the meeting outcome is hawkish with the Fed delivering just 1 cut in the September meeting and staying on hold for the remainder of the year?
What other risks are there that could pull stocks and indexes lower? And bonds higher?
Tariffs at this point seem like an old talk unless something reinvigorates and puts them on the front and center of market worries.
Based on these thoughts, here are our scenarios:
Base Case:
25 bps cuts and dovish guidance but iterates meeting by meeting approach.
ES & NQ:
Data dependent Fed, that is likely behind the curve and markets may translate this as Fed too slow to react to emerging risks, risks of recession goes higher. In this case, although stocks may push higher with rates coming down initially, in our view, much of this is priced in and this may be ‘sell the fact moment’.
Portfolio adjustment: Sell index futures, Buy Gold and Bonds.
Ultra-Dovish:
Fed’s dot plot confirms 2 additional rate cuts of 25 bps for Oct and Dec meeting and further 4 cuts till end of 2026 to bring terminal rate lower to 250-275.
USD weakens further, real rates sink, reinforcing gold bid.
Portfolio adjustment: Buy everything. Buy the dip.
Hawkish Surprise
Only 25 bps in September, then pause
ES & NQ:
• Sharp pullback as equities reprice for tighter liquidity.
• ES could retrace recent gains, downside risk toward 4,900–5,000 zone.
• NQ likely hit harder due to tech sensitivity to discount rate.
GC:
• Short-term correction as USD firms and yields spike.
• However, downside may be limited if market shifts focus back to debt & long-term inflation risks.
Risk-Off External Shock- Geopolitical event, tariffs
ES & NQ:
• Drop as risk sentiment sours; defensives outperform growth.
• Bonds rally, yields fall, curve steepens if Fed cut expectations accelerate.
GC:
• Strong safe-haven bid, spikes higher regardless of Fed stance.
Comment with your thoughts and let us know how you see the markets shaping up this week
XAUUSD Could top in September but long term looks bright.Gold (XAUUSD) has been trading within a Channel Up for the past 2 years and right now it is unfolding its latest Bullish Leg. That started after the previous pull-back/ consolidation phase (May - July) hit and found Support on the 1D MA100 (red trend-line).
This trend-line has been Gold's major Support and buy entry since mid-October 2023. Every pull-back on/ near it, kick-started a Bullish Leg, the weakest of which has been +16.59% and the strongest +23.75%.
Since April 15 2024, the 1D RSI Resistance has been a great indication of when to sell (equally for buying the Support), so even though we expect the current Bullish Leg to complete a +22.06% rise at least, we will be looking at the RSI Resistance more closely to time the sell.
The subsequent pull-back should bounce on the dashed pivot trend-line and naturally again on the 1D MA100, which will be a buy opportunity towards the ultimate long-term Target of 4300 (+22.00% again).
-------------------------------------------------------------------------------
** Please LIKE 👍, FOLLOW ✅, SHARE 🙌 and COMMENT ✍ if you enjoy this idea! Also share your ideas and charts in the comments section below! This is best way to keep it relevant, support us, keep the content here free and allow the idea to reach as many people as possible. **
-------------------------------------------------------------------------------
💸💸💸💸💸💸
👇 👇 👇 👇 👇 👇

Gold | Oil | Dollar | Silver | Natural Gas Price ForecastGold | Oil | Dollar | Silver | Natural Gas Price Forecast
NYMEX:NG1! AMEX:UNG AMEX:BOIL PEPPERSTONE:NATGAS

GOLD rebounds strongly, supported by US dataGold prices were volatile during the New York trading session on Thursday (September 11) due to the influence of the US CPI index and initial data on unemployment benefits applications. OANDA:XAUUSD price has recovered strongly during today's Asian session (September 12) and is currently trading at 3,647 USD/oz.
Very weak initial U.S. jobless claims data eased concerns over inflation data. The likelihood of a Federal Reserve rate cut next week remains high, supporting gold prices and recouping most of the day’s losses.
Data released by the U.S. Bureau of Labor Statistics on Thursday showed the consumer price index (CPI) rose more than expected in August from the previous month, but the year-over-year increase was in line with expectations.
The data showed that the CPI rose 0.4% month-over-month in August, beating the 0.3% forecast by economists surveyed by Dow Jones. However, the 2.9% year-over-year increase was in line with expectations. Moreover, the core CPI, which excludes the more volatile food and energy components, rose 0.3% month-over-month and 3.1% year-over-year, both in line with Dow Jones' forecasts.
Meanwhile, the US labor market is showing signs of slowing: weekly jobless claims unexpectedly jumped on Thursday after jobs growth data was revised down earlier this week. In the week ending September 6, initial jobless claims rose 27,000 to a seasonally adjusted 263,000, the highest since October 2021, far exceeding market expectations of 235,000.
Initial data on unemployment claims 'saved' OANDA:XAUUSD
Gold rallies after finding support at the 0.382% Fibonacci extension trendline note to readers in yesterday's issue.
The rally has now just cleared the 0.50% Fibonacci level, which provides the initial conditions for a possible retest of the all-time high at the 0.618% Fibonacci level.
The technical structure has not changed much with the uptrend dominating the market, from the uptrend channel as the main trend, the main support from EMA21 while RSI has not shown any signal for the possibility of a price decrease.
Therefore, the technical chart summary is completely uptrend and the notable price points during the day will be listed as follows.
Support: 3,613 - 3,600 USD
Resistance: 3,645 - 3,677 USD
SELL XAUUSD PRICE 3682 - 3680⚡️
↠↠ Stop Loss 3686
→Take Profit 1 3674
↨
→Take Profit 2 3668
BUY XAUUSD PRICE 3530 - 3532⚡️
↠↠ Stop Loss 3526
→Take Profit 1 3538
↨
→Take Profit 2 3544

Multi-Asset Execution Chart Analysis & TradesAnalysis Date : September 11, 2025
Trading Analyst : Institutional Intelligence Framework
Methodology : Enhanced Dual Renko Chart System with Optimized Technical Indicators
Executive Summary
Execution chart analysis validates the exceptional institutional opportunities identified in our structure analysis. All three primary equity indices show perfect technical confirmation of institutional positioning with strong momentum indicators. Commodity and currency markets reveal significant technical conflicts requiring defensive positioning adjustments.
Enhanced Indicator Configuration
DMI/ADX Visual Standards :
ADX (Green) : Trend strength indicator (>25 = strong trend)
+DI (Blue) : Bullish directional movement
-DI (Red) : Bearish directional movement
Line Weight : 3pt for enhanced visibility
Dual Stochastics Configuration :
Tactical (5,3,3) : %K (Dark Blue), %D (Teal) - Short-term momentum
Strategic (50,3,3) : %K (Black), %D (Red Circles) - Medium-term context
Primary Opportunities - Technical Validation (75-85% Total Allocation)
1. DOW JONES (YM) - 30-35% ALLOCATION
Classification : OPTIMAL RISK/REWARD - Superior Technical Confirmation
YM Execution View:
Execution Signal Analysis :
DEMA Status : Bullish alignment confirmed (black above orange)
ADX : 47.74 (highest trend strength among all indices)
+DI/-DI Ratio : 2.69:1 bullish dominance
Momentum Quality : Exceptional - strongest ADX with optimal positioning
Stochastics : Tactical 98.86/84.24, Strategic 98.86/84.02 (peak momentum)
Technical Trade Setup :
Bullish Scenario (80% probability) :
Entry : /MYM at current levels 46,050 (optimal positioning confirmed)
Technical Edge : Strongest ADX + minimal extension risk
Stop Loss : 45,000 (2.3% risk - best among indices)
Target 1 : 47,000 (+2.1% - close 40% position)
Target 2 : 48,000 (+4.2% - close 30% position)
Trail Strategy : 150-point swing lows on remaining 30%
Consolidation Scenario (15% probability) :
Range : 45,500-46,500 around YTD POC consensus
Strategy : Accumulate on any dips to 45,700
Advantage : Minimal downside to institutional support
Risk Management : Optimal positioning within institutional zone
Bearish Scenario (5% probability) :
Trigger : Break below 45,000 (institutional consensus violation)
Action : Reduce position by 50%
Probability : Very low given YTD POC validation and technical strength
Re-entry : Require fresh institutional accumulation evidence
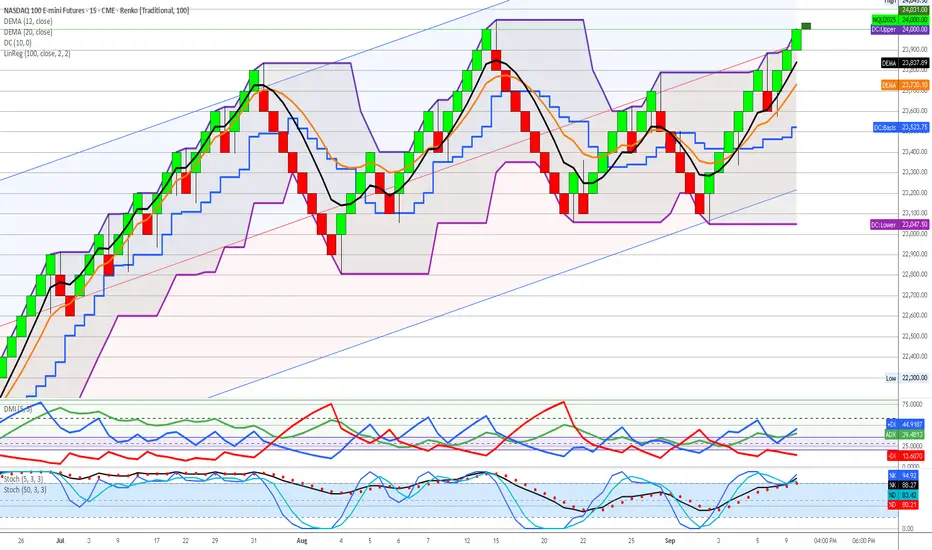
2. NASDAQ 100 (NQ) - 25-30% ALLOCATION
Classification : EXCEPTIONAL MOMENTUM - Exceptional Institutional Backing
NQ Execution View:
Execution Signal Analysis :
DEMA Status : Strong bullish alignment (black above orange)
ADX : 44.91 (exceptional trend strength)
+DI/-DI Ratio : 2.90:1 bullish dominance (highest among indices)
Momentum Quality : Exceptional directional bias
Stochastics : Tactical 88.27/80.21, Strategic 88.27/80.21 (strong sustainable)
Technical Trade Setup :
Bullish Scenario (75% probability) :
Entry : /MNQ at current levels or pullback to 23,700-23,800
Technical Edge : Highest +DI/-DI ratio with institutional backing
Stop Loss : 23,000 (4.3% risk)
Target 1 : 25,000 (+4.3% - close 50% position)
Target 2 : 25,500 (+6.1% - close 25% position)
Trail Strategy : 100-point swing lows on remaining 25%
Consolidation Scenario (20% probability) :
Range : 23,500-24,500 above institutional accumulation
Strategy : Scale into weakness, maintain core position
Management : Use tactical stochastics for entry timing
Support : 26.8:1 institutional backing provides confidence
Bearish Scenario (5% probability) :
Trigger : Break below 23,000 (Q3 POC violation)
Action : Exit all positions immediately
Reassessment : Wait for institutional re-accumulation
Probability : Very low given exceptional institutional support
3. S&P 500 (ES) - 20-25% ALLOCATION
Classification : SOLID CONFIRMATION - Strong Institutional Support
ES Execution View:
Execution Signal Analysis :
DEMA Status : Bullish alignment maintained (black above orange)
ADX : 41.32 (strong trend strength)
+DI/-DI Ratio : 1.74:1 bullish dominance
Momentum Quality : Solid institutional validation
Stochastics : Tactical 34.44/93.30, Strategic 98.26/95.30 (extreme overbought)
Technical Trade Setup :
Bullish Scenario (70% probability) :
Entry : /MES on any pullback to 6,450-6,500
Current Caution : Strategic stochastics extremely overbought
Stop Loss : 6,300 (3.8% risk)
Target 1 : 6,700 (+2.8% - close 50% position)
Target 2 : 6,800 (+4.4% - close 25% position)
Profit Management : Take profits on strength given overbought conditions
Consolidation Scenario (25% probability) :
Range : 6,400-6,600 around institutional levels
Strategy : Wait for tactical stochastics to reset before adding
Management : Reduce position size until momentum cools
Context : Strategic overbought suggests pause needed
Bearish Scenario (5% probability) :
Trigger : Break below 6,300 (institutional support failure)
Action : Systematic position reduction
Management : Tight stops given overbought technical readings
Re-entry : Wait for technical reset and institutional validation
Secondary Opportunities - Mixed Technical Signals (10-15% Total Allocation)
4. WTI CRUDE OIL (CL) - 8-12% ALLOCATION
Classification : INSTITUTIONAL CONFLICT - Defensive Positioning Required
CL Execution View:
Execution Signal Analysis :
DEMA Status : Bullish alignment (black above orange)
ADX : 42.19 (strong trend strength)
+DI/-DI Ratio : BEARISH 2.44:1 (-DI 42.10 vs +DI 17.86)
Critical Conflict : DEMA bullish vs DMI strongly bearish
Stochastics : Tactical 9.26/27.64, Strategic 27.64/33.61 (oversold setup)
Technical Trade Setup :
Bullish Scenario (45% probability) :
Entry Criteria : WAIT for +DI to cross above -DI for confirmation
Current Action : Reduce position size due to momentum conflict
Stop Loss : 61.50 (tight due to bearish momentum)
Target : 65.50 if technical alignment achieved
Risk Management : Maximum 1.5% account risk due to signal conflict
Neutral Scenario (35% probability) :
Range : 62.00-64.00 within institutional accumulation
Strategy : Maintain minimal defensive position
Monitoring : Daily +DI/-DI relationship for momentum shift
Institutional Support : Strong Q2 accumulation provides floor
Bearish Scenario (20% probability) :
Trigger : Break below 61.00 (institutional support failure)
Action : Complete position liquidation
Reason : Bearish momentum confirming institutional breakdown
Re-entry : 58.00 area (Q2 POC support) with technical confirmation
High-Risk Positions - Technical Deterioration (0-8% Total Allocation)
5. NATURAL GAS (NG) - 3-5% ALLOCATION
Classification : HIGH RISK - Institutional Disengagement Confirmed
NG Execution View:
Execution Signal Analysis :
DEMA Status : Bearish alignment (black below orange)
ADX : 42.79 (strong trend - bearish direction)
+DI/-DI Ratio : EXTREME BEARISH 6.30:1 (-DI 53.25 vs +DI 8.45)
Technical Reality : All major indicators bearishly aligned
Stochastics : Tactical 0.00/6.70 (maximum oversold), Strategic 51.98/65.70
Technical Trade Setup :
Bullish Scenario (20% probability) :
Entry Criteria : AVOID - all technical signals bearish
Required Confirmation : DEMA bullish cross + DMI reversal + institutional re-engagement
Current Action : Complete avoidance recommended
Speculative Only : Maximum 1% account risk if attempting reversal play
Neutral Scenario (30% probability) :
Range : 2.80-3.20 with declining institutional participation
Strategy : Avoid new positions, monitor for institutional return
Risk : 65% volume decline from Q1 peak activity
Liquidity : /MNG insufficient volume (13,991) for meaningful sizing
Bearish Scenario (50% probability) :
Continuation : Further decline toward 2.50-2.70 historical lows
Institutional Reality : Smart money disengagement pattern
Technical Confirmation : 6.30:1 bearish momentum supports decline
Strategy : Complete avoidance until institutional re-engagement
6. EURO FUTURES (6E) - 2-3% ALLOCATION
Classification : DANGEROUS EXTENSION - Technical Breakdown Confirmed
6E Execution View:
Execution Signal Analysis :
DEMA Status : Bearish crossover (black below orange)
ADX : 29.21 (moderate trend strength)
+DI/-DI Ratio : BEARISH 1.19:1 (-DI 29.21 vs +DI 24.49)
Extension Risk : 12.1% above YTD POC institutional consensus
Stochastics : Tactical 23.24/66.57, Strategic 74.26/90.89 (extremely overbought)
Technical Trade Setup :
Bullish Scenario (15% probability) :
Entry : AVOID - dangerous extension with technical breakdown
Existing Positions : Immediate systematic profit-taking required
Risk : Overextension + bearish technical = correction imminent
Management : Emergency profit-taking protocols engaged
Neutral Scenario (25% probability) :
Range : 1.1650-1.1800 at dangerous extension levels
Strategy : Avoid range trading given extension risk
Risk Assessment : All signals point to mean reversion
Professional Response : Defensive positioning only
Bearish Scenario (60% probability) :
Target : Return to YTD POC 1.0525 (-12.1% correction)
Technical Trigger : DEMA bearish cross + momentum deterioration
Strategy : Short opportunities on any strength above 1.1780
Entry : /M6E shorts with tight stops above 1.1820
Risk Control : Maximum 1% account risk given extension
7. GOLD FUTURES (GC) - 0% ALLOCATION
Classification : LIQUIDATION - High Risk Territory
GC Execution View:
Execution Signal Analysis :
DEMA Status : Bearish crossover from distribution highs
ADX : 34.91 (declining trend strength)
+DI/-DI Ratio : BEARISH 1.31:1 (-DI 34.91 vs +DI 26.64)
Extension Risk : 12.2%+ beyond ALL institutional positioning
Stochastics : Tactical 11.25/30.89, Strategic 89.46/93.86 (maximum overbought)
Technical Trade Setup :
Emergency Liquidation Protocol :
Immediate Action : Complete liquidation using market orders if necessary
Rationale : Void territory + technical breakdown = catastrophic risk
No Stops : Emergency exit protocols - immediate execution required
Reallocation : Proceeds to YM, NQ, ES primary opportunities immediately
Short Opportunity (High Probability) :
Strategy : /MGC shorts on any rallies above 2,690
Target : 2,380-2,400 (return to institutional zones)
Stop : 2,720 (tight risk control)
Correction Magnitude : 12-15% decline expected
Risk : Maximum 1% account risk for speculative short
Portfolio Risk Management Protocols
Position Sizing Framework
Maximum Risk Per Trade : 2% account value (1.5% for conflicted signals)
Portfolio Heat Limit : 15% total risk across all positions
Correlation Controls : Maximum 85% equity exposure given technical alignment
Cash Management : 5-10% opportunity fund for technical setups
Technical Signal Hierarchy
Primary Confirmation : DEMA + DMI + ADX alignment required
Entry Timing : Stochastics for tactical positioning optimization
Risk Management : Institutional levels for strategic stop placement
Profit Taking : Systematic protocol at 2:1, 3:1, trail remainder
Market Scenario Analysis
Scenario A: Continued Equity Strength (70% probability)
Characteristics : Technical momentum sustains institutional accumulation
Winners : YM, NQ, ES (maximize allocation to 85%)
Losers : GC, 6E (extension corrections accelerate)
Strategy : Aggressive equity positioning, complete defensive liquidation
Technical Catalyst : ADX strength maintenance + DEMA alignment
Scenario B: Technical Consolidation (25% probability)
Characteristics : Momentum indicators cool, range-bound trading
Management : Reduce position sizes, use stochastics for timing
Opportunity : Accumulate on pullbacks to institutional levels
Risk Control : Tighter stops, faster profit-taking on strength
Technical Signal : ADX decline below 35, stochastics reset
Scenario C: Technical Breakdown (5% probability)
Trigger : DEMA bearish crosses on primary indices
Action : Emergency position reduction protocols
Management : Systematic liquidation, increase cash to 25%+
Re-entry : Wait for institutional level retests with technical confirmation
Probability : Very low given exceptional institutional backing
Weekly Monitoring Checklist
Daily Technical Assessment
DEMA relationship maintenance across all positions
DMI momentum quality and directional bias confirmation
Stochastics positioning for entry/exit timing optimization
ADX strength validation for trend continuation
Risk Management Verification
Position sizing within 2% account risk per trade
Portfolio heat below 15% total risk exposure
Stop loss proximity to institutional support levels
Profit-taking discipline at predetermined targets
Technical Signal Evolution
Cross-asset momentum convergence/divergence analysis
Stochastics reset opportunities for position optimization
DEMA separation quality for trend strength assessment
Institutional level respect vs violation monitoring
Key Success Factors
Technical Execution Excellence
Signal Clarity : Enhanced visual indicators enable precise timing
Risk Discipline : Systematic adherence to technical signal hierarchy
Momentum Quality : ADX + DMI confirmation prevents false signals
Entry Optimization : Dual stochastics for tactical timing precision
Institutional Integration
Strategic Context : Structure charts provide positioning intelligence
Tactical Timing : Execution charts optimize entry/exit precision
Risk Management : Institutional levels anchor stop placement
Professional Standards : Both frameworks align for optimal decisions
Framework Validation Results
Primary Opportunities : Perfect technical confirmation of institutional intelligence
Risk Identification : Technical signals validate structure chart warnings
Professional Execution : Enhanced indicators enable institutional-grade precision
Capital Preservation : Systematic risk management across all timeframes
Risk Disclaimer : All trading involves substantial risk of loss. Past performance does not guarantee future results. Technical analysis and institutional intelligence frameworks are tools for risk assessment and should not be considered guaranteed predictors of future price movement. Position sizing and risk management protocols must be adjusted based on individual account size, risk tolerance, and market conditions.
Document Status : Active execution framework requiring daily technical monitoring and weekly risk assessment updates. Integration with structure analysis mandatory for optimal decision-making.
Framework Evolution : Enhanced visual indicators and systematic technical analysis represent significant advancement in execution precision. Continuous optimization based on market regime changes and signal quality assessment required.
Multi-Asset Market Analysis & Trade IdeasAnalysis Date : September 10, 2025
Trading Analyst : Institutional Intelligence Framework
Methodology : Dual Renko Chart System with Enhanced Volume Profile Analysis
Executive Summary
Current market analysis reveals exceptional institutional opportunities across equity indices with significant commodity sector divergence. The enhanced institutional intelligence framework identifies unprecedented buying dominance in major equity markets while revealing dangerous extensions in traditional safe-haven assets.
Portfolio Allocation Strategy : 75-85% equity allocation with minimal commodity/currency exposure based on institutional positioning intelligence.
Primary Opportunities (70-85% Total Allocation)
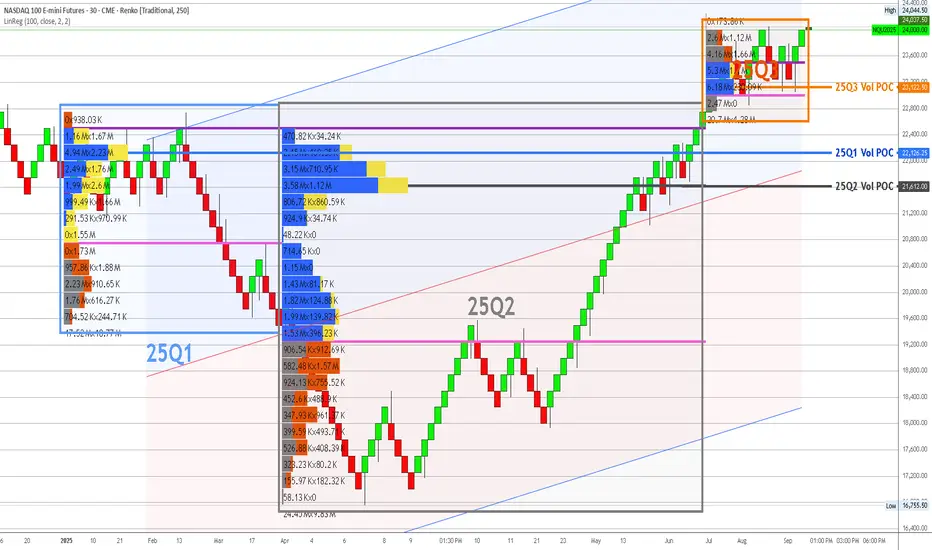
1. NASDAQ 100 (NQ) - 25-30% ALLOCATION
Classification : PRIMARY OPPORTUNITY - Institutional Backing
YTD View:
Institutional Intelligence :
Q3 Volume Analysis : 26.8:1 buying dominance (6.18M UP vs 230.69K DOWN)
Current Position : 23,963 (+3.4% above Q3 POC 23,186)
Support Structure : Exceptional multi-quarter institutional foundation
Risk Assessment : LOWEST RISK - strongest institutional conviction identified
Trade Recommendations :
Bullish Scenario (65% probability) :
Entry : /MNQ at current levels or any pullback to 23,500-23,600
Position Size : Maximum 2.5% account risk per position
Target 1 : 24,500 (close 50% position)
Target 2 : 25,000 (close 25% position)
Target 3 : 25,500+ (trail remaining 25%)
Stop Loss : 23,000 (below Q3 institutional support)
Neutral Scenario (25% probability) :
Range : 23,200-24,200 consolidation
Strategy : Scale into positions on weakness toward 23,400
Management : Hold core position, trade edges of range
Re-evaluation : Weekly basis for breakout confirmation
Bearish Scenario (10% probability) :
Trigger : Break below 23,000 (institutional support failure)
Action : Exit all positions immediately
Re-entry : Require fresh institutional accumulation evidence
Risk Control : Maximum 2% loss on allocation
2. S&P 500 (ES) - 25-30% ALLOCATION
Classification : PRIMARY OPPORTUNITY - Strong Institutional Support
3-QTR View:
YTD View:
Institutional Intelligence :
Q3 Volume Analysis : 5.21:1 buying dominance (11.3M UP vs 2.17M DOWN)
Current Position : 6,550 (+2.7% above Q3 POC 6,375)
Support Structure : Consistent institutional accumulation across quarters
Risk Assessment : LOW RISK - exceptional institutional backing
Trade Recommendations :
Bullish Scenario (70% probability) :
Entry : /MES at current levels or pullback to 6,450-6,500
Position Size : Maximum 2.5% account risk per position
Target 1 : 6,650 (close 50% position)
Target 2 : 6,750 (close 25% position)
Target 3 : 6,850+ (trail remaining 25%)
Stop Loss : 6,300 (below Q3 institutional support)
Neutral Scenario (20% probability) :
Range : 6,400-6,600 consolidation
Strategy : Accumulate on weakness, trim on strength
Management : Maintain core position size
Monitoring : Weekly institutional level respect
Bearish Scenario (10% probability) :
Trigger : Break below 6,300 (institutional support violation)
Action : Systematic position reduction
Stop Loss : 6,250 (complete exit level)
Re-entry : Wait for institutional re-engagement signals
3. DOW JONES (YM) - 20-25% ALLOCATION
Classification : HIGH CONVICTION - YTD POC Validation
3-QTR View:
YTD View:
Institutional Intelligence :
Q3 Volume Analysis : 11.5:1 buying dominance (455.32K UP vs 83.17K DOWN)
YTD POC Alignment : Perfect alignment with Q1 POC at 45,150
Current Position : 45,651 (+1.1% above institutional consensus)
Risk Assessment : VERY LOW RISK - optimal positioning
Trade Recommendations :
Bullish Scenario (75% probability) :
Entry : /MYM at current levels (optimal positioning confirmed)
Position Size : Maximum 2.5% account risk per position
Target 1 : 46,200 (close 40% position)
Target 2 : 46,800 (close 30% position)
Target 3 : 47,500+ (trail remaining 30%)
Stop Loss : 44,800 (below YTD/Q1 POC consensus)
Neutral Scenario (20% probability) :
Range : 45,000-46,000 consolidation around institutional consensus
Strategy : Hold core position, add on dips to 45,200
Management : Optimal risk/reward positioning maintained
Advantage : Minimal downside to institutional support
Bearish Scenario (5% probability) :
Trigger : Break below 45,000 (YTD POC violation)
Action : Reduce position by 50%
Ultimate Stop : 44,500 (complete exit)
Assessment : Highly unlikely given institutional validation
Secondary Opportunities (15-20% Total Allocation)
4. WTI CRUDE OIL (CL) - 15-20% ALLOCATION
Classification : SOLID OPPORTUNITY - Strong Institutional Foundation
3-QTR View:
YTD View:
Institutional Intelligence :
Q3 Volume Analysis : 1.94:1 buying dominance (1.38M UP vs 710.76K DOWN)
Current Position : 63.27 (within Q3 institutional accumulation zone)
Support Structure : Massive Q2 institutional accumulation at 57.50
Risk Assessment : LOW RISK - multiple institutional support layers
Trade Recommendations :
Bullish Scenario (60% probability) :
Entry : /MCL at current levels or pullback to 62.50-63.00
Position Size : Maximum 2% account risk per position
Target 1 : 67.00 (close 50% position)
Target 2 : 69.00 (close 25% position)
Target 3 : 71.00+ (trail remaining 25%)
Stop Loss : 61.50 (below Q3 institutional support)
Neutral Scenario (30% probability) :
Range : 62.00-65.00 consolidation within institutional zone
Strategy : Scale into positions on weakness
Management : Patient accumulation approach
Support : Strong institutional backing provides downside protection
Bearish Scenario (10% probability) :
Trigger : Break below 61.00 (institutional support failure)
Action : Exit positions systematically
Re-entry : 58.00 area (Q2 POC support)
Risk Management : Tight stops due to support proximity
Defensive Positions (8-12% Total Allocation)
5. NATURAL GAS (NG) - 8-12% ALLOCATION
Classification : MODERATE RISK - Declining Institutional Engagement
3-QTR View:
YTD View:
Institutional Intelligence :
Q3 Volume Analysis : Mixed activity with reduced institutional participation
Q1 Peak : 10.6:1 buying dominance (697K UP vs 65K DOWN) - historical high
Current Concern : 65% volume decline from Q1 peaks
Risk Assessment : MODERATE - institutional disengagement evident
Trade Recommendations :
Bullish Scenario (45% probability) :
Entry : Current levels only with tight risk controls
Position Size : Maximum 1.5% account risk per position
Target 1 : 3.40 (close 60% position)
Target 2 : 3.60 (close remaining 40%)
Stop Loss : 2.90 (below Q3 POC support)
Neutral Scenario (35% probability) :
Range : 3.00-3.20 consolidation
Strategy : Avoid new positions, monitor for re-engagement
Management : Maintain defensive positioning
Watch : Volume quality for institutional return
Bearish Scenario (20% probability) :
Trigger : Break below 2.90 (Q3 support failure)
Action : Complete position liquidation
Assessment : Institutional abandonment acceleration
Avoidance : No re-entry until fresh accumulation evidence
Risk Management Positions (8-13% Total Allocation)
6. EURO FUTURES (6E) - 5-8% ALLOCATION
Classification : DEFENSIVE ONLY - Dangerous Extension
3-QTR View:
YTD View:
Institutional Intelligence :
YTD POC Analysis : 1.0525 (aligned with Q1 POC)
Current Position : 1.1769 (+12.9% above institutional consensus)
Extension Risk : DANGEROUS - trading far beyond smart money positioning
Risk Assessment : HIGH RISK - profit-taking territory
Trade Recommendations :
Bullish Scenario (25% probability) :
Entry : AVOID new long positions
Existing Positions : Systematic profit-taking recommended
Target : 1.1850 maximum (close all positions)
Risk : Overextension beyond institutional support
Neutral Scenario (35% probability) :
Range : 1.1650-1.1800 at dangerous extension levels
Strategy : Range trading only with tight stops
Position Size : Maximum 1% account risk
Management : Defensive positioning required
Bearish Scenario (40% probability) :
Trigger : Any breakdown below 1.1700
Target : Return to institutional consensus (1.0525)
Action : Short opportunities on strength
Strategy : Mean reversion to YTD POC likely
7. GOLD FUTURES (GC) - 3-5% ALLOCATION
Classification : EXTREME CAUTION - Maximum Extension
3-QTR View:
YTD View:
Institutional Intelligence :
Extension Analysis : 12.2% above all institutional positioning
Q2 Peak Activity : 11.5:1 buying dominance at 3,430 levels
Current Position : 2,676 (extremely overextended)
Risk Assessment : MAXIMUM RISK - correction vulnerability
Trade Recommendations :
Bullish Scenario (15% probability) :
Entry : AVOID all new long positions
Existing : Immediate profit-taking recommended
Risk : Extreme overextension unsustainable
Management : Defensive exit strategy only
Neutral Scenario (25% probability) :
Range : 2,650-2,700 at unsustainable levels
Strategy : No positioning recommended
Assessment : Range trading too risky given extension
Monitoring : Watch for breakdown signals
Bearish Scenario (60% probability) :
Target : 3,400-3,500 (return to institutional zones)
Correction Magnitude : 12-15% decline likely
Strategy : Short opportunities on any strength
Entry : /MGC shorts on rallies above 2,690
Stop : 2,720 (tight risk control)
Target : 3,450 (institutional accumulation zone)
Risk Management Protocols
Position Sizing Framework
Maximum Risk Per Trade : 2% of account value
Maximum Sector Exposure : 6% (energy, metals, currencies)
Portfolio Heat : Maximum 15% total risk across all positions
Cash Reserve : 5-12% for opportunities and margin requirements
Stop Loss Hierarchy
Tactical Stops : 2-3 Renko blocks on execution charts
Strategic Stops : Below/above institutional POC levels
Emergency Stops : Below major quarterly support levels
Time Stops : Exit if no progress within 15 trading days
Profit Taking Protocol
Systematic Approach :
Target 1 : Close 40-50% of position at 2:1 risk/reward
Target 2 : Close 25-30% of position at 3:1 risk/reward
Target 3 : Trail remaining 20-25% with institutional level stops
Correlation Management
Equity Exposure : Maximum 75-85% combined (NQ+ES+YM)
Commodity Exposure : Maximum 25-30% combined (CL+NG)
Currency Exposure : Maximum 10% (6E only)
Safe Haven Exposure : Maximum 5% (GC defensive only)
Market Scenario Planning
Scenario A: Continued Equity Strength (60% probability)
Characteristics : Institutional accumulation continues, economic resilience
Winners : NQ, ES, YM (maximize equity allocation)
Losers : GC, 6E (extension corrections)
Strategy : Aggressive equity positioning, defensive commodity stance
Scenario B: Market Consolidation (25% probability)
Characteristics : Range-bound trading around institutional levels
Winners : YM (optimal positioning), CL (institutional support)
Neutral : NQ, ES (trade ranges)
Strategy : Reduce position sizes, focus on institutional level trading
Scenario C: Risk-Off Environment (15% probability)
Characteristics : Institutional support failure, flight to quality
Winners : Cash, defensive positioning
Losers : All risk assets
Strategy : Emergency protocols, systematic position reduction
Trigger : Break below major institutional support levels
Weekly Monitoring Checklist
Daily Assessment
Institutional POC level respect across all markets
Volume quality and institutional engagement trends
Position sizing within risk parameters
Stop loss proximity to institutional levels
Weekly Review
Portfolio allocation vs. target percentages
Risk/reward ratios for all open positions
Institutional volume profile evolution
Correlation analysis across positions
Performance tracking vs. benchmarks
Monthly Evaluation
Quarterly volume profile updates
YTD POC alignment reassessment
Strategy performance attribution
Risk management protocol effectiveness
Market regime change identification
Key Success Factors
Institutional Intelligence Priority
Decision Hierarchy :
Institutional volume profile positioning (strategic)
YTD POC alignment validation (tactical)
Technical indicator confirmation (execution)
Risk management protocols (defensive)
Discipline Requirements
Systematic adherence to position sizing formulas
Emotional detachment from individual trade outcomes
Institutional level respect over short-term price action
Professional risk management with systematic protocols
Performance Expectations
Win Rate Target : 55-65% (institutional backing advantage)
Risk/Reward Minimum : 2:1 average across all trades
Maximum Drawdown : <8% of trading capital
Consistency : Positive monthly returns 65%+ of time
Disclaimer : All trading involves risk of loss. Past performance does not guarantee future results. Position sizes and risk management protocols must be adjusted based on individual account size and risk tolerance. This analysis is for educational purposes and should not be considered personalized investment advice.
Document Status : Active trading framework requiring weekly updates and quarterly reassessment.
XAUUSD Stable uptrend eyes quick rise to $3695Gold (XAUUSD) has been trading within a short-term Channel Up on the 1H time-frame lately, fueled mainly by its 1H MA20 (red trend-line), with the 1H MA50 (blue trend-line) acting as the last Support.
Right now it is holding the 1H MA20 and as long as it does, we expect it to repeat at least a +1.87% Bullish Leg, similar to the last two. Our immediate Target is $3695.
-------------------------------------------------------------------------------
** Please LIKE 👍, FOLLOW ✅, SHARE 🙌 and COMMENT ✍ if you enjoy this idea! Also share your ideas and charts in the comments section below! This is best way to keep it relevant, support us, keep the content here free and allow the idea to reach as many people as possible. **
-------------------------------------------------------------------------------
💸💸💸💸💸💸
👇 👇 👇 👇 👇 👇

A Gold/GLD Drop Scenario You Should Not IgnoreSometimes you don't need a ton of information.
Sometimes, it's just the right moment when a few facts come together, and you make up your mind.
That's the case now with Gold for me.
We know that the behavior changed when Gold left the Fork in July.
We also know that if price leaves a Fork, it's highly possible we’ll see a test/re-test at the L-MLH, the lower median line parallel.
Additionally, Allan H. Andrews, the inventor of the Median Lines/Forks, wrote back then that price could also crawl along the parallel line for a longer period. And if price can't manage to jump back into the Fork—regaining the trajectory of the slope—it will trade in the opposite direction sooner or later.
Last but not least: I checked GLD too. Surprisingly it reached the Centerline just yesterday (See screenshot in the right lower corner of the Chart). So price has a high tendency to turn in the opposite direction when balanced again.
So, there you have it.
I’m planning a short, with profits at the WL as my first target.
But what if it goes wrong, if price climbs higher?
Well, then I’ll probably get stopped out, which is nothing more than part of this business.
Any questions?
Don't hesitate to ask me. It's the only way humans learn—by asking questions.
Cheers
§8-)