RTX Forecast 2026: The "Golden Dome" Drives a Cash Flow SupercycRaytheon Technologies (RTX) has delivered a decisive message to the market: cash is king, and the defense supercycle is accelerating.
Following a Q4 2025 earnings beat highlighted by $7.9 billion in full-year free cash flow (FCF), the stock is poised for a breakout. While geopolitical friction and executive tensions with the White House create headlines, the underlying mechanics of Raytheon’s business model are generating immense shareholder value.
Economics: The Free Cash Flow Engine
The financial narrative is straightforward: efficiency. Raytheon reported Q4 revenue of $24.2 billion (+12% YoY), beating market estimates. More importantly, the company is converting revenue into cash at an elite rate.
2025 FCF: $7.9 billion (exceeding targets).
2026 Outlook: Projections of $8.25–$8.75 billion suggest the "operational cleanup" phase is over.
Investors should note the FCF margin expansion. Unlike peers struggling with fixed-price cost overruns, RTX’s mix of high-margin aftermarket services (Collins Aerospace) and mature defense platforms (Patriot/Tomahawk) provides a buffer against inflation. The projected 10% YoY adjusted EPS growth to $6.29 confirms that volume, not just pricing, is driving profit.
Geostrategy: The "Golden Dome" & Arctic Friction
President Trump’s "Golden Dome" initiative, a multi-layered continental missile defense shield, is the most significant catalyst for RTX. As the provider of the "kill chain" sensors (LTAMDS radar) and effectors (SM-3, SM-6), RTX is indispensable to this architecture.
However, execution risks remain. The "Golden Dome" requires northern sensor sites, triggering political friction with Canada and Greenland. If diplomatic rows delay site access, the valuation premium attached to these future contracts could compress. Furthermore, criticism regarding "buybacks vs. capacity" adds a layer of political volatility. RTX management’s commitment to a $500 million capacity expansion in 2026 is a direct strategic response to appease policymakers while protecting the dividend.
Technology: Tomahawk and RAM Modernization
Raytheon’s moat is built on keeping legacy platforms lethal.
* Tomahawk Block V: A recent $380 million Navy contract to modernize Tomahawks ensures relevance through 2029. The Block Va "Maritime Strike" variant can hit moving targets at sea, a critical capability for Indo-Pacific deterrence.
* Rolling Airframe Missile (RAM): A $19.3 million contract for RAM support highlights the demand for ship self-defense. The RAM’s unique "rolling" airframe stabilizes its RF/IR seeker, allowing for "fire-and-forget" intercepts of supersonic anti-ship cruise missiles.
Patent Analysis: Thermal Management
A review of recent patent filings indicates a shift in R&D focus toward thermal management systems for the F135 engine and future propulsion.
The Tech: Patents for "thermo-acoustic" cooling and advanced heat sinks are critical. As sensors and directed energy weapons on 6th-generation fighters demand more power, engines must dissipate massive heat loads without compromising stealth.
The Moat: By controlling the thermal IP of the F135 Engine Core Upgrade (ECU), RTX locks the Pentagon into its propulsion ecosystem for decades, blocking competitors from encroaching on the F-35 program.
Cyber Security: Hardening the Kill Chain
The digitization of the battlefield introduces new vectors for attack. The "Golden Dome" relies on datalinks between space sensors and ground interceptors. RTX is aggressively investing in Zero Trust architectures for its command-and-control systems.
Early testing of legacy systems identified cyber vulnerabilities; today, "modernization" contracts explicitly include hardening against electronic warfare (EW) and spoofing. In a conflict with near-peer adversaries, the ability of a missile to ignore jammed GPS signals via TERCOM (Terrain Contour Matching) is as vital as the warhead itself.
Conclusion: A Defensive Stronghold
Raytheon is navigating a complex environment with high proficiency.
Bull Case: Record backlog ($268B), accelerating FCF, and central role in "Golden Dome" justify a price target of $217+.
Bear Case: Tariffs ($600M impact) and political volatility could cap near-term multiple expansion.
Verdict: BUY. The dip from the January peak offers an entry point. The 2026 FCF guidance provides a safety net, while the geopolitical supercycle offers uncapped upside.
Geopolitics

Will Gas Prices Collapse or Skyrocket in 2026?The natural gas market stands at a critical inflection point in 2026, transforming from a simple commodity into a geopolitical weapon and economic force. A massive surge in global LNG capacity, dubbed the "third wave," is reshaping the entire energy landscape. The United States has achieved record production levels of 108.5 billion cubic feet per day, while new liquefaction facilities from Qatar to the Gulf Coast prepare to flood markets with an additional 300 billion cubic meters by 2030. This abundance has driven domestic prices down, saving American consumers $1.6 trillion over 17 years and pushing gasoline to 4-year lows.
However, this supply glut creates a paradox. While North American producers maintain unprecedented output, global volatility intensifies as regional markets become interconnected. A production disruption in Qatar now affects prices in Houston; a cold snap in Tokyo impacts manufacturing costs in Berlin. Geopolitical risks have escalated dramatically, pipelines have become legitimate military targets, cyberattacks on infrastructure are industrialized, and traditional alliances fracture under sanctions. Russia's gas flows through Azerbaijan to Europe exemplify how energy security has become a theater for strategic manipulation.
Technology accelerates both opportunity and risk. Artificial Intelligence now drives exploration decisions and trading algorithms, while satellites patrol for methane leaks. Yet the industry faces existential threats: state-sponsored hackers target control systems, carbon regulations tighten globally, and the economics of stranded assets loom large. Capital discipline has replaced the boom-bust mentality of previous cycles, with producers prioritizing margins over volume. The convergence of massive supply, geopolitical tension, and technological transformation creates a market where the only certainty is radical uncertainty, making natural gas simultaneously more abundant and more volatile than ever before.

$GOLD - Yellowstone's Shine'Our TVC:GOLD is no longer safe in the Fed’s vaults’
“Given the current geopolitical situation, it seems risky to store so much TVC:GOLD in the U.S” “In the interest of greater strategic independence from the US, the Bundesbank would therefore be well advised to consider repatriating the $Gold.
- leading economist and former Bundesbank head of research Emanuel Mönch told the German press on Friday.
TVC:GOLD loving uncertainty printed a New All Time High during Asian Session (26/1/2026) ;
defeating swiftly the 5.000$ per troy ounce psychological benchmark.
Seems like every pull back seen on TVC:GOLD 's charts,
is another great opportunity to BUY.
Firmly based on a large scale of structural demand purposes for TVC:GOLD ,
vastly noting the accumulation phase of Central Banks and Sovreings States since 2008 Financial Crisis;
People’s Bank of China ECONOMICS:CNGRES remains a steady long-term buyer, adding TVC:GOLD monthly even amid record prices, out-pacing $USGRESUnited States, ECONOMICS:GBGRES United Kingdom, ECONOMICS:EUGRES European Union as a whole and ECONOMICS:CHGRES Switzerland .
So has done Russia ECONOMICS:RUGRES , Japan ECONOMICS:JPGRES , ECONOMICS:PLGRES Poland and Germany ECONOMICS:DEGRES .
However, current uptrend isn't soly supported by a long accumulation phase past 2008 Financial Crisis.
Tariffs threats of Donald Trump towards China, Canada, South-Korea have spooked investors, trying to hedge on the yellowstone against trade-wars.
Geo-Politics have been popping up on consistent basis ever since Russia-Ukraine war took place on 202;
while lately conflicts brewing with U.S and Venezuela, Iran, and tensions between Greenland take over which has troubled the European Union and NATO.
Also a shunning TVC:DXY and a troubled-policy driven currency like Japanese-Yen are losing strength as an hedge.
Their appeal being dimmed can be found at how Commercial and Central Banks have been adding up on their TVC:GOLD reserves like never before.
With TVC:GOLD and TVC:SILVER prices increasing fast,
seems like retailers have a low probability to accumulate as much as they wish to do so on lower prices.
Wether you're a Spot buyer or a CFD trader, is not smart to counter-trend against precious metals.
While many wondering where the top is, forecasts of big players varies from 5.500$/oz to 7.000$ by end year of 2026.
What's important seeking out is not the peak or the bottom, but rather focusing on what price levels will be for the next pro-longed accumulation phase that shall follow when Geo-Politics uncertainty comes to an end and a more positive stabilization of TVC:DXY and other macro-economics factors such as Interest Rates and Inflation.

Gold at $7,000? The Strategic Case for the Next Historic LeapGold has shattered the psychological glass ceiling. With spot prices piercing the $5,000 mark in January 2026, the yellow metal has entered uncharted territory. While UBS forecasts a consolidation around $5,000, a growing chorus of institutional voices now identifies a credible path to $7,000 per ounce. This trajectory is not merely speculative; it is the mathematical output of a fractured global order. The following analysis dissects the structural drivers propelling gold toward this new paradigm.
Geopolitics: The Chaos Premium
The "fear trade" has evolved into a permanent "chaos premium." Markets are pricing in the unpredictability of the U.S. administration, where foreign policy is increasingly used as a transactional lever. President Trump’s recent threats regarding Greenland’s status and tariffs on European allies have injected unprecedented volatility into the Atlantic alliance. Simultaneously, U.S. military maneuvers involving Venezuela and escalating tensions with Iran have dismantled the traditional assumption that U.S. assets are the ultimate safe haven. Investors are fleeing this geopolitical instability, utilizing gold not just as insurance, but as a non-sovereign store of value immune to sanctions or diplomatic seizure.
Geostrategy: The Sovereign Pivot
A quiet revolution is occurring in central bank vaults. The global monetary architecture is shifting away from a dollar-centric system, driven by the weaponization of finance. Central banks are aggressively diversifying reserves, with official purchases forecast to reach 950 tonnes in 2026. This is a strategic realignment, not a tactical trade. Nations like China and others in the Global South are systematically replacing U.S. Treasuries with gold to inoculate their economies against potential asset freezes. This "sovereign bid" creates a price floor, effectively removing massive quantities of bullion from the circulating supply and tightening the market structure.
Macroeconomics: The Debasement Trade
The most potent catalyst for $7,000 gold lies in the erosion of fiat currency credibility. The "debasement trade" is accelerating as investors confront the reality of U.S. fiscal sustainability. With national debt exceeding $324 trillion globally and U.S. deficits widening, the Federal Reserve faces immense pressure to monetize debt. Real yields are expected to remain subdued or negative, reducing the opportunity cost of holding non-yielding assets. As the Fed potentially moves toward a more dovish stance to support labor markets, the dollar’s purchasing power declines, mathematically necessitating a higher gold price to value the world’s outstanding liabilities.
Industry Trends & Technology: The Scarcity Engine
Physical constraints are colliding with algorithmic demand. Fibonacci extension models used by technical analysts now identify $7,040 as a major target zone, driven by momentum trading and high-frequency algorithms chasing the breakout. On the supply side, the industry faces a geological plateau. New major discoveries are rare, and ore grades are deteriorating, making extraction more expensive and technically challenging. This scarcity is compounded by a structural deficit in silver, which often leads gold in precious metal bull markets. The combination of finite supply and infinite monetary expansion creates a powerful engine for price appreciation.
Conclusion
The ascent to $7,000 is no longer a fringe theory but a plausible outcome of converging crises. Gold has transitioned from a cyclical commodity to a strategic necessity for preserving capital. As faith in political institutions wavers and the global debt burden swells, the market is actively repricing the world’s oldest form of money.

Macroeconomic Indicator: Gold-Copper SpreadMacroeconomic Indicator: Gold-to-Copper Spread
The Gold-to-Copper Spread (Gold-to-Copper Ratio) is the ratio between the price of gold and the price of copper, expressed by the formula:
Gold–Copper Ratio = Price of Gold / Price of Copper
This indicator shows how much the price of gold exceeds or lags behind the price of copper at a given point in time. It is often used to analyze market sentiment, assess economic stability, and identify investor preferences.
Gold
Gold is traditionally considered a safe-haven asset. Its price generally rises during periods of economic and financial uncertainty, when investors seek to preserve capital and reduce risk.
Additionally, gold may receive support in the following conditions:
weakening of the US dollar
rising inflation expectations
declining real interest rates
increasing geopolitical risks
growing demand from central banks
Copper
Copper is often called “the doctor of the economy” due to its high sensitivity to industrial production and economic growth. The price of copper typically rises during phases of economic expansion, when demand for commodities and risk assets increases.
The spread reflects only the relationship between the two assets and does not account for other factors such as exchange rates, geopolitics, or changes in monetary policy.
Copper may also rise under the following conditions:
supply deficits (strikes, logistical disruptions, declining production)
structural growth in demand (electric vehicles, energy transition, data centers)
monetary stimulus and growth in global liquidity
weakening of the US dollar
speculative phases in commodity markets
stimulus measures from China
Rising Gold/Copper Ratio
Typically signals:
increase in risk-off sentiment
deterioration in economic expectations
growing demand for safe-haven assets
expectations of recession or slowdown
intensification of geopolitical risks
decline in real interest rates
This is usually accompanied by weakness in equity markets, cyclical sectors, and industrial commodities.
Falling Gold/Copper Ratio
Typically indicates:
strengthening of risk-on sentiment
improving expectations for economic growth
growth in industrial activity
capital inflows into risk assets
the beginning or middle of an economic expansion
It often correlates with rising equity indices, industrial metals (in a “healthy” risk-on regime, copper should rise not alone but together with aluminum, nickel, and zinc), oil, industrial ETFs (XLI), equity indices, PMI, macro data, and bond yields.
The Spread Cannot Be Analyzed in Isolation
Key indicators without which this indicator should not be interpreted:
Real rates
DXY (US dollar)
S&P 500, Russell 2000, Industrial ETF (XLI), oil (WTI, Brent), aluminum, zinc, nickel, CRB Index / GSCI
China: real demand or illusion — declining or growing
Geopolitics
All these metrics can be found on TradingView. It is recommended to create a separate watchlist and monitor them there.
The Spread Is Falling
This means copper is stronger than gold. The base hypothesis is that the market is shifting into risk-on mode. We then verify this using other indicators.
1. Real Rates
Real rates are rising - gold is under pressure, the spread falls for a “healthy” reason.
This confirms that the market truly expects economic growth.
Real rates are falling, but the spread is still falling - copper is rising too aggressively.
This is not a macro growth signal, but rather a sign of copper supply deficit or speculative acceleration.
Conclusion:
If the spread falls while real yields are rising, this is a strong, clean risk-on signal.
If it falls while real yields are declining, distortions are already present.
2. DXY (US Dollar)
DXY is falling - supportive for commodities, copper’s strength looks logical.
This confirms a risk-on environment.
DXY is rising, but the spread is still falling - copper is rising despite currency pressure.
This is often a sign of a local copper deficit or an artificial squeeze.
Conclusion:
A falling spread with a weak dollar is a normal macro scenario.
A falling spread with a strong dollar is a reason to be cautious.
3. What Should Happen in Other Markets
If the decline in the spread reflects true risk-on, typically:
S&P 500 is rising
Russell 2000 is rising faster than S&P (increased risk appetite)
Industrial ETF (XLI) is in an uptrend
Oil (WTI, Brent) is strengthening
Aluminum, zinc, and nickel are rising together with copper
CRB / GSCI commodity indices are moving higher
Key point:
Copper should not rise alone. If you see copper rising, equities flat, oil weak, metals not confirming then this is almost always mean that not macro growth, but a local copper story (supply shock, squeeze, speculation).
4. China: Real Demand or Illusion
Copper is almost impossible to interpret without China.
China PMI rising + credit impulse rising + yuan strengthening
copper growth is fundamentally confirmed
a falling spread = healthy risk-on
China PMI falling + weak economy, but copper rising
this is not macro demand
it is either a supply deficit or speculative flows
Conclusion:
If China does not confirm copper’s move, the decline in the spread loses its macro meaning.
The Spread Is Rising
This means gold is stronger than copper. The base hypothesis is that the market is moving into defense (risk-off). But confirmation is still required.
1. Real Rates
Real rates are falling - gold rising is logical.
If equities and commodities weaken at the same time, this is true risk-off.
Real rates are rising, but gold is still rising - the driver is not monetary.
This is usually geopolitics or fear of systemic risks.
Conclusion:
Rising spread with falling real yields = classic macro risk-off.
Rising spread with rising real yields = the market is genuinely afraid.
2. DXY (US Dollar)
DXY is rising - pressure on commodities, support for gold - the rising spread looks logical.
DXY is falling, but the spread is still rising - gold is rising too strongly.
This is most often a sign of fear, geopolitics, or systemic hedging.
Conclusion:
Rising spread with a strong dollar = standard risk-off.
Rising spread with a weak dollar = a warning signal.
3. What Should Happen in Other Markets
If the rise in the spread reflects true risk-off, typically:
S&P 500 weakens or moves into correction
Russell 2000 falls faster than S&P
XLI (industrial sector) is under pressure
Oil weakens
Industrial metals fall
CRB / GSCI move lower
If instead gold is rising, equities are rising, oil is holding, commodities are not falling, then this is not classic risk-off. It means gold is rising for its own reasons (rates, geopolitics, hedging).
4. China (PMI)
Chinese data weakening + copper falling
the rise in the spread is fundamentally confirmed
the market truly expects a slowdown
Chinese data strong, but copper still weak
the issue is not demand, but other markets
the spread signal is distorted
Geopolitics in the Interpretation of the Gold/Copper Ratio and Markets
Geopolitics is a factor that breaks the normal macro logic of markets.
It is not directly linked to the economic cycle, but it sharply changes capital behavior.
If macro indicators reflect “slow” processes (rates, growth, inflation),
then geopolitics represents shock events that trigger fear, defensive positioning, risk aversion, increased demand for liquidity
That is why it is always considered separately from macroeconomics.
How Geopolitics Affects the Gold/Copper Spread
In most cases, geopolitics, strengthens demand for gold, weakly supports copper, therefore pushes the spread higher
But the key point is:
this is not because the economy is deteriorating,
but because investors are hedging against event risk.
That is why a geopolitically driven rise in the spread often is not confirmed by falling equities, is not accompanied by worsening PMI, does not coincide with changes in interest rates
Enjoy!
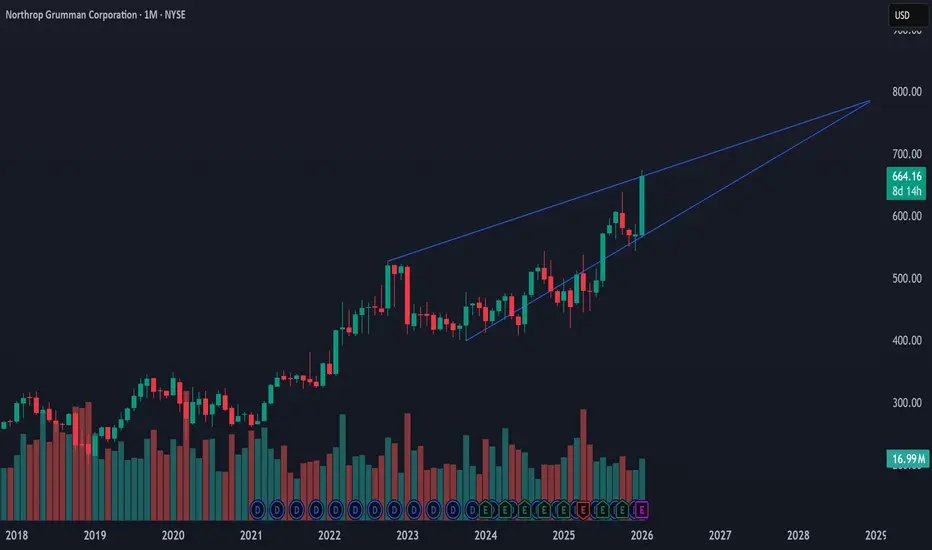
Northrop Grumman: Architecting the Future of AI Warfare
Northrop Grumman (NOC) is redefining the defense sector by fusing lethal hardware with digital intelligence. While the delivery of the 1,500th F-35 center fuselage cements its manufacturing legacy, the company’s valuation thesis is shifting. Investors must now analyze Northrop as a master architect of space militarization, autonomous systems, and AI-driven command structures.
Geopolitics and Geostrategy
Global conflicts now demand seamless integration across land, sea, air, and space. Northrop’s Integrated Battle Command System (IBCS) serves as the central nervous system for this new reality. It connects disparate sensors and shooters, creating a unified shield against hypersonic threats. As the space militarization market expands, nations require robust ground systems to command orbital assets. Northrop dominates this geostrategic niche, securing critical infrastructure that nations cannot afford to lose.
Technology and Innovation
The company’s "BattleOne" initiative represents a quantum leap in military logic. This digital ecosystem accelerates decision-making by fusing data from satellites and terrestrial sensors. It utilizes advanced artificial intelligence to predict enemy movements and optimize response times. Northrop is not merely selling weapons; it is selling decision dominance. This move toward software-defined warfare creates a high competitive moat against legacy hardware manufacturers.
Industry Trends: The Rise of Autonomous Mass
The U.S. Air Force currently prioritizes "Collaborative Combat Aircraft" (CCA) to fly alongside manned fighters. Northrop is aggressively targeting this sector with platforms like the "Lumberjack." This one-way attack drone delivers kinetic capabilities at an affordable price point. Furthermore, their ANCILLARY vertical take-off drone eliminates the need for traditional runways. These innovations align perfectly with the industry trend toward "affordable mass" and distributed lethality.
Electronic Warfare and Cyber Security
Nations fight modern warfare in the electromagnetic spectrum. Northrop’s electronic warfare (EW) solutions actively jam enemy communications while shielding friendly networks. These systems integrate cyber resilience directly into the hardware architecture. As adversaries develop sophisticated jamming techniques, Northrop’s multispectral capabilities become non-negotiable for the Pentagon. This ensures recurring revenue streams for constant software and hardware upgrades.
Business Models and Economics
Management is adapting its business model to match tightening fiscal environments. The shift toward platforms like Lumberjack signals a pivot from low-volume, high-cost units to high-volume, lower-cost attrition assets. This diversification protects the balance sheet against potential budget cuts to expensive flagship programs. By balancing the massive F-35 supply chain with agile drone production, the company optimizes its revenue mix.
Management and Leadership
Executive leadership demonstrates strategic agility by embracing digital engineering. They are successfully navigating the transition from a hardware-first mindset to an AI-centric strategy. Their ability to deliver on legacy contracts while funding speculative high-tech ventures instills confidence. Leadership is effectively positioning the firm to capture the lion's share of the Joint All-Domain Command and Control (JADC2) budget.
Conclusion
Northrop Grumman has evolved beyond the definition of a traditional defense contractor. It stands as a technology powerhouse integrating space, AI, and autonomous systems. The company effectively monetizes the complexity of modern warfare. For investors, NOC represents a strategic play on the convergence of silicon and steel in the 21st century.
USD/IDR Surge: Rupiah Crumbles on Fiscal PanicThe Indonesian Rupiah is in freefall. USD/IDR has breached critical resistance levels as fiscal anxiety grips Jakarta. A failed bond auction and foreign capital exodus have created a perfect storm for the currency. Traders must now navigate a landscape defined by populist spending risks and global contagion.
Macroeconomics and Economics
The latest debt auction exposes deep systemic cracks. Indonesia sold 36 trillion rupiah ($2.1 billion) of debt, yet demand evaporated. The bid-to-target ratio collapsed to 2.51, the weakest since March. Investors are rejecting Indonesian paper. They demand higher premiums to hold assets denominated in a depreciating currency. This waning appetite forces yields higher, further straining the government's balance sheet. The market is effectively pricing in a deterioration of Indonesia's sovereign credit profile.
Geopolitics and Geostrategy
Jakarta is suffering from global collateral damage. A selloff in Japanese notes, triggered by Prime Minister Sanae Takaichi’s aggressive tax plans, sparked a worldwide debt rout. This contagion hit Southeast Asia hard. Indonesia, often viewed as a high-beta proxy for emerging market risk, took the brunt of the hit. Geostrategically, foreign capital is fleeing back to the safety of the US Dollar. The USD/IDR pair is rising not just on Rupiah weakness, but on a strategic flight to safety.
Management and Leadership
Investor confidence in Indonesia's economic stewardship is eroding. Markets are reacting negatively to reports of "populist spending." Traders fear these fiscal expansions will blow out the budget deficit. Furthermore, concerns regarding the independence of the central bank add a risk premium to the currency. Effective leadership demands fiscal discipline, yet the current trajectory suggests the opposite. Without credible austerity signaling, the central bank lacks the credibility to defend the Rupiah effectively.
Business Models and Industry Trends
The business model of "carry trade" is dead for the Rupiah. Foreign investors submitted bids for only 3.9 trillion rupiah, a fraction of last year's 15.6 trillion average. Handy Yunianto of PT Mandiri Sekuritas notes that yield spreads are no longer attractive. The risk-reward ratio has flipped. Global asset managers are liquidating positions in Indonesian fixed income to cover losses elsewhere or to chase higher risk-free rates in the US.
Technology and High-Tech
Modern capital flight occurs at the speed of light. High-frequency algorithmic trading exacerbates these selloffs. Unlike in 1998, digital financial infrastructure allows foreign investors to exit positions instantly. This technological efficiency accelerates volatility in USD/IDR. There are no buffers. When sentiment turns, the digital exit doors are wide open, and capital flows out unchecked.
Conclusion
The USD/IDR pair is unmoored. Fiscal deterioration, combined with a loss of foreign confidence, paints a bearish picture for the Rupiah. Unless the government restores fiscal credibility or global yields stabilize, the path of least resistance for USD/IDR is higher.

$XAU/USD - Gold's Q1 2026TVC:GOLD remains considerably Bullish until proven otherwise !
- Not only fundamentally speaking by Central Banks heavily accumulating it diversifying away from U.S Treasuries and a Weakening TVC:DXY Dollar ;
to plenty current Geo-Political Risks with unknown and uncertain future scenarios,
to worries of 'Sticky' Inflation and Interest Rates cuts.
This is an Structural Official World-Wide Demand !
Any Pullback seen on charts, will be just another excellent providing support floor to accumulate Gold while cheaper.
Leaving behind 2025 as one of its best performing years throughout history with an amazing rally ;
and entering 2026 on a strong note paired with other precious metals like TVC:SILVER
- TA speaking,
HH's and HL's continue printing, however, concerning for the time being is a bearish wedge pattern forming ,
flirting with the ceiling of 2025 Uprising Channel .
Bearish Wedge not yet confirmed having its measured move putting Gold's TA forecast to as low as 4.380$.
Other strong supports are there to be found as tests before 4.380$ is reached.
Conflicting Supports from PoC of last rally and EMA 50 aiming up and as well the prior week's Gap Break-Out which as not Filled yet.
Note that for the time being, Gold has found support on Previous ATH Level + 20EMA, leaving a Liquidity Wick Zone just below, increasing the probabilities of break-out gap being filled.
Aiming another Higher High creating a New All Time High;
its first test of resistance is the last ATH which can print a Double Top and down it goes to break the bearish wedge pattern confluencing with major news events of United States on 22 of January ;
Breaking ATH and above Uptrend Channel marked on white and Confirming it will Invalidate the Bearish Wedge Pattern.
Probabilities scream for a pullback, however is worth including the Gold's fundamental momentum and anything is to be expected.
NOTE THAT THIS IS NOT FINANCIAL ADVICE .
PLEASE DO YOUR OWN RESEARCH BEFORE PARTAKING ON ANY TRADING ACTIVITIES BASED SOLY ON THIS IDEA

EUR/USD: The Greenland Gambit & Tariff ShockHedge Funds Retreat as Trump Weaponizes Trade Policy for Arctic Control
The Euro has entered a volatile corridor, driven by a sharp reversal in institutional positioning. Hedge funds and leveraged speculators have aggressively exited bullish Euro bets, flipping to net short positions for the first time since November. This pivot directly correlates with President Donald Trump’s ultimatum: impose punitive tariffs on European nations unless they facilitate the U.S. acquisition of Greenland.
Geopolitics & Geostrategy: The Arctic Pivot
The currency fluctuation is no longer just a monetary phenomenon; it is a geostrategic signal. Washington views Greenland not merely as territory, but as a critical security asset. Control over the island secures the GIUK Gap (Greenland-Iceland-UK), a naval choke point vital for monitoring Russian submarine activity in the North Atlantic.
Trump’s willingness to leverage transatlantic trade relationships highlights a shift in U.S. doctrine. The administration is prioritizing territorial expansion and resource security over traditional alliance stability. Investors are pricing in a scenario where the Euro becomes the primary casualty of this diplomatic coercion.
Science & High-Tech: The Rare Earth Race
Behind the political theater lies a cold scientific reality. Greenland holds some of the world’s largest undeveloped deposits of Rare Earth Elements (REEs) . These materials, neodymium, praseodymium, and dysprosium, are non-negotiable components for high-tech manufacturing, including F-35 fighter jets, electric vehicles, and quantum computing hardware.
The battle for Greenland is a proxy war for technological supremacy. China currently dominates the REE supply chain. By forcing the Greenland issue, the U.S. aims to break this monopoly. The Euro’s depreciation reflects the market’s realization that Europe holds the losing hand: it risks losing either its trade access to the U.S. or its sovereignty over strategic Arctic resources.
Macroeconomics: Growth Under Siege
The economic implications for the Eurozone are severe. Tariffs act as a direct tax on European growth, which is already fragile. Analysts warn that traders are underpricing the risk of a "rupture" in major currency pairs. A full-scale trade war would dismantle the nascent recovery in European manufacturing, specifically in the German automotive sector, which relies heavily on U.S. exports.
Strategists predict EUR/USD could test support at 1.1499 . This technical level represents a psychological floor; a breach here would invite algorithmic selling, accelerating the currency’s decline.
Market Dynamics: The Algorithmic Shift
Data from the Commodity Futures Trading Commission (CFTC) confirms a decisive sentiment shift. The flip to net short positioning indicates that smart money is front-running the potential escalation. Algorithms, programmed to react to "trade war" syntax in news wires, are driving intraday volatility. The Euro’s swing between losses and gains underscores a market struggling to price in a binary geopolitical outcome: a diplomatic deal or a trade conflict.
Conclusion
The EUR/USD pair is now a barometer for the breakdown of the post-WWII order. The drivers of this fluctuation extend far beyond interest rate differentials. They encompass Arctic security, the control of future-tech resources, and the weaponization of economic policy. Until the Greenland standoff resolves, volatility will remain the only certainty.

Kratos Defense: Hypersonic Ambitions Meet Valuation RealityThe battlefield is changing, and Kratos Defense (NASDAQ: KTOS) is engineering the shift.
As warfare accelerates toward Mach 5, Kratos has positioned itself as the indispensable engine of high-velocity conflict. Yet, for investors, the stock presents a paradox: a company deeply embedded in critical national security programs trading at a premium that demands perfection. This analysis dissects whether the current price reflects a sustainable trajectory or a speculative peak.
Geostrategy: Closing the Kinetic Gap
The strategic landscape for 2026 is defined by the "speed gap" between the West and its adversaries. China and Russia have aggressively fielded hypersonic capabilities, forcing the Pentagon to prioritize speed over stealth. Kratos is no longer just a contractor; it is a geopolitical asset. The company’s recent operational expansion into Maryland directly supports the Department of Defense's urgent need to test and deploy hypersonic systems. By aligning its output with the MACH-TB 2.0 program, Kratos secures its role in the primary theater of future deterrence.
Technological Edge: The Science of Attrition
Kratos differentiates itself through the "attritable" doctrine. Unlike legacy primes building billion-dollar platforms, Kratos engineers high-performance systems designed to be cost-effective enough to lose in combat.
* High-Mach Engineering: The new 55,000-square-foot facility in Princess Anne represents a leap in manufacturing science, moving hypersonic testing from boutique experiments to mass production.
* Unmanned Autonomy: Their drone portfolio, led by the Valkyrie, leverages AI to act as force multipliers for manned fighters. This moves the patent battleground from hardware design to software-defined autonomous teaming.
Market Mechanics & Macroeconomics
The financial metrics for KTOS reveal a story of aggressive optimism.
* Valuation Vertigo: With a P/E ratio exceeding 1,000x , the market is pricing Kratos not on current earnings ($0.14 EPS last quarter) but on a future dominance that hasn't fully materialized.
* The Growth Engine: Revenue jumped 26% year-over-year to nearly $348 million . This growth outpaces the broader defense sector, justifying some premium.
* Balance Sheet Health: A debt-to-equity ratio of just 0.04 provides resilience. In a macroeconomic climate where capital costs remain elevated, Kratos has the liquidity to fund R&D without leveraging its future.
Leadership & Insider Sentiment
While the order book swells, the boardroom is selling. A pattern of executive divestment has emerged at these all-time highs.
* The Exodus: Over the last quarter, insiders liquidated roughly $74 million in stock. Notable sales include Director William Hoglund unloading over $5.5 million and significant trims by other key executives.
* Interpretation: While insider selling can stem from personal liquidity needs, the synchronized nature of these sales near peak valuation ($130 range) sends a cautionary signal. Leadership is monetizing success now rather than waiting for the next leg up.
Wall Street Consensus vs. Reality
The analyst community remains bullish but divided on the ceiling.
* The Bull Case: Firms like Stifel and B. Riley sees the stock climbing to $134-$128 , driven by the sheer volume of defense spending entering the pipeline.
* The Bear Case: The gap between the average target (~$88) and the current trading price suggests the stock may have overrun its fundamentals.
* Verdict: The "Moderate Buy" consensus acknowledges the quality of the business while subtly flagging the risk of an overheated share price.
Investment Outlook: A Strategic Hold
Kratos Defense is a rare pure-play on the future of kinetic warfare. Its entrenched position in hypersonics and space communication creates a wide competitive moat. However, the disconnect between an astronomical valuation and heavy insider selling cannot be ignored.
Bottom Line: The technology is revolutionary, but the stock is priced for perfection. Smart capital may wait for a pullback before engaging, as the current entry point offers little margin of safety despite the massive geopolitical tailwinds.

EUR/USD Daily Chart Analysis For Week of Jan 16, 2026Technical Analysis and Outlook:
The Euro trading session over the past week has exhibited a notable decline, breaking the Mean Support level at 1.162. This movement indicates a climactic trajectory toward the Interim Inner Currency Dip at 1.155, with the current Mean Support at 1.159 as the vital support level.
Current market conditions, however, imply a moderate rebound, with a target established at the Mean Resistance level of 1.164. Upon achieving this target, the market is expected to resume its downward trend and progress toward the main objective: Interim Inner Currency Dip 1.155.

XAUUSD - Time for correction or new move?Hello TradingView Community!
Gold is currently trading well above the 1.272 Fibonacci extension of the recent major impulse leg — a level that has often served as a strong exhaustion point after sharp upside moves.
Combined with repeated failures to push meaningfully higher over the past several days (price keeps testing resistance without a decisive close above), this setup could signal a potential short-term reversal and the beginning of a correction back toward the broader trend.
Key levels we're watching if the pullback develops:
• First magnet / POI: Daily Fair Value Gap (FVG) around 4,550
• Deeper target & stronger support: 4H Point of Control (POC) near 4,481
These zones represent classic areas of imbalance where price frequently returns to rebalance after overextensions.
We'll need bearish confirmation (rejection candles at the highs, downside volume increase, or break of recent structure) to confirm the move lower. Until then, the bias remains cautious on new longs while monitoring for short opportunities on weakness.
Globally gold still screams long-term bullish (geopolitics + CB demand ain’t going anywhere), but yeah — a clean dip to 4550 FVG and especially 4481 POC would be the healthiest thing right now. Shakeout weak hands, reset RSI, better structure for the next leg up.
What do you think — signs of exhaustion building, or still room for one more push? Share your views below! 🚀
#Gold #XAUUSD #TradingView #SmartMoney

USD/PLN Pivot: NBP Pause Meets Tech ResilienceThe Polish Zloty stands at a pivotal moment as the National Bank of Poland (NBP) prepares to halt its easing cycle.
While the market widely anticipates a hold at 4.0%, the underlying economic currents, ranging from geopolitical fortification to high-tech patent growth, suggest a complex future for the USD/PLN exchange pair. Traders must look beyond the headline rate decision to understand the structural forces supporting the Zloty.
Macroeconomics: The End of the Cut Cycle
The Monetary Policy Council (MPC) is poised to pause its interest rate cuts. After lowering borrowing costs by 175 basis points last year, Governor Adam Glapinski is signaling a "wait-and-see" approach. A Bloomberg survey confirms this consensus, with 29 of 32 economists expecting a hold. This hawkish pivot supports the Zloty by maintaining a yield advantage over the Dollar, provided the Federal Reserve continues its own easing trajectory. However, the recent drop in inflation below the 2.5% target creates a tail risk. A surprise cut would instantly depreciate the PLN, sending the pair higher.
Geostrategy: The "East Shield" Premium
Geopolitics plays a massive role in the valuation of the PLN. Poland’s "East Shield" initiative, a multi-billion zloty defense infrastructure project, is redefining the country's risk profile. By actively fortifying the eastern flank and investing nearly 5% of GDP in defense, Warsaw is assuring foreign direct investors of long-term stability. This geostrategic assertiveness reduces the "war risk premium" that previously weighed on the currency. Capital flows are returning, viewing Poland not just as a buffer state, but as a secured NATO stronghold.
High-Tech & Industry Trends: Beyond Outsourcing
Poland is rapidly transitioning from a service outsourcing hub to a primary innovator. The IT sector now drives significant export revenue, creating a natural demand for the Zloty. We are seeing a surge in high-value exports in AI and automation, which are less sensitive to currency fluctuations than traditional manufacturing. This structural shift provides a floor for the currency. Even if rates drop, the robust trade balance driven by the technology sector supports the PLN against the USD.
Patent Analysis & Innovation
A look at intellectual property trends confirms this economic maturation. Patent filings from Polish firms in fintech and cybersecurity have risen sharply. This "intellectual sovereignty" implies that future economic growth will be driven by proprietary technology rather than low-cost labor. For currency traders, this signifies long-term strength. An economy built on high-tech IP attracts stickier long-term capital compared to fleeting speculative flows.
Leadership & Governance: The Wildcard
The MPC’s internal dynamics introduce short-term volatility. The appointment of Marcin Zarzecki by President Nawrocki changes the voting calculus. Zarzecki is an unknown quantity, replacing the predictable Cezary Kochalski. His vote could tip the scales in a divided council where members like Ireneusz Dabrowski still argue for cuts. Traders hate uncertainty. Until Zarzecki’s stance becomes clear, the USD/PLN may experience heightened volatility around meeting dates.
Conclusion
The USD/PLN is caught between a hawkish central bank and a disinflationary economy. However, the broader view is bullish for the Zloty. Poland’s geostrategic hardening, combined with a pivot to high-tech innovation, creates a strong fundamental backdrop. Unless the NBP shocks the market with a cut, the path of least resistance for USD/PLN appears to be sideways to lower.

Gold Demand Zone Reaction🔍 Quick Summary
Gold is reacting from a well-defined demand zone after a sharp sell-off, and I’m seeing early signs of a structure shift on the lower timeframe. If this base holds, I expect price to push higher toward the next liquidity zone and reclaim prior intraday highs ⚡️.
📊 Deep Analysis
On the 15-minute chart, price has swept sell-side liquidity and tapped into a clean demand zone that previously caused an impulsive move up. This area aligns with a rising diagonal support, giving strong confluence for a bounce.
I’m also seeing a CHOCH form after the sell-side sweep, suggesting bearish momentum is weakening. The impulsive push off the lows followed by a shallow pullback tells me buyers are absorbing supply rather than chasing price. The previous EQH above price remains a liquidity magnet, and the path of least resistance now looks higher as long as demand holds.
Volume expanded on the sell-off but is now contracting, which usually precedes a reversal or continuation move higher. If price can reclaim the intraday structure level, momentum should accelerate.
📰 News Supporting My Bias
Gold remains fundamentally supported by:
Ongoing geopolitical tensions, which continue to increase safe-haven demand.
Expectations of future rate cuts later in the year, weakening the USD and benefiting gold.
Strong central bank gold buying, particularly from emerging markets, which underpins longer-term demand.
This macro backdrop supports the bullish reaction I’m seeing technically.
🎯 Trade Idea Scenario
Bullish Scenario
Entry: Within the current demand zone (reaction already in play).
Confirmation: Hold above demand + bullish close reclaiming structure.
TP1: Prior EQH / intraday resistance.
TP2: Next liquidity zone above (highlighted green area).
SL / Invalidation: Clean break and close below the demand zone and diagonal support.
Bearish Scenario
If price fails to hold demand and closes below it, I expect continuation lower toward the next major support below the Asian low. In that case, I step aside and reassess.
📌 What I’m Watching Next
I’m watching how price behaves on the next pullback into demand. Strong rejection wicks or impulsive bullish candles would confirm continuation. Weak reaction or acceptance below demand invalidates the setup.
⚠️ Disclaimer
This is my personal analysis and not financial advice. Always do your own research and manage risk carefully 📉📚.

Can Gold's Transformation Justify a $7,000 Price Target?The global gold market is experiencing a fundamental paradigm shift as the metal transitions from a passive portfolio hedge to a strategic necessity across multiple domains. With U.S. national debt exceeding $38 trillion and a debt-to-GDP ratio above 124%, the report argues that sovereign debt debasement has become mathematically inevitable, forcing central banks into implicit yield curve control and perpetual currency dilution. Simultaneously, geopolitical fractures exemplified by the January 2026 capture of Venezuelan President Maduro and escalating Arctic tensions over Greenland are driving nations to diversify away from their reliance on weaponized dollar reserves. The BRICS alliance's launch of a 40% gold-backed "Unit" currency in October 2025, combined with record central bank purchases of 220 tonnes in Q3 2025 alone, signals a coordinated global effort to remonetize gold as the ultimate neutral reserve asset.
Beyond monetary dynamics, gold is becoming indispensable to the technological infrastructure of the future. The AI revolution creates inelastic industrial demand, with gold-tin solder and gold wire bonding proving essential for thermal management in high-performance chips, such as NVIDIA's B200 GPU and High-Bandwidth Memory (HBM3E) systems. This "AI tax" on gold supply permanently removes metal from circulation as it becomes embedded in data centers and semiconductor packages. Basel III regulatory reforms have further catalyzed demand by elevating allocated physical gold to Tier 1 asset status, incentivizing banks to swap paper assets for physical metal, and exposing the leverage in the paper gold market. Additionally, emerging applications in quantum computing, nanomedicine, and space infrastructure, including China's planned deployment of 200,000+ satellites for 6G networks, create entirely new sources of consumption.
The convergence of these structural forces creates what the report calls a "supply squeeze" amid declining ore grades, rising production costs, and potential export restrictions by major producers. With global debt approaching $346 trillion and cyber warfare risks underscoring gold's unique status as an "analog hedge" immune to digital manipulation, the report projects $7,000 per ounce not as speculation but as a rational repricing of a strategic asset facing unprecedented convergent demand. The thesis holds that gold has evolved from a "nice-to-have" portfolio diversifier into a "must-have" strategic material for central banks seeking neutrality, technology companies requiring conductivity, and investors needing protection against systemic collapse. The authors conclude that supply constraints can be resolved only through price adjustment, making the path to $7,000 "paved with necessity."

EUR/USD Daily Chart Analysis For Week of Jan 9, 2026Technical Analysis and Outlook:
In this week's trading session, the Euro market demonstrated substantial downward movement, followed by the elimination of the Mean Support levels at 1.171 and 1.168, thereby completing the Interim Inner Retracement at Mean Support 1.162, with the possibility of extending this down movement to Mean Support 1.159. However, present market conditions suggest an intermediate rebound is anticipated, targeting the Mean Resistance level at 1.168.

$DXY - Ballads of Dollar (2026)TVC:DXY -Ballads of the Dollar (2026)
TVC:DXY 2026 Outlook
Q1-Q2-Q3-Q4
| Quarter | Expected DXY Trend | Main Drivers |
| ----------| ---------------------------- | ------------------------------------- |
| Q1 | Mild weakness / consolidation | Fed cut expectations, risk flows |
| Q2 | Potential trough & volatility | Yield compression, global optimism |
| Q3 | Stabilization / rebound signals | US economic data surprises |
| Q4 | Mixed; range reset | Geopolitics, positioning, seasonality |
📉 Key Fundamental Drivers for TVC:DXY 2026
🔹 Monetary Policy Divergence
Expected Fed cuts compress yield differentials with ECB, BoE, BoJ, etc., reducing carry benefits for USD.
🔹 Interest Rate & Inflation Trends
Ongoing sticky inflation and resilient labor metrics could delay some cuts, supporting the dollar intermittently.
🔹 Global Growth & Capital Flows
Balanced growth worldwide reduces “safe-haven” dollar flows; global portfolio diversification may cut dollar dominance.
🔹 Reserve Currency Dynamics
Changes in global FX reserve weighting (e.g., China lowering USD share) reflect gradual diversification — a structural headwind.
🔹 Fiscal Policy and U.S. Deficits
High deficits and political disputes over debt and spending may weigh on confidence over time, even if they don’t trigger major sell-offs.
📌 Geo-Political Risk Factors Influencing TVC:DXY
🔹 U.S.–China relations: trade, tech competition, and financial linkage tensions encourage FX diversification outside USD.
🔹 Middle East & Ukraine: ongoing conflicts support cyclical USD strength during spikes in risk aversion.

CVX: The Perfect Storm (Macro Catalyst + Massive Channel)The news cycle is obsessed with the politics of the US & Venezuela, but the smart money is focused on the supply chain.
I created this chart to visualize how a massive fundamental catalyst (The Flags) is colliding with a decade-long technical structure (The Channel).
1. The Fundamental Catalyst (The Flags 🇺🇸🇻🇪) While the headlines are about "deals," the reality for the energy sector is about Market Access. Chevron ( NYSE:CVX ) is the primary US major with the "keys to the kingdom"—active OFAC licenses and operational Joint Ventures on the ground.
The Moat: While competitors are years away from navigating new contracts, CVX has a "Turnkey" advantage. The infrastructure is there. The pipes are connected.
The Shift: This opens the door to immediate heavy crude reserves for US Gulf Coast refineries, a massive tailwind for margins.
2. The Technical Structure (The Blue Channel)
📉 Politics is noise; Price is truth. Look at the geometry in the chart:
The Channel: Price has respected this massive Blue Ascending Channel for years. It defines the institutional trend.
The Coil: We have been compressing in a tight Triangle Consolidation (white lines) right at the breakout point.
The Target (TP Circle) : If we break out of this triangle, the standard technical measured move targets the upper rail of the channel. This aligns with the "TP" zone marked on the chart, projecting a move toward "Blue Sky" territory.
3. The Verdict Rarely do you see a "Perfect Storm" where a Macro Event (Venezuela reopening) aligns this cleanly with a Technical Setup (Triangle Breakout). The structure suggests the market is pricing in a "Supercycle" return for American energy access.
👇 The "Venezuela Reconstruction" Watchlist:
If the Venezuela thesis plays out, it's not just Chevron that moves. Here is the basket of related Energy, Services, and Refining stocks I am tracking for this cycle:
Majors: NYSE:CVX , NYSE:COP
Services (Boots on the Ground): NYSE:SLB , NSE:HAL , AMEX:OIH
Refiners (Heavy Crude Beneficiaries): NYSE:VLO , NYSE:MPC , NYSE:PSX , NYSE:DINO , NYSE:PBF
Sector ETF: AMEX:XLE
Which of these is your top pick for the reconstruction trade? Let me know in the comments!
Disclaimer: This analysis is for educational purposes regarding market reaction to geopolitical events. It is based on technical chart geometry and public news. Not investment advice.

Gold Safe-Haven Bid, Bullish OTE Hold with Upside Move📝 Description
Gold on H4 is holding a bullish HTF structure as rising geopolitical risk keeps it in a classic safe-haven bid. Price is currently consolidating around 4,331, trading inside the H4 OTE zone (0.618–0.786) after the recent pullback from highs. Demand has remained intact on dips, signaling accumulation rather than distribution.
________________________________________
📈 Analysis (Scenario-Based | Non-Signal)
Primary Bias: Bullish, while key lows hold
Liquidity & Pullback Context:
• Short-term chop and liquidity collection likely around 4,305
• Downside inefficiency sits at H4 FVG around 4,250, acting as the main downside magnet if liquidity is required
Continuation Path:
• Holding above OTE favors a rotation back toward H4 FVG 4,440–4,480
• With sustained risk-off flows, price can retest prior highs near 4,550 (BSL)
Risk-Relief Case:
• Any de-escalation may trigger a temporary correction, not a trend flip
• Structural damage only if acceptance occurs below 4,240
________________________________________
🎯 ICT & SMC Notes
• Pullbacks classified as buy-the-dip within HTF bullish context
• OTE (0.618–0.786) holding supports continuation
• H4 FVGs define magnets both above and below
________________________________________
🧩 Summary
Gold remains structurally bullish amid elevated geopolitical risk. Expect short-term volatility and liquidity runs, but as long as ~4,240 holds, dips are corrective. Continuation favors 4,440–4,480, with a potential retest of 4,550 if tensions persist.
________________________________________
⚠️ Risk Disclosure
Trading involves substantial risk and may result in capital loss. This analysis is for educational purposes only and does not constitute financial advice. Always apply proper risk management, predefined stop-loss levels, and disciplined position sizing aligned with your trading plan.

USOIL - Symmetrical Triangle at $57 Executive Summary
TVC:USOIL (WTI Crude) is trading at $57.23 on December 26, 2025, down nearly 2% as markets react to progress in Ukraine peace talks that could eventually allow more Russian oil to return to global markets. Price is trapped in a symmetrical triangle pattern on the 4H timeframe, compressing between $55 support and $60 resistance. Despite geopolitical support from the US Venezuela blockade and Ukrainian strikes on Russian refineries, WTI is heading for its steepest annual drop since 2020 (-18% YTD) as oversupply concerns dominate.
BIAS: NEUTRAL - Waiting for Triangle Breakout
The symmetrical triangle is a neutral pattern that can break either direction. Geopolitical risks favor bulls, but oversupply fundamentals favor bears. Let the breakout determine direction.
Current Market Context - December 26, 2025
Oil is at a critical juncture:
Current Price: $57.23 (-1.99% on the day)
Day's Range: $57.14 - $58.88
Weekly Performance: +3% (best week since October)
YTD Performance: -18% (steepest annual drop since 2020)
Brent Crude: ~$61.51
Key Technical Levels:
Resistance: $58.60 / $59.07 / $60.48
Support: $57.80 / $55.50 / $54.98
Triangle apex approaching - breakout imminent
THE BULL CASE - Geopolitical Risk Premium
1. Venezuela Blockade Intensifying
President Trump has ordered a "total and complete blockade of all sanctioned oil tankers" going into and leaving Venezuela:
US Coast Guard boarded the Centuries tanker in the Caribbean
US forces pursuing tanker Bella 1 heading to Venezuela
Coast Guard assembling more manpower and weapons to forcibly board vessels
Venezuelan exports down to less than 400,000 bpd (half of last year)
While global impact is minimal, it's keeping a "bullish tilt to prices"
2. Ukraine-Russia Energy Infrastructure Attacks
Ukraine struck Novoshakhtinsk oil refinery (key diesel/jet fuel supplier)
Ukrainian drones hit Russian shadow oil tanker in Mediterranean Sea
At least 28 Russian refineries targeted in past three months
Six tankers attacked by drones/missiles in Baltic Sea since November
New US and EU sanctions curbing Russian oil exports
Limiting Russia's crude export capabilities
3. US Oil Rig Count at Multi-Year Lows
Active US oil rigs fell to 4.25-year low of 406 rigs (Dec 19)
Slight recovery to 409 rigs this week (+3)
Down sharply from 627 rigs in December 2022
Lower rig count = slower future production growth
4. Inventory Data Supportive
US crude inventories: -4.0% below 5-year seasonal average
Gasoline inventories: -0.4% below 5-year average
Distillate inventories: -5.7% below 5-year average
Crude stored on tankers fell -7% week-over-week
5. OPEC+ Production Pause
OPEC+ pausing production increases in Q1 2026
Still has 1.2 million bpd of cuts left to restore
November OPEC production fell -10,000 bpd to 29.09 million bpd
Trying to manage emerging surplus
THE BEAR CASE - Oversupply Dominates
1. Record Global Oil Surplus Expected
IEA forecasts record 4.0 million bpd surplus for 2026
OPEC revised Q3 estimates from deficit to 500,000 bpd surplus
US production exceeded expectations
Most major traders expect global surplus next year
WTI heading for steepest annual drop since 2020 (-18%)
2. Ukraine Peace Talk Progress
Zelenskiy expects to meet Trump to discuss ending war
Kremlin reviewing peace proposals
Maintaining contacts with US officials
Peace could allow more Russian oil to return to markets
This news triggered today's -2% drop
3. Rising US Production
US crude production at 13.843 million bpd
Just below record high of 13.862 million bpd
EIA raised 2025 estimate to 13.59 million bpd
Production outside OPEC+ also rising
4. Seasonal Weakness
2025 significantly underperforming 2024 and 2023 seasonally
Thin holiday trading amplifying moves
Year-end positioning adding volatility
Expert Analysis
Dennis Kissler (BOK Financial):
"While the backup of the blockade and sanctions is not decreasing world supplies, the fact that it may be delaying them is keeping a bullish tilt to prices."
"Venezuelan oil exports have been less than 400,000 barrels a day the past couple of months, which is half what they were exporting last year. While the U.S. blockade has turned the pressure up on Venezuela, the global impact to crude prices looks minimal at this time."
Ritterbusch and Associates:
"We feel that excessive optimism regarding a quick peace agreement between Ukraine and Russia has been quelled for now."
"Crude fundamentals continue to provide a significant offset against the geopolitical factor."
Technical Structure Analysis
Price Action Overview - 4 Hour Timeframe
The chart shows a clear symmetrical triangle pattern:
Symmetrical Triangle Characteristics:
Upper trendline: Connecting lower highs (descending resistance)
Lower trendline: Connecting higher lows (ascending support)
Converging trendlines creating compression
Price oscillating between boundaries
Triangle apex approaching - breakout imminent
Neutral pattern - can break either direction
Key Zones Identified:
Upper resistance zone: $60-$61 (purple shaded)
Lower support zone: $55-$55.50 (purple shaded)
Major resistance line: $60.48 (red horizontal)
Major support line: $54.98 (red horizontal)
Current price: $57.23 (mid-triangle)
Pattern Implications:
Symmetrical triangles typically break in direction of prior trend
Prior trend was bearish (down from highs)
However, geopolitical factors could override technicals
Volume typically decreases during triangle formation
Breakout should come with volume confirmation
Measured move target = triangle height from breakout point
Key Support and Resistance Levels
Resistance Levels:
$57.80 - Immediate resistance (analyst target)
$58.60 - Secondary resistance
$59.07 - Triangle upper boundary area
$60.00 - Psychological resistance
$60.48 - MAJOR RESISTANCE (red line on chart)
$62.00 - Extended resistance
Support Levels:
$57.14 - Day's low / immediate support
$56.50 - Secondary support
$55.50 - Triangle lower boundary area
$55.00 - Psychological support
$54.98 - MAJOR SUPPORT (red line on chart)
$53.00-$54.00 - Extended support
Triangle Breakout Targets
If Bullish Breakout (above $59-$60):
Triangle height: ~$5-6
Target 1: $62-$63
Target 2: $65-$66
Would require geopolitical escalation or supply disruption
If Bearish Breakdown (below $55):
Triangle height: ~$5-6
Target 1: $52-$53
Target 2: $50-$51
Would confirm oversupply narrative
SCENARIO ANALYSIS
BULLISH SCENARIO - Breakout Above $59-$60
Trigger Conditions:
4H close above $59.07 (triangle resistance)
Volume spike on breakout
Venezuela situation escalates
Ukraine-Russia peace talks collapse
Major supply disruption
Price Targets if Bullish:
Target 1: $60.48 - Major resistance
Target 2: $62.00-$63.00 - Measured move
Target 3: $65.00-$66.00 - Extended target
Bullish Catalysts:
Venezuela blockade intensifying
Ukrainian strikes on Russian refineries
US oil rigs at 4.25-year lows
Inventories below seasonal averages
OPEC+ production pause in Q1 2026
Geopolitical risk premium
BEARISH SCENARIO - Breakdown Below $55
Trigger Conditions:
4H close below $55.00 (triangle support)
Volume confirmation on breakdown
Ukraine peace deal announced
OPEC+ increases production
US production hits new record
Price Targets if Bearish:
Target 1: $54.98 - Major support
Target 2: $52.00-$53.00 - Measured move
Target 3: $50.00-$51.00 - Extended target
Bearish Risks:
IEA forecasts record 4.0 million bpd surplus for 2026
Ukraine peace talks progressing
US production near record highs
YTD: -18% (steepest drop since 2020)
Oversupply narrative dominant
Seasonal weakness
NEUTRAL SCENARIO - Continued Triangle Consolidation
Most likely short-term outcome:
Price continues oscillating within triangle
Range: $55.50 - $59.00
Thin holiday trading
Wait for breakout confirmation
Watch geopolitical headlines
MY ASSESSMENT - NEUTRAL with Slight Bearish Lean
This is a genuinely balanced setup:
Bullish Factors:
Venezuela blockade intensifying
Ukrainian strikes on Russian infrastructure
US rigs at multi-year lows
Inventories below seasonal averages
OPEC+ production pause
Weekly gain of +3%
Bearish Factors:
Record surplus expected for 2026
Ukraine peace talks progressing
US production near record highs
YTD: -18%
Prior trend was bearish
Oversupply fundamentals dominant
My Stance: NEUTRAL - Trade the Breakout
The symmetrical triangle is a neutral pattern. Geopolitical risks provide support, but oversupply fundamentals cap upside. The prior trend was bearish, which slightly favors a downside breakout, but geopolitical escalation could easily flip this bullish.
Strategy:
Wait for confirmed breakout
Long above $59.07 with volume
Short below $55.00 with volume
Don't trade the middle of the triangle
Watch Venezuela and Ukraine headlines
Trade Framework
Scenario 1: Bullish Breakout Trade
Entry Conditions:
4H close above $59.07
Volume exceeds recent average
Geopolitical catalyst
Trade Parameters:
Entry: $59.20-$59.50 on confirmed breakout
Stop Loss: $57.50 below recent support
Target 1: $60.48 (Risk-Reward ~1:0.7)
Target 2: $62.00-$63.00 (Risk-Reward ~1:2)
Target 3: $65.00 (Extended)
Scenario 2: Bearish Breakdown Trade
Entry Conditions:
4H close below $55.00
Volume confirmation
Peace deal progress or supply news
Trade Parameters:
Entry: $54.80-$55.00 on confirmed breakdown
Stop Loss: $56.50 above recent support
Target 1: $53.00 (Risk-Reward ~1:1.2)
Target 2: $51.00-$52.00 (Risk-Reward ~1:2.5)
Target 3: $50.00 (Extended)
Scenario 3: Range Trade Within Triangle
Entry Conditions:
Price tests triangle boundaries
Rejection candle at support/resistance
No breakout confirmation
Trade Parameters:
Buy Zone: $55.50-$56.00 (triangle support)
Sell Zone: $58.50-$59.00 (triangle resistance)
Stop Loss: Outside triangle boundaries
Target: Opposite boundary
Risk-Reward: ~1:1.5
Risk Management Guidelines
Position sizing: 1-2% max risk per trade
Wait for confirmed breakout - don't anticipate
Thin holiday volumes = amplified moves
Watch geopolitical headlines closely
Oil is highly volatile - use appropriate size
Scale out at targets
Move stop to breakeven after first target
Invalidation Levels
Bullish thesis invalidated if:
Price closes below $54.98 (major support)
Triangle breaks down with volume
Ukraine peace deal announced
OPEC+ increases production
Bearish thesis invalidated if:
Price closes above $60.48 (major resistance)
Triangle breaks up with volume
Major supply disruption
Venezuela situation escalates significantly
Conclusion
TVC:USOIL (WTI Crude) is trapped in a symmetrical triangle at $57.23, caught between geopolitical support and oversupply fundamentals. The pattern is compressing toward a breakout, with the apex approaching.
The Numbers:
Current Price: $57.23
YTD Performance: -18% (steepest drop since 2020)
Weekly Performance: +3% (best since October)
IEA 2026 Surplus Forecast: 4.0 million bpd
Key Levels:
$60.48 - MAJOR RESISTANCE (breakout level)
$59.07 - Triangle upper boundary
$57.23 - Current price
$55.50 - Triangle lower boundary
$54.98 - MAJOR SUPPORT (breakdown level)
The Setup:
Symmetrical triangle = neutral pattern. Geopolitical risks (Venezuela blockade, Ukraine strikes) provide support. Oversupply fundamentals (record surplus expected, US production near highs) cap upside. The breakout direction will determine the next major move.
Strategy:
NEUTRAL stance - wait for breakout
Long above $59.07 (targets $60.48, $62, $65)
Short below $55.00 (targets $53, $51, $50)
Don't trade the middle
Watch Venezuela and Ukraine headlines
The triangle will resolve soon. Let the market show its hand.

Wheat in Focus: How Ukraine, China, and Weather could move WheatWheat is one of the world’s most widely traded agricultural commodities, essential for food and animal feed. Prices are heavily influenced by global supply and demand, with major producers including the U.S., Russia, the EU, Canada, Australia, and Ukraine. Weather conditions, geopolitical events, and large importer activity can all create significant volatility in the market. Let’s break it down.
1. What Drives Wheat Prices
Supply Factors
Wheat supply is heavily shaped by the major exporting regions—Russia, the EU, Australia, the U.S., Canada, and Ukraine. Weather is the biggest swing factor: drought, heat stress, floods, or winterkill can quickly tighten global supply and spark rallies. Crop progress reports and yield updates show how each production cycle is developing, while geopolitics—especially in the Black Sea—can disrupt export flows overnight. Input costs like fertilizer and fuel influence how much farmers plant, and currency moves affect which exporters are most competitive. Together, these factors determine how much wheat the world can actually deliver to the market. To summarize:
Major producers: Russia, EU, Australia, U.S., Canada, Ukraine
Weather: drought, heat stress, winterkill, floods
Crop progress: planting pace, crop conditions, yield expectations
Geopolitics: Black Sea tensions, export bans, sanctions, port disruptions
Input costs: fertilizer, fuel, logistics
Currency impact: strong USD usually weighs on wheat prices
Demand Factors
Demand for wheat is driven by global food consumption, animal feed needs, and the buying behavior of major importers such as China, Egypt, and Indonesia. Economic conditions matter because stronger economies consume more food and feed. Price relationships with other grains like corn and rice can shift demand toward or away from wheat. Changes in trade flows—such as China sourcing more from the U.S. instead of the Black Sea—can quickly redirect global shipments. These factors help traders understand whether demand is strengthening or weakening relative to available supply. To summarize:
Global consumption (food + feed use)
Large importer buying: China, Egypt, Indonesia, Turkey
Economic conditions in EM (Emerging Markets)
Substitution vs. corn/rice
Global trade flow shifts
2. Key Reports Traders Actually Need to Track
Instead of monitoring everything, wheat traders focus on the handful of reports that truly move price:
WASDE (Monthly) – The most important report in wheat trading. This is where global production, consumption, exports, and ending stocks get revised.
Wheat can rip or dump instantly on WASDE changes. If you track only one thing, track WASDE.
Weekly USDA Export Sales – This shows an immediate view of demand. Watch for:
Big purchases from China, Egypt, Indonesia
Surprising cancellations
Shifts from Black Sea to U.S. buying
It’s one of the fastest ways to spot demand changes ahead of price.
Crop Progress (Weekly, in season) – Important only during planting, growing and harvesting periods. The report tracks:
% planted
% harvested
Crop condition (% good/excellent)
Poor Conditions generally = bullish. Strong Conditions generally = bearish
Geopolitical headlines – In our opinion wheat is the most geopolitically sensitive commodity. Anything related to the following can cause immediate moves.:
Corridor shutdowns
Port attacks
Export bans
Ceasefire rumors
This is the intraday volatility driver that news traders capitalize on.
Weather in key regions (Daily / weekly) – Focus on the key regions of the U.S. Plains, Black Sea, Australia.
Drought in these regions generally = bullish. Good moisture generally = bearish.
Use simple sources like NOAA maps or short ag weather summaries (weather reports that impact agriculture).
CFTC COT (Weekly) – This is for context and is not used for trading signals. It shows whether funds are heavily long or short. Only the extremes matter:
Funds very short → short-covering rallies possible
Funds very long → risk of liquidation selloffs
This report is more relevant for swing and position traders.
3. Recent Market Drivers
Peace-proposal speculation:
Reports of a U.S. proposal involving Ukraine ceding Donbas triggered a fast selloff as markets priced in the possibility of Ukrainian exports normalizing.
Zelenskiy has stated he won’t accept territorial concessions, so a confirmed ceasefire remains unlikely unless U.S./EU pressure increases.
Market reaction:
Wheat dumped immediately on the headline, but the move didn’t sustain — traders want confirmation, not speculation.
China buying U.S. wheat:
Ongoing chatter that China is shifting some purchases to the U.S. (no official tonnage yet). This is a supportive demand story worth monitoring.
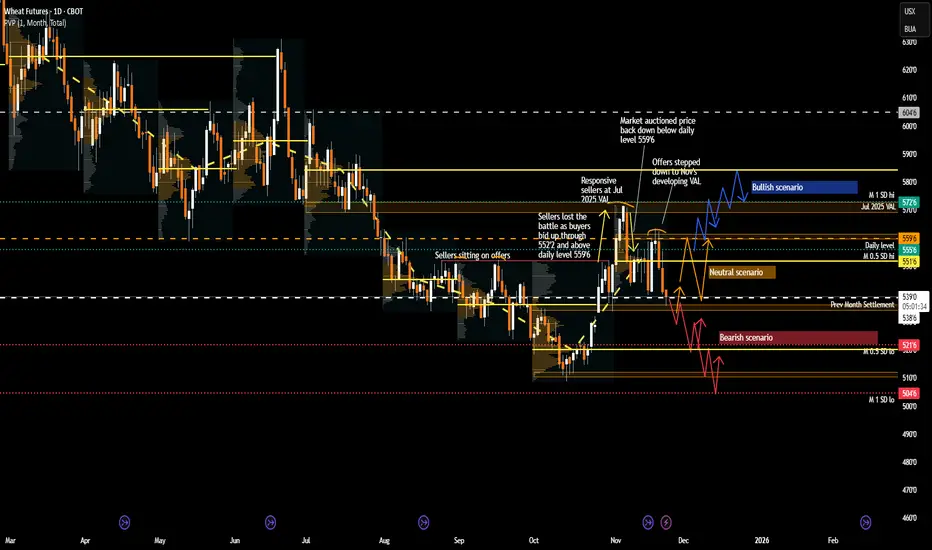
4. Chart Analysis: Recent Price Action and What to expect
The developing monthly VPOC for November 2025 has shifted higher, marking a potential change in market sentiment after three consecutive months of declining VPOCs. In addition, the developing VA for November appears unlikely to overlap with the previous month’s VA. This suggests that market conditions are changing and that the recent downward trend may be ending.
Market based out around 520 and rallied from mid-October to early November, breaking 552’4 (previous seller defense) and reclaiming back above 559’6 daily level.
This rally was likely supported by the potential U.S.–China trade deal and initial Chinese wheat purchases in early November.
However, sellers stepped in at 570 (July’s VAL + monthly 1SD high), offering price back below 559’6. Market is now rotating inside a developing range between 559’6 and the 540–535’6 zone (October settlement/LVN) to establish value.
Bearish Scenario
A break and acceptance below 540 opens the door toward:
520 (October’s VPOC + monthly 0.5SD low)
510 (October low)
504’6 (monthly 1SD low)
Catalyst: Any news of confirmed progress toward a Russia–Ukraine ceasefire → removal of war-premium → likely downside.
Bullish Scenario
If market accepts back above 559’6, sets up a move toward:
570 (July VAL / M 1SD high) — expect sellers here.
585’6 (July VPOC) if 570 is cleared
Catalyst: Headline reversal or escalation in the conflict between Russia and Ukraine.
Neutral Scenario
Without fresh catalysts, expect continued range rotation between 559’6 and 540, with the market establishing value in this zone.
5. Conclusion
Wheat remains a headline-driven and weather-sensitive market, where geopolitical developments, major buyer activity, and crop conditions can quickly shift sentiment. Traders should monitor key reports and technical levels while staying aware of global supply and demand dynamics. With multiple factors in play, range rotations and sudden spikes or drops are likely until a clear catalyst drives the market decisively.
What are your thoughts? Are you watching the headlines, weather, or technical levels for clues? Please share your insights below and give this post a boost so the rest of the community can join the conversation.
Glossary Index for technical terms used:
VAH (Value Area High)
VAL (Value Area Low)
VPOC (Volume Point of Control)
SD (Standard Deviation)
LVN (Low Value Node)
VA (Value Area)
EUR/USD Daily Chart Analysis For Week of Dec 19, 2025Technical Analysis and Outlook:
In this week’s trading session, the Euro market experienced an upside breakout, reaching the Interim Inner Currency Rally target at 1.178, having crossed the Mean Resistance level at 1.175. With this completion, current market conditions demonstrate a downward trend, with the primary objective being the Mean Support level at 1.163.
On the upside, we anticipate a healthy dead-cat rebound from the Mean Support at 1.163, aiming for the price zone around 1.169. It’s important to note that some intermediate upward momentum may occur within this downward trend before prices realign with the expected trajectory.

Can a Currency Rise While Science Dies?Argentina's peso stands at a historic crossroads in 2026, stabilized by unprecedented fiscal discipline yet undermined by the systematic dismantling of its scientific infrastructure. President Javier Milei's administration has achieved what seemed impossible: a fiscal surplus of 1.8% of GDP and inflation falling from 211% to manageable monthly rates around 2%. The peso's transformation from distressed asset to commodity-backed currency relies on the massive Vaca Muerta energy formation and lithium reserves, supported by a US-aligned trade framework that reduces political risk premiums. The launch of new inflation-linked currency bands in January 2026 signals normalization, while energy exports are projected to generate a cumulative total of $300 billion through 2050.
However, this financial renaissance masks a profound intellectual crisis. CONICET, Argentina's premier research council, suffered a 40% real budget cut, resulting in the loss of 1,000 staff members and triggering a brain drain that saw 10% of researchers abandon the system. Salaries collapsed 30% in real terms, forcing scientists into Uber driving and manual labor. Patent filings plummeted to a multi-decade low of 406 annually, while the country ranks a dismal 92nd globally in innovation inputs despite 64th in outputs. The administration views public science as fiscal waste, creating what critics call "scienticide," the systematic destruction of research capacity that took decades to build.
The peso's future hinges on whether geological wealth can compensate for cognitive atrophy. Energy and mining investments under the RIGI regime (offering 30-year fiscal stability) total billions, fundamentally altering the balance of payments. Yet import tariff eliminations on technology threaten 6,000 jobs in Tierra del Fuego's assembly sector, while the gutting of research labs compromises long-term capacity in biotechnology, nuclear energy, and software development. The geopolitical bet on US alignment provides bridge financing through IMF support, but tensions with China, a vital trade partner for soy and beef exports, create vulnerability. Argentina is transforming into a commodity superpower with a deliberately hollowed-out knowledge economy, raising the question: Can a nation prosper long-term by trading brainpower for barrels?
