EUR/USD Daily Chart Analysis For Week of Oct 17, 2025Technical Analysis and Outlook:
Last week, we had an interesting trading session! The Euro demonstrated a considerable increase after reaching our crucial Mean Support level at 1.155. Nevertheless, this significant upward reversal fell marginally short of the Mean Resistance at 1.174, leading to a subsequent decline in the currency.
Current market indicators suggest that this Active Inner Rebound movement is unlikely to be sustainable. Ongoing market sentiment consistently reflects a retracement toward the Outer Currency Dip, designated at 1.145. Should this downward trend persist, it may extend further to the Key Support level of 1.140.
Conversely, it is essential to acknowledge and be aware of the emergence of an Auxiliary Inner Rebound following the Outer Currency Dip at 1.145, in conjunction with the Key Support level of 1.140.
Geopolitics

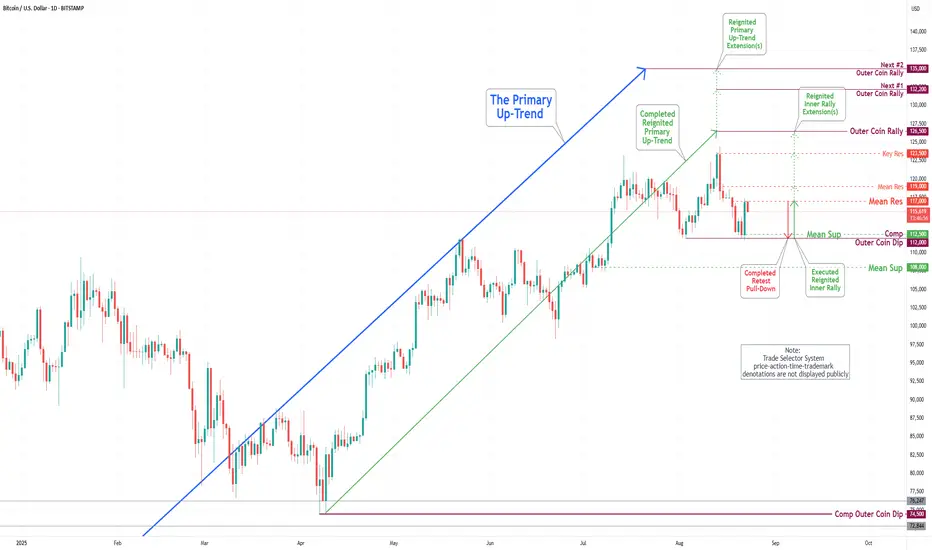
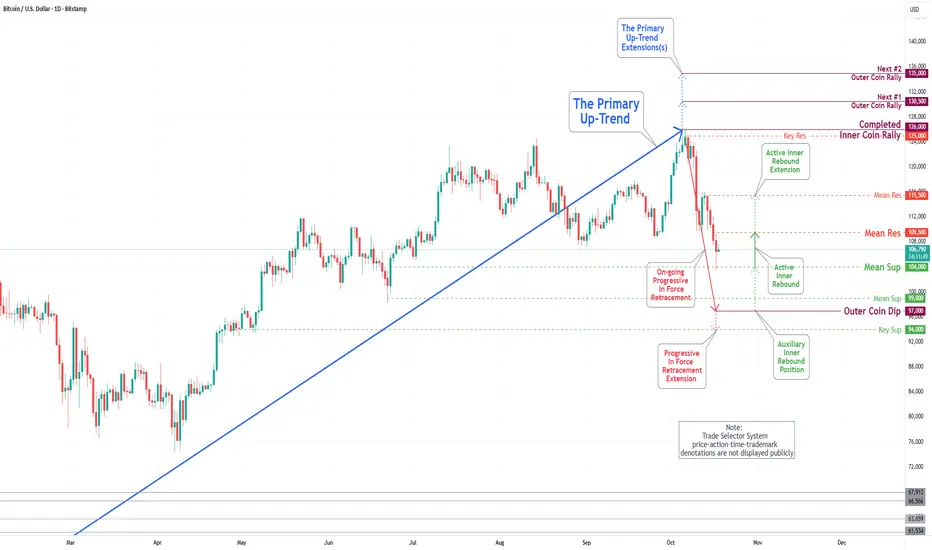
Bitcoin(BTC/USD) Daily Chart Analysis For Week of Oct 17, 2025Technical Analysis and Outlook:
In the most recent trading session, the Bitcoin market experienced a significant decline, falling below critical support levels of 108000 and 105700, as the price is currently actively fluctuating between these two points.
The current market analysis indicates an initial potential rebound towards the Mean Resistance level of 109500, with further extension possibilities up to the Mean Resistance level of 115500. It is essential to recognize and be aware that an Auxiliary Inner Rebound occurrence following the Outer Coin Dip, marked as a 97000, in conjunction with the Mean Support level of 99000. This scenario is particularly significant at the Progressive In-Force retracement extension, identified as the Key Support level of 94000.
Geopolitical Risks and Market Volatility1. Introduction
Financial markets thrive on stability, transparency, and predictability. However, the world is rarely stable — political tensions, wars, trade disputes, and diplomatic breakdowns often disrupt this equilibrium. These disruptions, known as geopolitical risks, can trigger market volatility — sharp fluctuations in asset prices as investors react to uncertainty. In the modern interconnected world, where economies are tightly woven through trade and capital flows, even a local conflict can send ripples across global markets.
The interplay between geopolitics and market volatility is not new. From oil shocks in the 1970s to Russia’s invasion of Ukraine in 2022, geopolitical events have consistently tested global investors’ ability to manage uncertainty. Today, as the world faces new risks — shifting power dynamics, energy crises, cyber warfare, and climate-related security threats — understanding how geopolitics drives market behavior has become essential for policymakers, investors, and businesses.
2. Understanding Geopolitical Risk
Geopolitical risk refers to the probability that political, social, or military events will adversely impact the global economy or financial markets. These risks often arise from the actions of states, non-state actors, or changes in global governance systems. Unlike financial or operational risks, geopolitical risks are exogenous — they originate outside the economic system and are harder to predict or quantify.
2.1 Types of Geopolitical Risks
Military Conflicts and Wars
Wars directly disrupt trade, energy supply, and investment flows. For example, the 2022 Russia–Ukraine war reshaped global energy markets and led to inflationary shocks in Europe and beyond.
Trade Wars and Economic Sanctions
When major economies impose tariffs or sanctions, global supply chains are affected. The U.S.–China trade war (2018–2020) disrupted global technology and manufacturing sectors, reducing investor confidence.
Political Instability and Regime Change
Coups, elections, or political transitions can create uncertainty about policy continuity. Investors tend to withdraw capital from politically unstable regions, leading to currency depreciation and stock market sell-offs.
Terrorism and Security Threats
Terrorist attacks, such as those on September 11, 2001, can cause short-term panic and long-term risk repricing in financial markets.
Resource Conflicts and Energy Security
Countries competing for oil, gas, or rare earth minerals can destabilize markets. For instance, tensions in the Strait of Hormuz — through which 20% of the world’s oil passes — often cause crude prices to spike.
Cyber Warfare and Information Attacks
State-sponsored cyberattacks on financial institutions or critical infrastructure can disrupt global capital markets and reduce trust in digital systems.
Global Alliances and Sanctions Regimes
Shifting alliances like BRICS expansion, NATO dynamics, or Western sanctions can reshape global trade, currency reserves, and capital flows.
3. Mechanisms Linking Geopolitics to Market Volatility
Geopolitical events affect markets through multiple channels, both direct and indirect.
3.1 Investor Sentiment and Risk Aversion
When geopolitical tensions rise, investors tend to move from risky assets (equities, emerging-market bonds) to safer ones (U.S. Treasuries, gold, and the U.S. dollar). This phenomenon, called the “flight to safety”, leads to a sell-off in risk assets and a rally in safe havens. For example:
During the Russia–Ukraine conflict, gold prices surged above $2,000 per ounce as investors sought refuge.
U.S. Treasury yields fell as investors bought bonds, despite inflation concerns.
3.2 Impact on Trade and Supply Chains
Wars, sanctions, or tariffs can disrupt global supply chains, raising production costs and slowing growth. For example:
The Red Sea shipping disruptions and Taiwan Strait tensions have threatened semiconductor and energy transport routes.
Higher logistics costs translate to inflation, which affects central bank policies and, in turn, financial markets.
3.3 Energy and Commodity Prices
Energy markets are particularly sensitive to geopolitical risk. Oil prices react sharply to conflicts in the Middle East, OPEC decisions, or Russian production cuts. Since energy costs feed into nearly all economic sectors, geopolitical shocks often lead to global inflation.
3.4 Currency and Capital Flows
Political instability often leads to currency depreciation as investors withdraw capital. Emerging markets are especially vulnerable — for instance, Turkey’s lira or Argentina’s peso tend to fall during domestic or regional instability. Conversely, “safe-haven” currencies such as the U.S. dollar, Swiss franc, and Japanese yen typically strengthen.
3.5 Central Bank and Policy Reactions
Geopolitical risks force central banks to navigate between inflation control and financial stability. For example:
The European Central Bank (ECB) struggled to balance energy-driven inflation with growth risks following the Ukraine war.
The U.S. Federal Reserve may slow rate hikes during heightened uncertainty to prevent market collapse.
4. Historical Case Studies of Geopolitical Volatility
4.1 The 1973 Oil Crisis
Triggered by the Arab–Israeli conflict and OPEC’s oil embargo, crude oil prices quadrupled within months. Global inflation soared, causing recessions in Western economies. Stock markets worldwide plunged, and the crisis redefined energy security as a core geopolitical concern.
4.2 The Gulf Wars (1990–1991, 2003)
Both Gulf Wars caused spikes in oil prices and temporary global market corrections. While short-lived, these shocks reinforced the sensitivity of markets to Middle Eastern instability.
4.3 9/11 Terrorist Attacks (2001)
The September 11 attacks led to the closure of U.S. stock exchanges for nearly a week. When trading resumed, the Dow Jones Industrial Average fell over 7% in one day — the largest single-day drop at the time. The shock also reshaped global security spending and introduced new risk metrics into financial modeling.
4.4 The U.S.–China Trade War (2018–2020)
The imposition of tariffs on billions of dollars of goods disrupted supply chains, hurt technology stocks, and weakened global growth forecasts. Investors fled emerging markets, and volatility indices like the VIX surged repeatedly during trade negotiations.
4.5 Russia–Ukraine Conflict (2022–Present)
This conflict triggered one of the largest market disruptions since 2008. Energy prices soared, European equities dropped sharply, and inflation rose globally. The war accelerated global de-dollarization trends, strengthened NATO alliances, and spurred defense sector growth — all while increasing market uncertainty.
5. Measuring Geopolitical Risk
5.1 The Geopolitical Risk Index (GPR)
Developed by Caldara and Iacoviello (2018), the GPR Index quantifies geopolitical tensions using newspaper coverage of wars, terrorist acts, and political crises. It provides a statistical measure to correlate geopolitical shocks with financial volatility.
5.2 Market Volatility Index (VIX)
Known as the “fear index,” the VIX measures implied volatility in S&P 500 options. During geopolitical crises, the VIX typically spikes — reflecting investors’ anxiety about future price swings.
5.3 Credit Default Swaps (CDS) and Bond Spreads
When geopolitical risks rise, sovereign bond spreads widen, and CDS prices increase — signaling that investors demand higher premiums for holding risky debt.
6. Asset Class Responses to Geopolitical Shocks
6.1 Equities
Short-term reaction: Immediate sell-offs due to uncertainty.
Medium-term: Recovery often depends on how the conflict evolves.
Sector performance: Defense, energy, and cybersecurity stocks often outperform during crises.
6.2 Fixed Income
Government bonds — especially U.S. Treasuries — act as safe havens. Yields typically fall as bond prices rise. However, inflation-linked bonds may perform better when geopolitical shocks cause price spikes.
6.3 Commodities
Gold, silver, and oil are the most sensitive commodities to geopolitical risk.
Gold = hedge against uncertainty.
Oil = reflects conflict-related supply fears.
Agricultural commodities = affected by sanctions or export bans (e.g., Ukraine’s grain crisis).
6.4 Currencies
Safe-haven currencies (USD, JPY, CHF) gain during crises, while risk-sensitive ones (AUD, emerging-market FX) weaken. Sanctions can cause currency collapses, as seen with the Russian ruble in early 2022.
6.5 Cryptocurrencies
Bitcoin and other digital assets have shown mixed reactions — sometimes acting as alternative hedges, though volatility remains high. During the Russia–Ukraine war, crypto transfers surged as citizens sought to bypass banking disruptions.
7. The Role of Media, Information, and Speculation
In the digital age, information speed amplifies volatility. News outlets, social media, and algorithmic trading systems react instantly to geopolitical headlines. False or exaggerated reports can cause flash crashes or speculative bubbles.
For instance, a single tweet about potential military action or sanctions can trigger billions in market movements within seconds. This information-driven volatility underscores the role of behavioral finance — where investor psychology magnifies reactions to uncertainty.
8. Managing Geopolitical Risk in Investment Strategy
8.1 Diversification
Geographically diversified portfolios can cushion against regional shocks. Holding assets across continents or currencies reduces exposure to any single geopolitical event.
8.2 Safe-Haven Allocation
Investors often include gold, U.S. Treasuries, or defensive stocks (utilities, consumer staples) in portfolios to offset riskier holdings during crises.
8.3 Hedging Instruments
Options, futures, and currency forwards allow investors to hedge geopolitical risk. For instance, crude oil futures can protect against energy price spikes.
8.4 Scenario Analysis and Stress Testing
Institutional investors model “what-if” scenarios (e.g., China–Taiwan conflict, Middle East escalation) to assess portfolio resilience. Stress testing helps anticipate extreme outcomes.
8.5 Political Risk Insurance
Multinational corporations use political risk insurance to mitigate losses from expropriation, contract breaches, or civil unrest.
9. Emerging Geopolitical Themes Affecting Markets
9.1 U.S.–China Rivalry
Beyond trade, competition extends into technology (AI, semiconductors, 5G) and global governance. “Tech decoupling” may reshape global supply chains and capital flows.
9.2 The Rise of Multipolarity
The post-Cold War unipolar world is giving way to a multipolar one — where the U.S., China, Russia, India, and regional powers like Saudi Arabia assert influence. This creates overlapping alliances and uncertainty in global trade.
9.3 Energy Transition and Green Geopolitics
As nations shift toward renewable energy, control over critical minerals (lithium, cobalt, nickel) becomes strategic. The geopolitical race for green resources could replicate past oil conflicts.
9.4 Cyber and Information Warfare
Modern conflicts often occur in cyberspace — targeting infrastructure, elections, or corporate systems. The financial cost of cyber incidents can exceed physical warfare impacts.
9.5 Middle East and Energy Stability
Tensions involving Iran, Israel, and Gulf states continue to influence oil and gas supply expectations, shaping inflation and central bank decisions.
9.6 Climate and Migration Pressures
Climate-induced displacement, food insecurity, and water scarcity are emerging geopolitical flashpoints that can trigger political instability and financial disruption.
10. Long-Term Implications for Global Markets
Geopolitical risks are no longer isolated shocks — they are structural forces shaping long-term investment strategy. Globalization is evolving toward “selective interdependence”, where nations collaborate in some areas but compete fiercely in others. Investors must adapt to a world where volatility is structural, not temporary.
10.1 Regionalization of Trade and Finance
Global supply chains are being reconfigured toward “friend-shoring” — producing goods in politically aligned countries. This reduces efficiency but enhances resilience.
10.2 Defense and Security Spending Boom
Nations are ramping up defense budgets, benefitting aerospace and cybersecurity sectors. Investors view these as long-term growth areas.
10.3 Inflationary Geopolitics
Energy and commodity disruptions keep inflation structurally higher, challenging central banks and altering interest rate expectations.
10.4 Financial Fragmentation
The global financial system may divide along geopolitical lines — with parallel payment systems, currency blocs, and reserve diversification away from the U.S. dollar.
11. Conclusion
Geopolitical risks and market volatility are inseparable components of the global financial ecosystem. From oil shocks and trade wars to cyber conflicts and power shifts, political dynamics shape investor sentiment, asset prices, and capital flows.
While technology has made markets faster and more efficient, it has also magnified the speed at which geopolitical uncertainty spreads. The challenge for investors is not to avoid geopolitical risk — which is impossible — but to understand, anticipate, and adapt to it.
In a world where power is diffused, alliances are shifting, and crises are increasingly interconnected, the ability to interpret geopolitical signals will define the next generation of successful investors and policymakers.
Ultimately, geopolitical awareness is not optional — it is a strategic necessity in managing portfolios, protecting economies, and ensuring stability in an unpredictable global landscape.
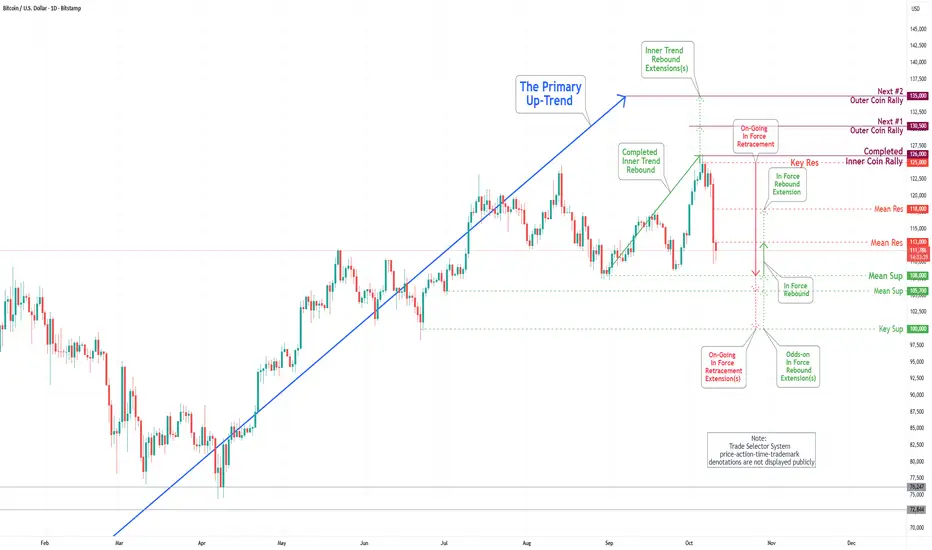
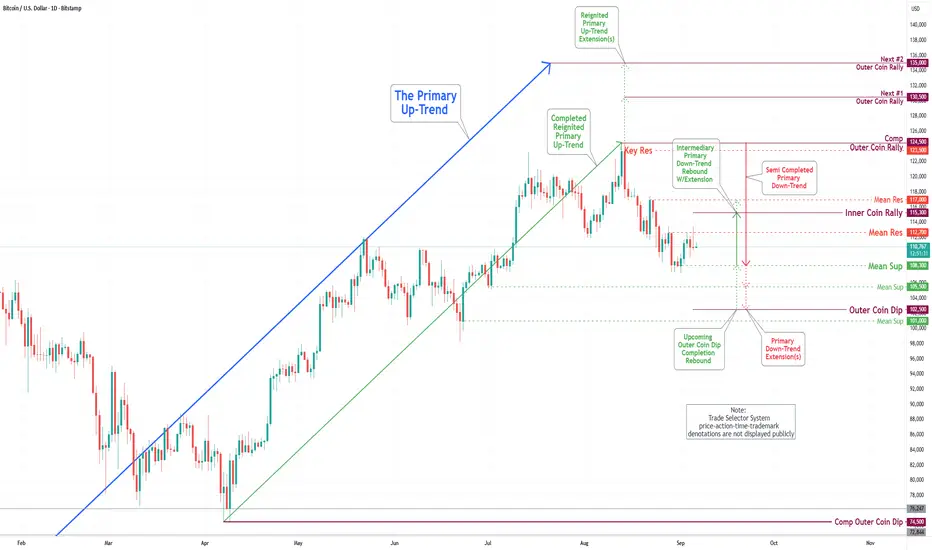
Bitcoin(BTC/USD) Daily Chart Analysis For Week of Oct 10, 2025Technical Analysis and Outlook:
During the most recent trading session, the Bitcoin market experienced a notable decline, falling below significant support levels of 120000, 117500, and 114000, respectively. Current market analysis indicates an initial potential retracement toward the Mean Support level of 108000, with further extension possibilities to the Mean Support level of 105700 and the Key Support level of 100000. It is crucial to acknowledge that intermediary rebounds may occur at these defined levels, particularly at the Mean Resistance level of 113000.
Can Light Truly Power the Future of AI?The exponential rise of artificial intelligence has exposed the physical limits of traditional electronic infrastructure. Electrical interconnects, once the backbone of computation, now struggle under escalating data demands, generating immense heat and power inefficiency. POET Technologies emerges as a transformative force in this landscape, leveraging its Optical Interposer™ platform to integrate electronic and photonic components at the wafer level. This innovation enables data speeds of 800G to 1.6T, meeting the insatiable bandwidth needs of AI clusters and hyperscale data centers while drastically reducing energy consumption.
At the core of POET’s advantage lies its patented low-thermal budget process, which allows photonic integration without the costly, high-temperature methods typical of semiconductor manufacturing. This approach not only minimizes thermal mismatches and signal losses but also aligns perfectly with existing CMOS foundry infrastructure—forming the foundation of an “asset-light” business model. By licensing its process and forming strategic joint ventures, POET scales efficiently without massive capital expenditure. Its collaborations with Foxconn and Semtech validate the platform’s industrial readiness, while a $75 million private placement strengthens its financial capacity to accelerate research, acquisitions, and manufacturing partnerships.
Beyond technology, POET’s innovations carry profound geopolitical and environmental implications. As nations race to secure semiconductor independence and energy resilience, POET’s energy-efficient, domestically manufacturable photonics become a critical strategic asset. Optical interconnects can cut data center power consumption by up to half, directly addressing mounting sustainability and national security concerns tied to AI’s energy footprint. Moreover, photonic architectures inherently enhance cybersecurity by offering interference-resistant, ultra-low-latency communication essential for distributed AI and defense systems.
In essence, POET Technologies transcends the definition of a semiconductor company; it represents the physical infrastructure upon which the next phase of artificial intelligence, digital sovereignty, and global energy stability may rest. By turning light into the new language of computation, POET positions itself not merely as a market participant but as an indispensable enabler of AI’s sustainable and secure future.

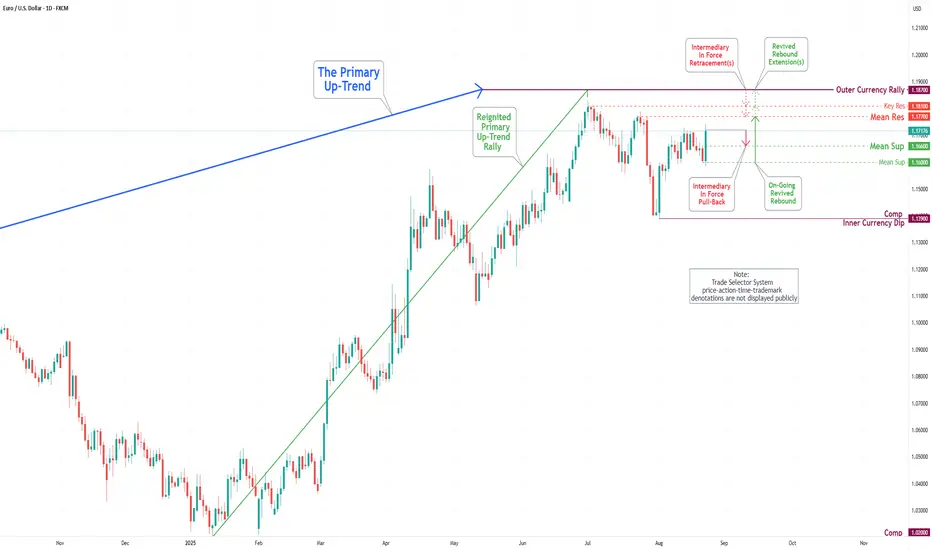
EUR/USD Daily Chart Analysis For Week of Oct 3, 2025Technical Analysis and Outlook:
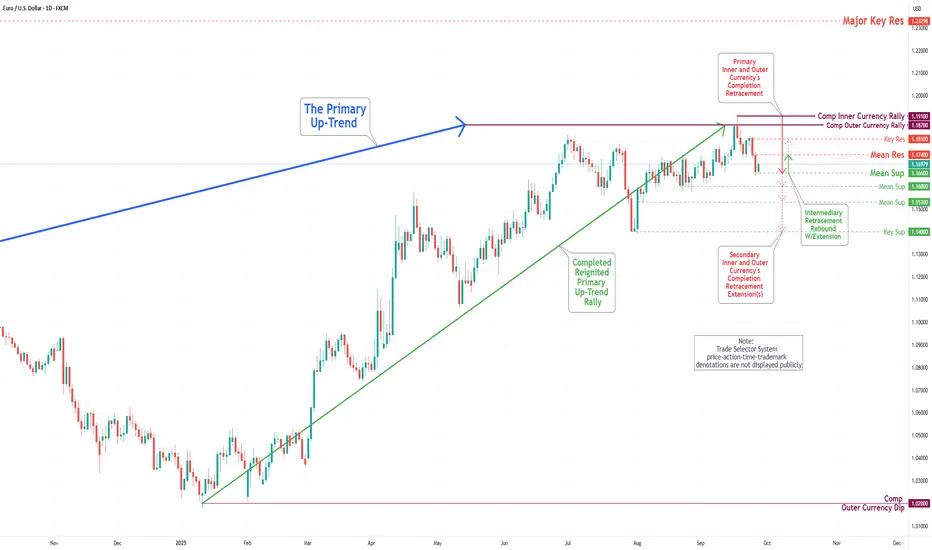
During the trading session last week, the Euro fluctuated within the Mean Resistance level of 1.174. Current market dynamics suggest that this pattern may continue, with a strong focus on the Key Resistance level of 1.182, potentially leading to a retest of the completed Outer Currency Rally at 1.187 and the completed Inner Currency Rally at 1.191.
On the other hand, recent price action suggests a potential downward movement toward the Mean Support level of 1.166. There is a chance that this decline could extend further down to the Key Support level of 1.140.

Bitcoin(BTC/USD) Daily Chart Analysis For Week of Oct 3, 2025Technical Analysis and Outlook:
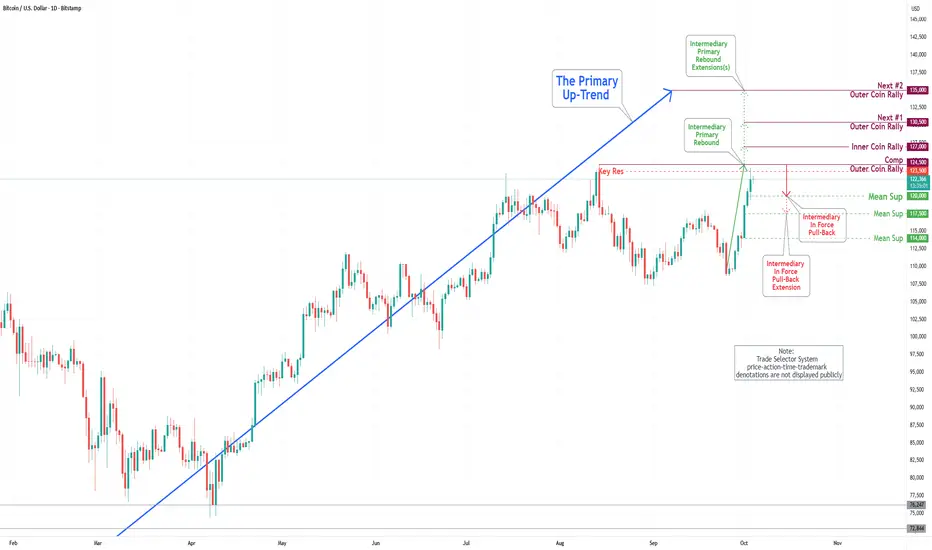
During the most recent trading session, the Bitcoin market exhibited a notable surge, surpassing our Mean Resistance levels of 111600 and 113300, and the established Inner Coin Rally threshold of 117700. Currently, Bitcoin is fluctuating around the Key Resistance level of 123500 as it attempts to retest the completed Outer Coin Rally at 124500.
Following the conclusion of this retest, it is anticipated that the cryptocurrency may initiate an Intermediary In-Force Pullback towards the Mean Support target of 120000, with the potential for a further correction dip to Mean Support at 117500. Upon the completion of this phase(s), we expect Bitcoin to resume its upward trajectory.
Current analysis suggests the following designated upside targets: the Inner Coin Rally at 127000, the Next #1 Outer Coin Rally at 130500, and the Next #2 Outer Coin Rally at 135000. It is essential to recognize that Intermediary In-Force Pullbacks may occur at these specified levels.
EUR/USD Daily Chart Analysis For Week of Sep 26, 2025Technical Analysis and Outlook:
During the trading session of the previous week, the Euro successfully retreated to the critical Mean Support level of 1.173 and proceeded to exhibit a continued downward trend, with a subsequent Mean Support level established at 1.166. Current market dynamics suggest a likelihood of sustaining this downward trend. The primary targets identified for this trend include Mean Support levels of 1.160, 1.153, and the Key Support level at 1.140.
Conversely, the current price action suggests a potential upward movement towards the Mean Resistance level of 1.174. There exists a modest possibility of extending this rebound to reach the Key Resistance level of 1.181.
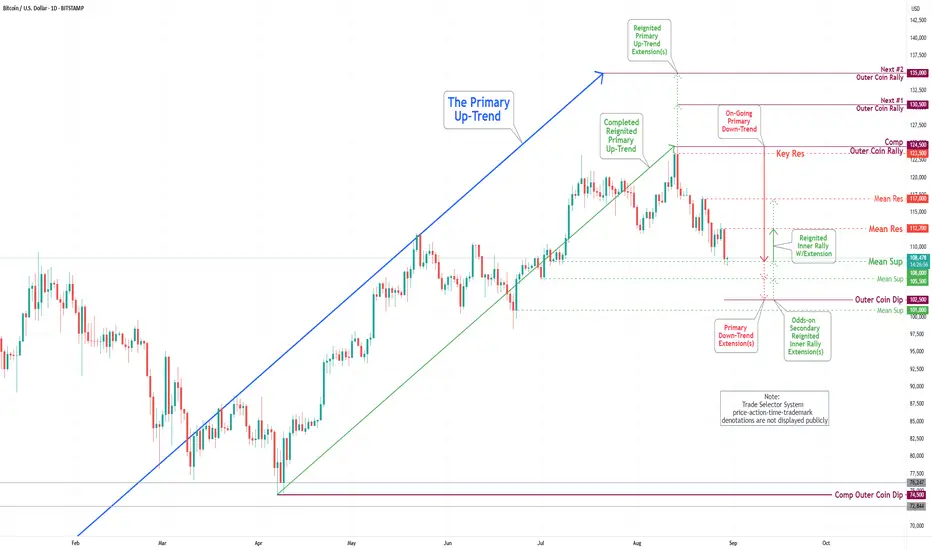
Bitcoin(BTC/USD) Daily Chart Analysis For Week of Sep 26, 2025Technical Analysis and Outlook:
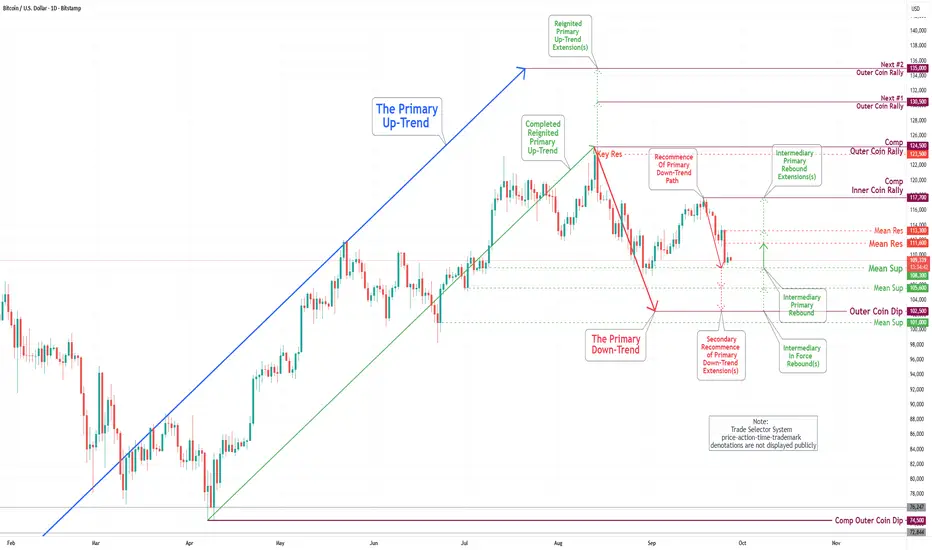
In the most recent trading session, the Bitcoin market experienced a significant decline, surpassing Mean Support levels at 114500 and 111500, and is currently fluctuating around the Mean Support level of 108300. Consequently, Bitcoin is continuing its trajectory in a primary downward trend, with the primary target identified as the Outer Coin Dip 102500.
Current analysis suggests a modest likelihood that the continuation of the primary downtrend could lead to a retest of the Mean Resistance at 111600, potentially extending to the Mean Resistance at 113300.
Nevertheless, it is essential to acknowledge that the prevailing sentiment within the Bitcoin market remains bearish. Following the conclusion of the primary downtrend at the outer support level of 102500, it is anticipated that Bitcoin will resume its upward trajectory.
Gold hits record 3,759 | Safe-haven flows surge back🟡 XAU/USD – 23/09 | Captain Vincent ⚓
🔎 Captain’s Log – Context & News
Today Gold surged nearly +2% , hitting a record $3,759/oz .
Geopolitical tensions : Israel launched missiles into Lebanon, killing 5 (including 4 US citizens) → safe-haven demand rushed back into Gold.
USD weakened , capital flowed out of stocks & bonds → strong support for precious metals.
ETFs & speculators : heavy buying amplified the rally.
Silver : jumped to its highest level in 14 years, reinforcing strength in the precious metals sector.
⏩ Captain’s Summary : Gold is fueled by geopolitics, macro factors, and safe-haven demand. But after a hot rally, the big question: continue breaking highs or face sharp swings if the FED shifts tone?
📈 Captain’s Chart – Technical Analysis (H45)
Storm Breaker (Resistance / Sell Zone)
3,771 – 3,787 (Fibo 0.5–0.618 confluence, ATH test zone)
Golden Harbor (Support / Buy Zone)
Near support: 3,740 (previous high turned support)
OB Dock: 3,717 – 3,723
Breakout Harbor: 3,689 – 3,691
Market Structure
Gold broke out to Higher High around 3,755 – 3,759.
Main trend remains bullish, but prone to volatility / pullback after a hot rally.
🎯 Captain’s Map – Trade Plan
✅ Buy (trend-follow priority)
Buy Zone 1 (OB)
Entry: 3,717 – 3,723
SL: 3,707
TP: 3,725 – 3,730 – 3,735 – 3,740 – 3,750
Buy Zone 2 (Breakout Retest)
Entry: 3,689 – 3,691
SL: 3,678
TP: 3,699 – 3,710 – 3,7xx
⚡ Sell (short-term scalp if overbought)
Sell Zone (ATH test)
Entry: 3,783 – 3,785
SL: 3,795
TP: 3,759 – 3,740 – 3,717
⚓ Captain’s Note
“The geopolitical storm pushed the Golden sails past 3,759. Golden Harbor 🏝️ (3,717 – 3,689) is the safe dock for sailors to board the northbound trend. Storm Breaker 🌊 (3,771 – 3,787) may raise heavy waves, suitable for short Quick Boarding 🚤 scalps. The main voyage remains bullish, but after a hot rally, sailors must keep a firm hand on the helm to avoid being thrown off by choppy swings.”

EUR/USD Daily Chart Analysis For Week of Sep 19, 2025Technical Analysis and Outlook:
During the trading session of the previous week, the Euro successfully retested the completed Inner Currency Rally at 1.177 and displayed significant upside momentum, reaching and completing the Outer Currency Rally at 1.187, with Key Resistance noted at 1.181. Following this completion, the Euro reversed its course and experienced a sharp decline, ultimately resting at the Mean Support level of 1.173.
It is imperative to highlight that the current market dynamics indicate a likelihood of continued downward movement from recent price levels. Attention should be directed towards additional support targets established at 1.169 and 1.162.
Conversely, the present price action suggests a potential retest of the completed Inner Currency Rally at 1.177 and Outer Currency Rally at 1.187, which will lead to a substantial pullback from these upward targets.

EUR/USD Daily Chart Analysis For Week of Sep 12, 2025Technical Analysis and Outlook:
In the previous trading session, the Euro completed an Inner Currency Rally at 1.177, resulting in a significant decline towards the Mean Support level of 1.164. Subsequently, the Euro reversed direction and fell sharply below the completed Inner Currency Rally level of 1.177.
Current analysis indicates that the primary targets for the Euro include a retest of the completed Inner Currency Rally at 1.177, with the potential for further upward movement to the Key Resistance level at 1.181. Additionally, there is a long-anticipated target positioned at the Outer Currency Rally level of 1.187. The ongoing price action may yield a substantial pullback from these upward targets.
It is essential to emphasize that the current market dynamics suggest a substantial drop from recent price levels, with attention directed towards the primary target of Mean Support at 1.164, and the possibility of extending this trajectory towards Mean Support at 1.160.

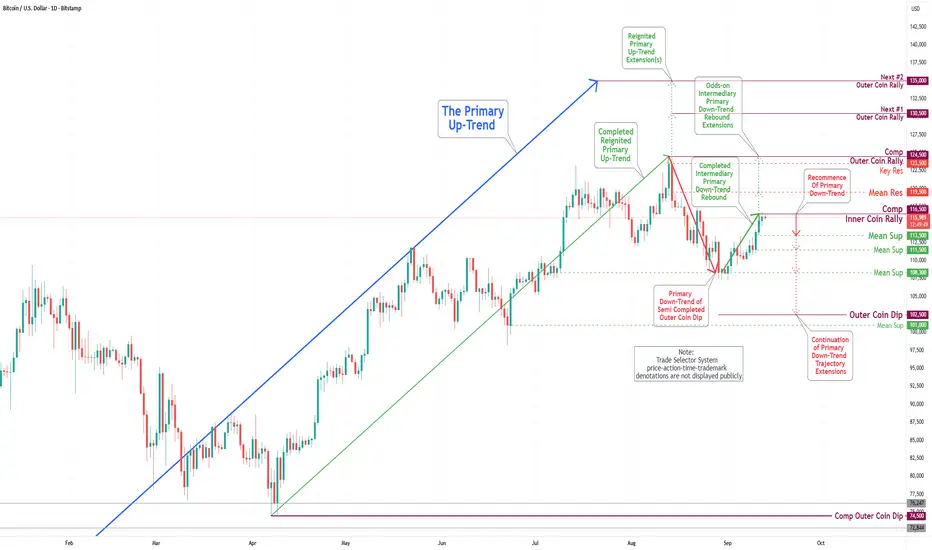
Bitcoin(BTC/USD) Daily Chart Analysis For Week of Sep 12, 2025Technical Analysis and Outlook:
In the preceding trading session, the Bitcoin market demonstrated an upside resurgence, ultimately completing Inner Coin Dip 116500. Subsequently, the cryptocurrency is experiencing a recommencement of intermediary Primary Down-Trend rebound with the main target being Mean Support 113500, and additional extensions marked as Mean Support 111500 and 108300, respectively.
Current analysis suggests a slight possibility that the Intermediate Primary Rebound may extend towards Key Resistance at 123500, potentially leading to a retest of the completed Outer Coin Rally at 124500.
It is crucial to emphasize that the Semi-completed Outer Coin Dip at 102500 signifies the principal ongoing downtrend and accurately reflects the prevailing market sentiment. Upon the completion of this phase, it is anticipated that Bitcoin will resume its bullish trajectory.
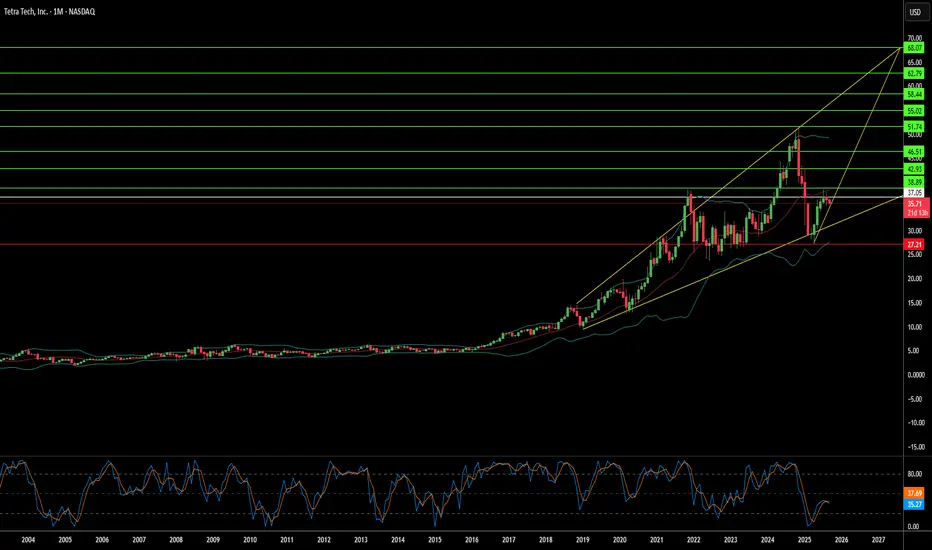
When Does Destruction Create Trillion-Dollar Opportunity?Tetra Tech's remarkable market surge represents a confluence of technological innovation and geopolitical opportunity that positions the Pasadena-based engineering firm at the epicenter of global reconstruction efforts. The company has distinguished itself through substantial intellectual property holdings—over 500 global patents across infrastructure and environmental technologies—and cutting-edge capabilities, including an AI innovation lab focused on robotics, cloud migration, and cognitive systems that automate complex engineering workflows. This technological foundation has translated into impressive financial performance, with the company reporting approximately 11% revenue growth year-over-year in Q3 2025 and maintaining a record backlog of $4.15 billion while earning "Moderate Buy" ratings from analysts with price targets in the low $40s.
The strategic value proposition extends far beyond traditional engineering services into the realm of conflict-zone reconstruction, where Tetra Tech's four decades of experience in war-torn regions uniquely position it for emerging opportunities. The company already maintains USAID contracts in conflict areas, including a $47 million project in the West Bank and Gaza, and has demonstrated critical capabilities in Ukraine through generator deployment, power grid restoration, and explosive ordnance clearance operations. These competencies align precisely with the skill sets required for large-scale reconstruction efforts, from debris removal and pipeline repair to the engineering of essential infrastructure systems, including roads, power plants, and water treatment facilities.
Gaza's reconstruction represents a potentially transformative business opportunity that could fundamentally alter Tetra Tech's trajectory. Conservative estimates place Gaza's infrastructure rebuilding needs at $18-50 billion over approximately 14 years, with immediate priorities including roads, bridges, power generation, water treatment systems, and even airport reconstruction. A major contract in this range—potentially $10-20 billion—would dwarf Tetra Tech's current market capitalization of approximately $9.4 billion and could significantly increase the company's annual revenue. The strategic importance is amplified by broader geopolitical initiatives, including proposed Gaza trade corridors linking Asia and Europe as part of U.S.-led stability plans that envision Gaza as a revived commercial hub.
Institutional investors have recognized this potential, with 93.9% of shares held by institutional owners and recent substantial position increases by firms like Paradoxiom Capital, which acquired 140,955 shares worth $4.1 million in Q1 2025. The convergence of global infrastructure demand—estimated at $64 trillion over the next 25 years—with Tetra Tech's proven expertise in high-stakes reconstruction projects creates a compelling investment thesis. The company's combination of advanced technology capabilities, extensive patent portfolio, and demonstrated success in complex geopolitical environments positions it as a primary beneficiary of the intersection between global instability and the massive capital deployment required for post-conflict reconstruction.
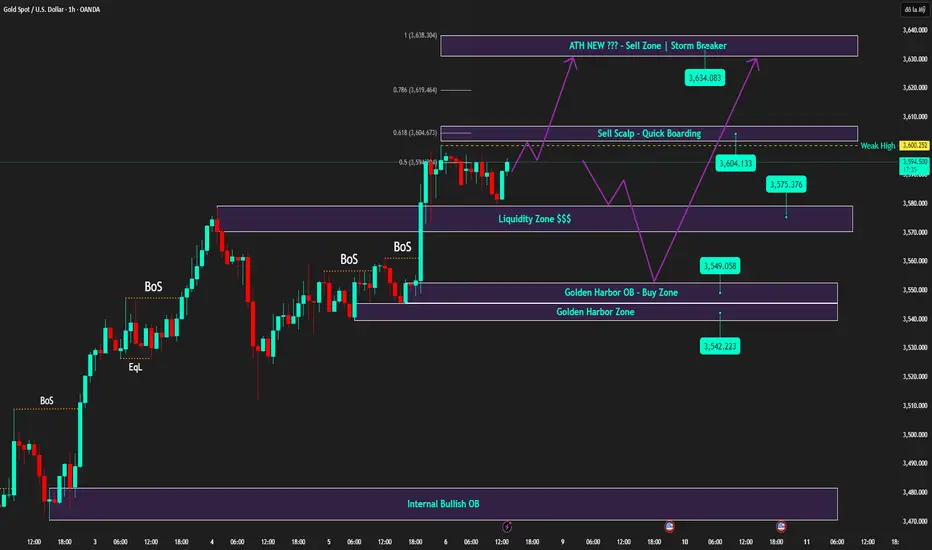
Captain Vincent | Observing JPY & USD - Buy remains dominant - 🟡 XAU/USD – GOLD 08/09
Observing JPY & USD | Buy remains dominant
🔎 Captain’s Log – News Context
This morning, no new major updates.
Tonight’s US session (08/09) will also not release any significant data.
The latest market impact came from Japanese PM S. Ishiba’s resignation , which pressured JPY lower and slightly lifted the Dollar.
However, Gold only made a small correction and held steady.
➡️ Captain’s Summary: Dollar and JPY now have only indirect influence, not enough to push Gold into deep declines. The main trend remains supported for further upside.
📈 Captain’s Chart – Technical Analysis
Captain’s Shield (Main Support) :
Golden Harbor OB: 3542 – 3549
Main Buy Zone: 3549 – 3551
Liquidity Dock: 3573 – 3575
Storm Breaker (Resistance) :
Quick Boarding: 3602 – 3604 (Short-term Sell scalp)
Storm Breaker Peak: 3632 – 3634 (Sell zone – potential new ATH)
⏩ Price structure still maintains a bullish trend (continuous BOS ). Corrections mainly serve to attract liquidity before breaking into higher resistance zones.
🎯 Captain’s Map – Trade Scenarios
✅ Golden Harbor (BUY – Priority)
Buy Zone: 3549 – 3551 | SL: 3542 | TP: 3553 → 3557 → 3560 → 3563 → 35xx
Liquidity Dock : 3573 – 3575 | SL: 3565 | TP: 3578 → 3581 → 3583 → 35xx
⚡ Quick Boarding (SELL Scalp – Short-term)
Entry: 3602 – 3604
SL: 3610
TP: 3600 → 3597 → 3594 → 3591 → 3588 → 35xx
🌊 Storm Breaker (SELL Zone – New ATH)
Entry: 3632 – 3634
SL: 3640
TP: 3629 → 3625 → 3623 → 3619 → 361x
⚓ Captain’s Note
“The Golden ship stays steady as the seas remain calm this morning, with no major news waves. Golden Harbor 🏝️ (3549 – 3551) along with OB around 3542 is a safe haven for sailors following the bullish tide. Liquidity Dock ⚓ (3573 – 3575) is only a temporary anchor point before bullish winds carry the ship further. Quick Boarding 🚤 (3602 – 3604) is for those seeking short-term waves. And if the ship reaches Storm Breaker 🌊 (3632 – 3634) , that could mark a new peak – but the greater journey is still northward with the bullish sails filled with wind.”
Bitcoin(BTC/USD) Daily Chart Analysis For Week of Sep 5, 2025Technical Analysis and Outlook:
During the trading session of the previous week, the Bitcoin market demonstrated a notable upswing, ultimately reaching our designated Mean Resistance level of 117000. Subsequently, the cryptocurrency experienced a retreat and is currently undergoing a consolidation phase.
The prevailing analysis indicates a firm probability of a continuation of the Intermediary Primary Rebound toward the Inner Coin Rally 115300, with the potential to extend its progression to the Mean Resistance level of 117000. However, it is essential to highlight that the Outer Coin Dip 102500 represents the primary ongoing trend and the overall direction of the market. Upon the completion of this phase, it is anticipated that Bitcoin will resume its bullish trajectory.
XAU/USD – FED, Tariffs & NFP Tonight | Captain Vincent 🔎 Captain’s Log – Context & News
The probability of the FED cutting rates in September has risen to 99.4% (from 96.6%) → almost a certainty.
FED’s Cook is under fraud investigation, combined with previously weak economic data → further strengthens momentum for Gold.
US–Japan deal: US reduces chip import tariffs to 15% , in return Japan invests $550B + purchases $8B worth of agricultural products. Positive, but not game-changing since markets remain focused on interest rates & inflation.
Trump: Threatens to impose tariffs on all chip/semis companies not entering the US → raises geopolitical concerns.
NFP & Unemployment Rate at 07:30 Us → key event, potential for very strong volatility.
⏩ Captain’s Summary:
Flows remain tilted toward BUY Gold thanks to FED rate cut expectations, but short-term whipsaws may occur before/after the news.
📈 Captain’s Chart – Technical Analysis
M30 BOS : Gold just created a Break of Structure, overall trend remains bullish.
Captain’s Shield (Support) : 3484 – 3486 (Main Buy Zone).
Storm Breaker (Resistance) : 3575 – 3593 (aligns with Fibo 0.5 – 0.618).
If Gold breaks above 3591 – 3593 → opens the path toward new ATH at 3608 – 3610 or higher.
If rejected at Storm Breaker → price may retest Golden Harbor (3484) before bouncing back upward.
🎯 Captain’s Map – Trade Scenarios
✅ Golden Harbor (BUY – Priority)
Entry: 3484 – 3486
SL: 3478
TP: 3490 → 3493 → 3497 → 3505 → 35xx
⚡ Quick Boarding (SELL Scalp – Short-term)
Entry: 3575 – 3577
SL: 3585
TP: 3570 → 3565 → 3560 → 3555 → 35xx
🌊 Storm Breaker (SELL Zone – Resistance)
Entry: 3591 – 3593
SL: 3600
TP: 3588 → 3585 → 3580 → 3575 → 35xx
⚓ Captain’s Note
“The Golden ship sails smoothly as the FED is almost certain to cut rates in September. Golden Harbor 🏝️ (3484) is the safe haven to continue riding the bullish wave. Storm Breaker 🌊 (3575–3593) may spark big waves for short Quick Boarding 🚤 , but the main current still carries us northward.”

Can the World's Most Critical Company Survive Its Own Success?Taiwan Semiconductor Manufacturing Company (TSMC) stands at an unprecedented crossroads, commanding 67.6% of the global foundry market while facing existential threats that could reshape the entire technology ecosystem. The company's financial performance remains robust, with Q2 2025 revenue reaching $30.07 billion and over 60% year-over-year net income growth. Yet, this dominance has paradoxically made it the world's most vulnerable single point of failure. TSMC produces 92% of the world's most advanced chips, creating a concentration risk where any disruption could trigger global economic catastrophe exceeding $1 trillion in losses.
The primary threat comes not from a direct Chinese invasion of Taiwan, but from Beijing's "anaconda strategy" of gradual economic and military coercion. This includes record-breaking military flights into Taiwan's airspace, practice blockades, and approximately 2.4 million daily cyberattacks on Taiwanese systems. Simultaneously, U.S. policies create contradictory pressures—while providing billions in CHIPS Act subsidies to encourage American expansion, the Trump administration has revoked export privileges for TSMC's Chinese operations, forcing costly reorganization and individual licensing requirements that could cripple the company's mainland facilities.
Beyond geopolitical risks, TSMC faces an invisible war in cyberspace, with over 19,000 employee credentials circulating on the dark web and sophisticated state-sponsored attacks targeting its intellectual property. The recent alleged leak of 2nm process technology highlights how China's export control restrictions have shifted the battleground from equipment access to talent and trade secret theft. TSMC's response includes an AI-driven dual-track IP protection system, which manages over 610,000 cataloged technologies and extends security frameworks to global suppliers.
TSMC is actively building resilience through a $165 billion global expansion strategy, establishing advanced fabs in Arizona, Japan, and Germany while maintaining its technological edge with superior yields on cutting-edge nodes. However, this de-risking strategy comes at a significant cost - Arizona operations will increase wafer costs by 10-20% due to higher labor expenses, and the company must navigate the strategic paradox of diversifying production while keeping its most advanced R&D concentrated in Taiwan. The analysis concludes that TSMC's future hinges not on current financial performance, but on successfully executing this complex balancing act between maintaining technological leadership and mitigating unprecedented geopolitical risks in an increasingly fragmented global order.

EUR/USD Daily Chart Analysis For Week of August 29, 2025Technical Analysis and Outlook:
In the most recent trading session, the Euro showed moderate upward movement. It initially declined to the Mean Support level of 1.160 before starting an effective upward trend. Current analyses indicate that the primary targets for the Euro are the Mean Resistance levels of 1.172 and 1.177, as well as the Key Resistance level of 1.181. Additionally, there is a long-sought-after target to be hit at the Outer Currency Rally target of 1.187. The ongoing price action may result in a notable pullback from these upward targets.

Bitcoin(BTC/USD) Daily Chart Analysis For Week of August 29 2025Technical Analysis and Outlook:
During the trading session of the previous week, the Bitcoin market underwent a significant pullback, surpassing the completed Outer Coin Dip at 112000, and is currently stabilized at the Mean Support level of 108000. The prevailing analysis indicates a substantial likelihood of a rebound for the cryptocurrency, with a target set at the critical Mean Resistance level of 112700. There is, however, a possibility of further extension towards the Mean Resistance level denoted as 117000. On the downside, Bitcoin may continue its descent to the final target of Outer Coin Dip 102500, navigating through Mean Support 105500 before ultimately resuming its bullish trajectory.
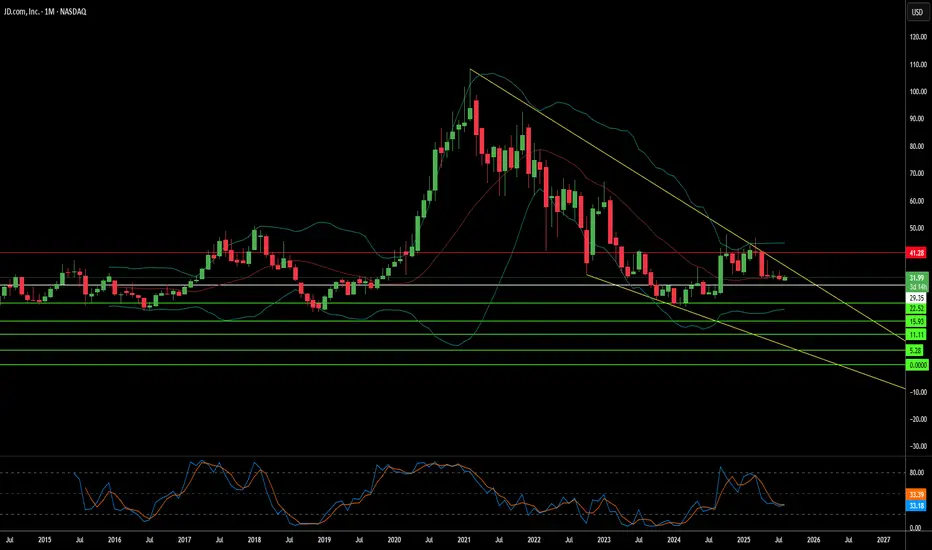
Can Strong Fundamentals Survive Geopolitical Storms?JD.com presents a compelling paradox in modern investing: a company demonstrating robust operational performance while its stock remains volatile due to factors entirely beyond its control. Despite market speculation about decline, JD.com has shown impressive financial resilience with consistent revenue growth—15.8% in Q1 2025 and 22.4% in Q2 2025 - alongside improving operating margins that reached 4.5% for JD Retail in Q2 2025. The company has strategically invested over RMB 75 billion in R&D since 2017, building a sophisticated logistics network spanning over 3,600 warehouses and developing cutting-edge technologies that have reduced fulfillment costs to a world-leading 6.5%.
However, JD.com's strong fundamentals exist within a challenging ecosystem of domestic and international pressures. China's deflationary environment, with CPI rising only 0.2% in 2024, has created subdued consumer demand, while intensifying competition from disruptors like Pinduoduo has reshaped the e-commerce landscape. Rather than engaging in destructive price wars, JD.com has pivoted toward sustainable profitability, leveraging its premium brand reputation and proprietary logistics network as key differentiators in an increasingly crowded market.
The most significant risk facing JD.com - and all US-listed Chinese companies- is geopolitical uncertainty rather than operational weakness. US-China trade tensions, regulatory crackdowns in both countries, and the specter of potential Taiwan conflict scenarios create unprecedented risks for investors. A hypothetical Taiwan invasion could trigger catastrophic sanctions, including SWIFT banking exclusions and forced delistings, potentially rendering these stocks worthless regardless of their underlying business strength. This analysis reveals that Bloomberg Economics estimates such a conflict would cost the global economy $10 trillion, with Chinese companies facing existential threats to their international operations.
The JD.com case study ultimately illustrates a new reality in global investing: traditional financial analysis focusing on revenue growth and operational efficiency may be insufficient when evaluating companies operating across geopolitical fault lines. While JD.com remains operationally strong with clear competitive advantages, investors must recognize they are essentially placing bets on US-China diplomatic stability rather than just corporate performance. This political risk premium fundamentally changes the investment equation.
EUR/USD Daily Chart Analysis For Week of August 22, 2025Technical Analysis and Outlook:
In the most recent trading session, the Euro exhibited considerable volatility, initially declining before embarking on a substantial upward trajectory. Current analyses suggest that the primary targets for the Euro are the Mean Resistance level of 1.177 and the Key Resistance level of 1.181, along with the Outer Currency Rally target of 1.187. The ongoing price action may lead to a consequential pullback to the Mean Support level of 1.166 before the resumption of the upward trend.
Bitcoin(BTC/USD) Daily Chart Analysis For Week of August 22 2025Technical Analysis and Outlook:
During the current trading session, the Bitcoin market has experienced a noteworthy pullback to the completed Outer Coin Dip at 112000, and as a result, has demonstrated considerable resilience, reaching the Mean Resistance (the inverse of Mean Support) at 116600 as detailed in the Daily Chart Analysis for the week of August 15. The prevailing analysis suggests that the cryptocurrency may revisit the Mean Support at 116500, as well as the completed Outer Coin Dip at 112000, before resuming its bullish trend.