Germany40 (GER40) – 30-Minute Timeframe Tradertilki AnalysisMy friends, greetings,
I have prepared a Germany40-GER40 analysis for you.
If GER40 reaches the levels of 25374.95-25339.21 on the 30-minute timeframe, I will open a buy position.
My target will be the 25513.48 level.
My friends, I share these analyses thanks to each like I receive from you. Your likes increase my motivation and encourage me to support you in this way.🙏✨
Thank you to all my friends who support me with their likes.❤️
Ger40

DAX40 Bullish breakout continuation supported at 25030The DAX remains in a bullish trend, with recent price action showing signs of a breakout within the broader uptrend.
Support Zone: 25030 – a key level from previous consolidation. Price is currently testing or approaching this level.
A bullish rebound from 25030 would confirm ongoing upside momentum, with potential targets at:
25524 – initial resistance
25770 – psychological and structural level
26000 – extended resistance on the longer-term chart
Bearish Scenario:
A confirmed break and daily close below 25030 would weaken the bullish outlook and suggest deeper downside risk toward:
24780 – minor support
24660 – stronger support and potential demand zone
Outlook:
Bullish bias remains intact while the DAX holds above 25030. A sustained break below this level could shift momentum to the downside in the short term.
This communication is for informational purposes only and should not be viewed as any form of recommendation as to a particular course of action or as investment advice. It is not intended as an offer or solicitation for the purchase or sale of any financial instrument or as an official confirmation of any transaction. Opinions, estimates and assumptions expressed herein are made as of the date of this communication and are subject to change without notice. This communication has been prepared based upon information, including market prices, data and other information, believed to be reliable; however, Trade Nation does not warrant its completeness or accuracy. All market prices and market data contained in or attached to this communication are indicative and subject to change without notice.

Dax - Short Term Buy IdeaH1 - Strong bullish momentum.
No opposite signs.
Until the two Fibonacci support zones hold I expect the price to move higher further.
If you enjoy this idea, don’t forget to LIKE 👍, FOLLOW ✅, SHARE 🙌, and COMMENT ✍! Drop your thoughts and charts below to keep the discussion going. Your support helps keep this content free and reach more people! 🚀
--------------------------------------------------------------------------------------------------------

DAX consolidation resistance at 25524The DAX remains in a bullish trend, with recent price action showing signs of a breakout within the broader uptrend.
Support Zone: 25030 – a key level from previous consolidation. Price is currently testing or approaching this level.
A bullish rebound from 25030 would confirm ongoing upside momentum, with potential targets at:
25524 – initial resistance
25770 – psychological and structural level
26000 – extended resistance on the longer-term chart
Bearish Scenario:
A confirmed break and daily close below 25030 would weaken the bullish outlook and suggest deeper downside risk toward:
24780 – minor support
24660 – stronger support and potential demand zone
Outlook:
Bullish bias remains intact while the DAX holds above 25030. A sustained break below this level could shift momentum to the downside in the short term.
This communication is for informational purposes only and should not be viewed as any form of recommendation as to a particular course of action or as investment advice. It is not intended as an offer or solicitation for the purchase or sale of any financial instrument or as an official confirmation of any transaction. Opinions, estimates and assumptions expressed herein are made as of the date of this communication and are subject to change without notice. This communication has been prepared based upon information, including market prices, data and other information, believed to be reliable; however, Trade Nation does not warrant its completeness or accuracy. All market prices and market data contained in or attached to this communication are indicative and subject to change without notice.

DAX - Up for nowCounting waves and assessing technical potential. Here’s what we see:
October 2020 - Completed the correction and started forming the 5th wave of the uptrend.
November 2025 - Making the final push, forming the last sub-wave 5 within the larger wave.
Key reversal level sits near 28,300 .
Note: this level coincides with the Fibonacci levels where the first wave ended in March 2000 .
Key targets:
Trend reversal expected at 28,300
Local correction at 26,900
Additional reversal points at 29,300 / 31,200
---
Please subscribe and leave a comment!
You’ll get new information faster than anyone else.
---

DAX30/GER30 - YOU DONE IT AGAINTeam, 12 hours ago we short the DAX at 25198 and our 1st target hit.
Again we have opportunity to short better price at 25227-25232 ranges
if it is heading toward 25245-60 ranges, we add for more short position and better volume
STOP LOSS at 25315
Target 1 at 25185-25167
Target 2 at 25140-25132
NOTE: FEBRUAY, I STILL expect the market will pull down toward 24800-24400
LETSO GO

DAX/GER - THEY DONE IT AGAINTeam, last two days I been able to make quite good profit on DAX,
yes, you need to understand where the market move and able to take on scalping trade,
Last two days, it has reached new high, but also give you room to short and take profit around 25000-25030
The price currently at 25198 and when the real market open, it could retest the old high at 25225-30. twice it reach that level resistance
Just encase it break out, it likely to heading toward 25250-60 ranges, and it will start to drop back toward 25085-50
So short now at this level 25198-25203 - STOP LOSS at 25315
We need to give room if the market goes against us toward 25250-25260 then I will short more heavier at this level.
Target 1 at 25167-25145
Target 2 at 25087-25050
NOTE: I STILL expect the market will pull down toward 24600-24400
Last 6 months ago, I was prove my trading $1000 turn into 100k in 6 months
I recently prove again $400, turn over 22k in 6 weeks, using scalping and swing trade.
All my trades post daily in my Community.
LETS GO

DAX entered its 7-month Resistance Zone. Will it decline again?DAX (DE40) just entered its 7-month Higher Highs Zone, which has been the technical Resistance of a long-term Ascending Triangle that started on the May 27 2025 High.
With the 1D RSI overbought (above 70.00), the conditions for a new medium-term sell opportunity have emerged. All previous five Bearish Legs of this Triangle have been fairly symmetrical, with the lowest being -5.07%.
We expect at least a repeat of that, which gives us a 24100 Target that may coincide with a 1D MA200 (orange trend-line) and 1W MA50 (red trend-line) test. The latter is the market's long-term Support and will decide the trend for 2026.
If the 1D RSI hits 40.00 though before the price hits 24100, we will take profit on the sell regardless, as that has been the RSI's Symmetrical Support for the entirety of the Ascending Triangle.
---
** Please LIKE 👍, FOLLOW ✅, SHARE 🙌 and COMMENT ✍ if you enjoy this idea! Also share your ideas and charts in the comments section below! This is best way to keep it relevant, support us, keep the content here free and allow the idea to reach as many people as possible. **
---
💸💸💸💸💸💸
👇 👇 👇 👇 👇 👇

DAX uptrend breakout supported at 24730The DAX remains in a bullish trend, with recent price action showing signs of a breakout within the broader uptrend.
Support Zone: 24730 – a key level from previous consolidation. Price is currently testing or approaching this level.
A bullish rebound from 24730 would confirm ongoing upside momentum, with potential targets at:
25150 – initial resistance
25300 – psychological and structural level
25400 – extended resistance on the longer-term chart
Bearish Scenario:
A confirmed break and daily close below 24730 would weaken the bullish outlook and suggest deeper downside risk toward:
24620 – minor support
24490 – stronger support and potential demand zone
Outlook:
Bullish bias remains intact while the DAX holds above 24730. A sustained break below this level could shift momentum to the downside in the short term.
This communication is for informational purposes only and should not be viewed as any form of recommendation as to a particular course of action or as investment advice. It is not intended as an offer or solicitation for the purchase or sale of any financial instrument or as an official confirmation of any transaction. Opinions, estimates and assumptions expressed herein are made as of the date of this communication and are subject to change without notice. This communication has been prepared based upon information, including market prices, data and other information, believed to be reliable; however, Trade Nation does not warrant its completeness or accuracy. All market prices and market data contained in or attached to this communication are indicative and subject to change without notice.

DAX Bullish breakout support at 24730The DAX remains in a bullish trend, with recent price action showing signs of a breakout within the broader uptrend.
Support Zone: 24730 – a key level from previous consolidation. Price is currently testing or approaching this level.
A bullish rebound from 24730 would confirm ongoing upside momentum, with potential targets at:
25000 – initial resistance
25150 – psychological and structural level
25300 – extended resistance on the longer-term chart
Bearish Scenario:
A confirmed break and daily close below 24730 would weaken the bullish outlook and suggest deeper downside risk toward:
24620 – minor support
24490 – stronger support and potential demand zone
Outlook:
Bullish bias remains intact while the DAX holds above 24730. A sustained break below this level could shift momentum to the downside in the short term.
This communication is for informational purposes only and should not be viewed as any form of recommendation as to a particular course of action or as investment advice. It is not intended as an offer or solicitation for the purchase or sale of any financial instrument or as an official confirmation of any transaction. Opinions, estimates and assumptions expressed herein are made as of the date of this communication and are subject to change without notice. This communication has been prepared based upon information, including market prices, data and other information, believed to be reliable; however, Trade Nation does not warrant its completeness or accuracy. All market prices and market data contained in or attached to this communication are indicative and subject to change without notice.

Bullish breakout?GER40 is falling towards the support level which is a pullback support and could bounce from this level to our take profit.
Entry: 24,502.39
Why we like it:
There is a pullback support level.
Stop loss: 24,236.74
Why we like it:
There is a pullback support level.
Take profit: 25,145.30
Why we like it:
There is a resistance level at the 78.6% Fibonacci projection.
Enjoying your TradingView experience? Review us!
Please be advised that the information presented on TradingView is provided to Vantage (‘Vantage Global Limited’, ‘we’) by a third-party provider (‘Everest Fortune Group’). Please be reminded that you are solely responsible for the trading decisions on your account. There is a very high degree of risk involved in trading. Any information and/or content is intended entirely for research, educational and informational purposes only and does not constitute investment or consultation advice or investment strategy. The information is not tailored to the investment needs of any specific person and therefore does not involve a consideration of any of the investment objectives, financial situation or needs of any viewer that may receive it. Kindly also note that past performance is not a reliable indicator of future results. Actual results may differ materially from those anticipated in forward-looking or past performance statements. We assume no liability as to the accuracy or completeness of any of the information and/or content provided herein and the Company cannot be held responsible for any omission, mistake nor for any loss or damage including without limitation to any loss of profit which may arise from reliance on any information supplied by Everest Fortune Group.

DAX40 resistance breakout supported at 24200The DAX remains in a bullish trend, with recent price action showing signs of a breakout within the broader uptrend.
Support Zone: 24200 – a key level from previous consolidation. Price is currently testing or approaching this level.
A bullish rebound from 24200 would confirm ongoing upside momentum, with potential targets at:
24640 – initial resistance
24775 – psychological and structural level
24943 – extended resistance on the longer-term chart
Bearish Scenario:
A confirmed break and daily close below 24200 would weaken the bullish outlook and suggest deeper downside risk toward:
24060 – minor support
23910 – stronger support and potential demand zone
Outlook:
Bullish bias remains intact while the DAX holds above 24200. A sustained break below this level could shift momentum to the downside in the short term.
This communication is for informational purposes only and should not be viewed as any form of recommendation as to a particular course of action or as investment advice. It is not intended as an offer or solicitation for the purchase or sale of any financial instrument or as an official confirmation of any transaction. Opinions, estimates and assumptions expressed herein are made as of the date of this communication and are subject to change without notice. This communication has been prepared based upon information, including market prices, data and other information, believed to be reliable; however, Trade Nation does not warrant its completeness or accuracy. All market prices and market data contained in or attached to this communication are indicative and subject to change without notice.

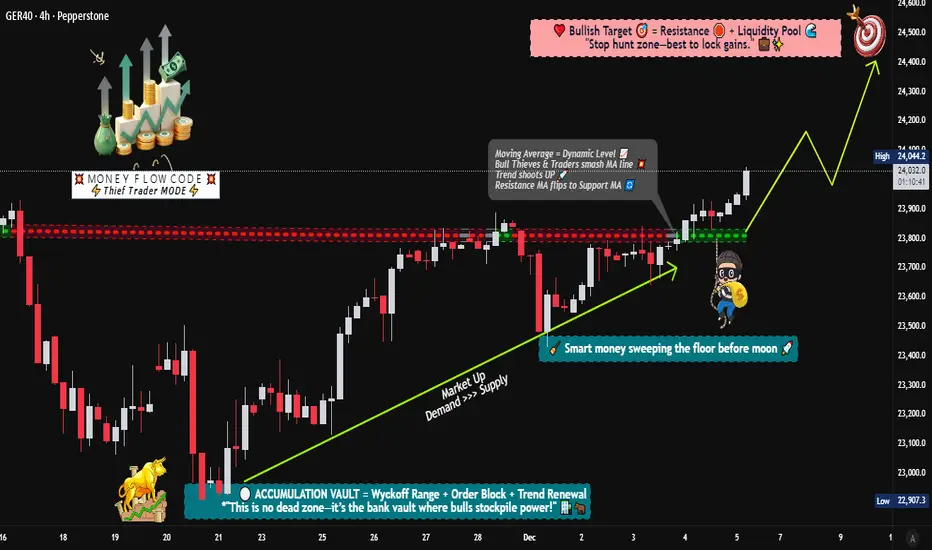
DAX40 Momentum Shift: Layered Buy Setup for Clean Profit Flow🚀 DAX40 (GER40) BULLISH BREAKOUT ALERT! | Layer Strategy for MAX Gains 🚀
📈 DAX40 BULLISH BREAKOUT CONFIRMED! 🏆 (Swing/Day Trade Setup with Layer Entry)
📊 Idea: Strong bullish momentum on the GER40 / DAX 40 following a decisive breakout above key moving averages! Perfect setup for a structured "thief-style" layered entry to capitalize on the trend.
🔑 KEY LEVELS & PLAN:
Trend: Bullish (MA Breakout Confirmation)
Entry Strategy: "Thief" Layer Method 🎯
Use multiple BUY LIMIT orders at key dips: 23,600 | 23,700 | 23,800 | 23,900 (Add more layers based on your capital).
This averages your entry and maximizes opportunity on pullbacks.
Stop Loss (SL): 23,400 (Thief OG's Zone ⚠️).
IMPORTANT NOTE: Adjust your SL based on YOUR risk tolerance & strategy! This is a guide, not financial advice. Protect your capital.
Take Profit (TP): Target Zone: 24,500 🎯
Strong resistance & potential overbought trap area. Secure profits wisely!
REMINDER: Manage your own TP. Take money at your own risk.
💎 PRO TRADER NOTES:
This "thief" layer strategy requires patience & discipline. Let the market come to your orders. Never risk more than 1-2% per layer. Trade with a plan, not emotion!
🌍 RELATED PAIRS TO WATCH (KEY CORRELATIONS):
FX:EURUSD : INVERSE Correlation. A stronger Euro can pressure DAX (export-heavy index). Watch for USD weakness supporting DAX rallies.
CAPITALCOM:US30 (Dow Jones) / SP:SPX (S&P 500): POSITIVE Correlation. US market strength often lifts European indices. Key for overall risk sentiment.
ICMARKETS:STOXX50 (Euro Stoxx 50): HIGH Correlation. Broader European index performance.
BUND Futures (/FGBL): INVERSE Correlation. Rising German bond yields (falling prices) can signal economic optimism, often supporting DAX.
EUR/GBP ( OANDA:EURGBP ): UK/EU economic relative strength flows.
👇 LIKE & FOLLOW if you found this useful!
💬 COMMENT your entry levels or chart insights below!
🔔 Click the BELL on my profile for real-time idea alerts!
#DAX #GER40 #TradingView #Breakout #Bullish #SwingTrading #DayTrading #LayerStrategy #TradingPlan #Forex #Indices #Investing #Stocks #ThiefStrategy #EURUSD
DAX Resistance overhead The DAX remains in a bullish trend, with recent price action showing signs of a breakout within the broader uptrend.
Support Zone: 23973 – a key level from previous consolidation. Price is currently testing or approaching this level.
A bullish rebound from 23973 would confirm ongoing upside momentum, with potential targets at:
24640 – initial resistance
24775 – psychological and structural level
24943 – extended resistance on the longer-term chart
Bearish Scenario:
A confirmed break and daily close below 23973 would weaken the bullish outlook and suggest deeper downside risk toward:
23860 – minor support
23760 – stronger support and potential demand zone
Outlook:
Bullish bias remains intact while the DAX holds above 23973. A sustained break below this level could shift momentum to the downside in the short term.
This communication is for informational purposes only and should not be viewed as any form of recommendation as to a particular course of action or as investment advice. It is not intended as an offer or solicitation for the purchase or sale of any financial instrument or as an official confirmation of any transaction. Opinions, estimates and assumptions expressed herein are made as of the date of this communication and are subject to change without notice. This communication has been prepared based upon information, including market prices, data and other information, believed to be reliable; however, Trade Nation does not warrant its completeness or accuracy. All market prices and market data contained in or attached to this communication are indicative and subject to change without notice.

DAX Short set-up in M15!Following a strong bullish move, the DAX shows short-term weakness on the M15 chart. Price is trading below a key intraday support zone, which may indicate a potential short scenario. A pullback toward the former support area around 24,240–24,250 can be observed as a possible reaction zone. If this area acts as resistance, a continuation toward the next support near 24,170 comes into focus.

GER40 Holds Key Fibonacci Support – Upside Continuation LikelyThe GER40 chart indicates that a larger A-B-C corrective structure has been completed at the recent low, marked as (C), after which the index began a fresh impulsive upward move. From that bottom, price has formed a clean five-wave advance, confirming the start of a new bullish cycle. The recent pullback appears to be a normal Wave 2 correction, which has respected the 0.5–0.618 Fibonacci support zone, a typical area where corrections end. This suggests the correction is likely complete and the market is preparing for Wave 3, which is usually the strongest and fastest upward wave. As long as price holds above the Wave 2 low, the bullish Elliott Wave structure remains valid. Overall, the setup favors continued upside toward higher highs in the coming sessions.
Stay tuned!
@Money_Dictators
Thank you :)

Germany 40 Bullish Bias | Buy the Dip Strategy📌 GER40 / DAX40 — Germany 40 Bullish Swing Trade Playbook
🇩🇪 ASSET OVERVIEW
📊 GER40 / DAX40 (Germany 40 Index)
🕰️ Trade Type: Swing Trade
💼 Market: European Equity Index CFD
🔍 The DAX40 represents Germany’s top 40 blue-chip companies, making it highly sensitive to:
🇪🇺 Eurozone economic sentiment
🏭 Industrial & export demand
🇺🇸 US equity market direction
🧠 MARKET STRUCTURE ANALYSIS
🟢 Overall Bias: BULLISH
📈 Why Bullish?
✅ Higher highs & higher lows intact
✅ Price holding above key dynamic support
✅ Buyers stepping in on every dip
📌 This confirms trend continuation, not reversal.
📉 TECHNICAL CONFIRMATION
📐 Indicator Used: HULL Moving Average (HMA)
🔑 Why HULL MA matters?
⚡ Faster than EMA & SMA
📊 Reduces lag during strong trends
🔁 Excellent for pullback entries
🟢 Current Condition:
✔️ Price has pulled back into the HULL MA
✔️ No structure break
✔️ Indicates healthy correction, not weakness
🎯 ENTRY STRATEGY (DETAILED)
📌 Entry Method: Any Price Level (Layering Allowed)
🧩 Thief Strategy – Layered Buy Orders
This strategy spreads risk and improves average entry.
🟢 Buy Limit Layers
🟩 23900
🟩 24000
🟩 24100
🟩 24200
📌 Why Layering Works?
🧠 Reduces emotional entries
📉 Handles volatility smoothly
📊 Improves risk-to-reward ratio
⚠️ You may add or reduce layers depending on capital size and risk rules.
🛑 STOP LOSS LOGIC
🔴 Reference Stop Loss: 23700
🧠 Why this level?
📉 Below recent swing structure
❌ Break below = bullish structure invalid
🛡️ Protects capital if trend fails
⚠️ Important Reminder
❗ This SL is not mandatory
❗ Adjust SL based on:
Account size
Risk percentage
Personal strategy
🏁 TARGET & EXIT ZONE
🎯 Primary Target: 24700
🚨 Why Take Profits Here?
🚓 “Police Force Zone” → Strong historical resistance
📊 Overbought conditions expected
High probability of bull trap / profit booking
📌 Smart traders exit into strength, not greed.
🔗 RELATED MARKETS & CORRELATION ($ WATCHLIST)
🇺🇸 US30 / Dow Jones
🔗 Strong Positive Correlation
Both driven by industrial & manufacturing sectors
Dow strength = confidence for DAX upside
🇺🇸 NAS100
⚡ Risk-On Indicator
Tech rallies improve global risk sentiment
Supports European indices indirectly
🇫🇷 FRA40
🌍 Regional Confirmation
Confirms broader Eurozone equity strength
Weak FRA40 = caution for DAX longs
💶 EUR/USD
💱 Inverse Sensitivity
📈 Strong EUR → pressure on German exporters
📉 Weak EUR → boosts DAX upside
📌 Always monitor EUR moves before major DAX pushes.
⚠️ RISK DISCLOSURE
❗ This idea is educational, not financial advice
❗ SL & TP are reference levels only
❗ You control your own risk & execution
👍 ENGAGEMENT CALL
💙 Like if this helps
💬 Comment your bias
⭐ Save for later
🔔 Follow for structured index setups

DAX Just confirmed the start of a very strong Bear Cycle.DAX (DE40) has been practically trading sideways since June 2025, a fair range on short-term time-frames but a tight one on long-term ones such as the 1M (monthly) that we are looking at today.
We posted this chart 2 months ago warning of a potential multi-year Top for the market's 16-year Channel Up (this time we view it on 1M instead on 1W) and only last month, it hit its 1W MA50 (blue trend-line) for the first time since the April low.
We don't need to mention again the specifics of this pattern's cyclical behavior, such as why Phase 3 seems to have already topped due to hitting the 1.618 and 2.236 Fibonacci extensions on two different measurements. Those where analyzed extensively on the previous publication.
But what we do want to bring to you is that the 1M RSI has been trading downwards since hitting its 80.00 Resistance, a level that was last tested in 2007! This is a clear Bearish Divergence on a wide scale and couple with the fact that the 1M MACD just completed a Bearish Cross, all the basic conditions for a Cycle Top have been met. As you can see, since the 2008 U.S. Housing Crisis, every 1M MACD Bearish Cross was formed on a market Top and signaled an aggressive correction.
As a result, we expect 2026 to be a Bear Cycle, and Phase 4 historically has corrected to at least the 0.382 Fibonacci retracement level, while also hitting the 1W MA200 (orange trend-line). Our 18800 long-term Target fulfills both conditions. Notice also that the 1M RSI has a 14-year Support trend-line as well at 39.00. If this gets hit, it is historically the most optimal signal to buy for the long-term regardless of the price the market will be at the moment.
---
** Please LIKE 👍, FOLLOW ✅, SHARE 🙌 and COMMENT ✍ if you enjoy this idea! Also share your ideas and charts in the comments section below! This is best way to keep it relevant, support us, keep the content here free and allow the idea to reach as many people as possible. **
---
💸💸💸💸💸💸
👇 👇 👇 👇 👇 👇

DAX corrective pullback support at 23870The DAX remains in a bullish trend, with recent price action showing signs of a breakout within the broader uptrend.
Support Zone: 23870 – a key level from previous consolidation. Price is currently testing or approaching this level.
A bullish rebound from 23870 would confirm ongoing upside momentum, with potential targets at:
24300 – initial resistance
24450 – psychological and structural level
24560 – extended resistance on the longer-term chart
Bearish Scenario:
A confirmed break and daily close below 23870 would weaken the bullish outlook and suggest deeper downside risk toward:
23712 – minor support
23600 – stronger support and potential demand zone
Outlook:
Bullish bias remains intact while the DAX holds above 23870. A sustained break below this level could shift momentum to the downside in the short term.
This communication is for informational purposes only and should not be viewed as any form of recommendation as to a particular course of action or as investment advice. It is not intended as an offer or solicitation for the purchase or sale of any financial instrument or as an official confirmation of any transaction. Opinions, estimates and assumptions expressed herein are made as of the date of this communication and are subject to change without notice. This communication has been prepared based upon information, including market prices, data and other information, believed to be reliable; however, Trade Nation does not warrant its completeness or accuracy. All market prices and market data contained in or attached to this communication are indicative and subject to change without notice.

DAX resistance retest at 24300The DAX remains in a bullish trend, with recent price action showing signs of a breakout within the broader uptrend.
Support Zone: 23870 – a key level from previous consolidation. Price is currently testing or approaching this level.
A bullish rebound from 23870 would confirm ongoing upside momentum, with potential targets at:
24300 – initial resistance
24450 – psychological and structural level
24560 – extended resistance on the longer-term chart
Bearish Scenario:
A confirmed break and daily close below 23870 would weaken the bullish outlook and suggest deeper downside risk toward:
23712 – minor support
23600 – stronger support and potential demand zone
Outlook:
Bullish bias remains intact while the DAX holds above 23870. A sustained break below this level could shift momentum to the downside in the short term.
This communication is for informational purposes only and should not be viewed as any form of recommendation as to a particular course of action or as investment advice. It is not intended as an offer or solicitation for the purchase or sale of any financial instrument or as an official confirmation of any transaction. Opinions, estimates and assumptions expressed herein are made as of the date of this communication and are subject to change without notice. This communication has been prepared based upon information, including market prices, data and other information, believed to be reliable; however, Trade Nation does not warrant its completeness or accuracy. All market prices and market data contained in or attached to this communication are indicative and subject to change without notice.

GER40 Pullback Is Not a Reversal (Here’s Why)GER40 did not react at the 0.7–0.8 retracement of the previous bearish leg, indicating underlying strength. Price has since formed equal highs (EQH), which now serve as a logical liquidity target for the next upside move.
I expect a brief manipulation or pullback early in the week, followed by bullish expansion toward the 24,500 area.
I’ll share updates as the setup develops — follow for further analysis.

Bearish Momentum Building on GER40 – Continuation or Trap?🦹♂️ GERMANY 40 (GER40) — Smart Money Flow Blueprint 💰 | Bearish Swing Setup
🧭 Market Context
Hey Thief OGs & market heroes 🧙♂️,
Welcome to another precision strike setup on the 🇩🇪 GERMANY 40 Index (GER40).
The price action has triggered a Triangular Moving Average (382) breakdown —
confirming a bearish money-flow shift below dynamic support.
Let’s decode the play 👇
📉 Trade Blueprint (Swing Trade Plan)
🧩 Structure: Bearish bias confirmed ✅
⚡ Trigger: TMA-382 breakout below dynamic support
🎯 Strategy: Layered Sell Limit Entries (Thief-style entry stacking)
💸 Entry Layers:
🧱 24 100 • 💀 24 050 • 🎯 24 000
(You can add more layers based on your own risk appetite)
🛑 Stop-Loss: 🔐 Thief’s SL @ 24 250
🎯 Take-Profit Target: 💰 23 700 → dynamic support + oversold trap zone
💡 Thief Strategy Notes
“Layer it like a pro, exit like a ghost 👻”
• Multiple sell-limit layers help you catch volatility with precision ⚙️
• TMA serves as a dynamic moving structure – not a static line.
• Breakdown of support = momentum shift confirmed 🔻
• Clear risk/reward logic – structured SL & TP = disciplined flow 🎯
• Bearish bias remains intact while price holds under 24 100
🔍 Correlation Radar & Related Pairs to Watch
Stay alert to cross-market clues 🧠
🔗 Correlation Asset Key Observation
🇺🇸 US30 (Dow Jones) Often mirrors GER40 momentum — if Dow dips, GER40 tends to follow.
🇬🇧 FTSE100 European equity sentiment confirmation — weakness = bearish confidence boost.
💶 EUR/USD Strong Euro = export pressure → GER40 downside bias continuation.
🧠 Why This Setup Makes Sense
• TMA 382 breakout = momentum confirmation 📉
• Dynamic support break = structure shift 🔄
• Layered entries = better average fill 🔂
• SL = clear risk • TP = logical oversold zone 🎯
• Cross-asset watchlist keeps you aligned with global money flow 🌍
⚠️ Risk & Personal Choice
Dear Ladies & Gentlemen (Thief OGs) —
I’m not recommending you copy my stop-loss or take-profit.
They’re purely my levels for analysis reference only.
Trade responsibly. You make the call, you take the bag or the gold 💼✨
🧾 Quick Recap
🦹♂️ Strategy: Multi-Sell-Limit Layering
📉 Bias: Bearish below 24 100
💣 Entries: 24 100 • 24 050 • 24 000
🛑 Stop: 24 250
🎯 Target: 23 700
🧭 Setup Type: TMA Breakout + Dynamic Support Breakdown
🌍 Correlation Focus: US30 • FTSE100 • EUR/USD
✨ “If you find value in my analysis, a 👍 and 🚀 boost is much appreciated — it helps me share more setups with the community!”
#GER40 #Germany40 #DAX #Indices #BearishSetup #SwingTrade #SmartMoney #LayeringStrategy #ThiefTrader #MarketFlow #TMA #PriceAction #TechnicalAnalysis #TradingView #ChartSetup #RiskManagement

GER30 H4 | Bearish Reversal?Momentum: Bullish
The price is reacting off the sell entry which aligns with the 145% Fibonacci extension, which adds significant strength to this level.
Sell entry: 24,125.22
Pullback resistance
145% Fibonacci extension
Stop loss: 24,479.29
Swing high resistance
Take profit: 23,684.50
Pullback support.
38.2% Fibonacci retracement.
High Risk Investment Warning
Stratos Markets Limited (tradu.com ), Stratos Europe Ltd (tradu.com ):
CFDs are complex instruments and come with a high risk of losing money rapidly due to leverage. 70% of retail investor accounts lose money when trading CFDs with this provider. You should consider whether you understand how CFDs work and whether you can afford to take the high risk of losing your money.
Stratos Global LLC (tradu.com ): Losses can exceed deposits.
Please be advised that the information presented on TradingView is provided to Tradu (‘Company’, ‘we’) by a third-party provider (‘TFA Global Pte Ltd’). Please be reminded that you are solely responsible for the trading decisions on your account. Any information and/or content is intended entirely for research, educational and informational purposes only and does not constitute investment or consultation advice or investment strategy. The information is not tailored to the investment needs of any specific person and therefore does not involve a consideration of any of the investment objectives, financial situation or needs of any viewer that may receive it. Past performance is not a reliable indicator of future results. Actual results may differ materially from those anticipated in forward-looking or past performance statements. We assume no liability as to the accuracy or completeness of any of the information and/or content provided herein and the Company cannot be held responsible for any omission, mistake nor for any loss or damage including without limitation to any loss of profit which may arise from reliance on any information supplied by TFA Global Pte Ltd.
