MU GEX - Potential Call Gamma Squeeze🔶 MU — Call Resistance at 400 Becomes the Decision Point 🔶
MU continued higher last week and tagged the 400 level , which now stands out as the largest call resistance on the board.
That level matters.
🔶 Structural Context 🔶
Price has reached a key call wall at 400 🟢
Momentum remains strong 🟢
Gamma dynamics are increasingly important here 🔵
In MU, the flow looks very similar to other momentum-driven tech names:
Retail positioned long calls
Dealers short calls , hedging via underlying buying
That creates a reflexive loop :
👉 strength forces dealers to buy more stock
👉 which can amplify upside if resistance breaks cleanly 🟢
🔶 Additional Context 🔶
Call pricing skew has expanded further 🟢
Calls are getting richer → sentiment remains bullish
Elevated skew also means expectations are crowded 🔵
🔶 What to Watch 🔶 💡
The 400 level is the inflection point .
Acceptance above 400 → opens the door for a call gamma squeeze 🟢
Rejection at 400 → likely leads to consolidation or pullback 🔴
As always, the tell is momentum + follow-through , not the level itself. MU is strong — but this is where structure decides whether the move accelerates or pauses.
Gexfortradingview

IREN - Pressure Building Near Call ResistanceIREN is quietly building pressure.
For five consecutive sessions, price has been compressing in a tight range, holding above HVL , which already tells us the gamma environment remains supportive . 🟢
🔶 Key Structure 🔶
Price holding above HVL 🟢
Tight daily range → volatility compression 🔵
Major call resistance at 60 🟢
This setup matters because of who is positioned where .
In names like IREN, the flow is typically:
Retail long calls
Dealers short calls, hedging by buying the underlying
That dynamic means any sustained move toward — or through — the 60 call resistance can trigger a gamma-driven acceleration , as dealers are forced to add delta on strength rather than fade it.
🔶 Options Sentiment 🔶
Call pricing skew ~82% 🟢
Calls are significantly richer than puts
Options market sentiment is clearly bullish but it doesn't meean it will go up immediately.
🔶 Bottom Line 🔶
IREN is coiling above HVL with heavy call skew. If price engages the 60 level with momentum, the structure is set up for a call gamma squeeze , not a slow grind.
This is a classic “pressure first, expansion later” setup — worth keeping on the radar.

SPX – GEX 6800 Put Support Holds🔶 SPX – 6800 Put Support Holds, Pricing Skew Mean-Reversion 🔶
On the daily chart, SPX found clean support at the 6800 put level , tied to the Jan 23 expiration . That level absorbed yesterday’s downside pressure, and price has been rotating higher since the bounce. 🟢
🔶 Options Structure 🔶
From an options structure perspective, the range is now clearly defined:
6800 acts as the primary put support 🔴
6915 marks the next call resistance on the weekly expiration 🟢
One of the most important signals comes from the Options Oscillator . Yesterday, put pricing skew reached a historically extreme level , indicating significant put overpricing relative to calls. Since then, we’ve seen a sharp mean-reversion in skew, suggesting that downside hedging pressure is easing.
That said, caution is still warranted . SPX remains below the High Volatility Level (HVL) , a regime where price action tends to be faster and more reactive, with elevated volatility. 🔵
If 6800 continues to hold , the next key test is the HVL zone around 6895 . A reclaim above HVL would shift the regime toward more controlled price behavior and opens the path toward 6915 call resistance as the next upside reference. 🟢
🔶 Key Levels to Watch 🔶
6800 – put support / downside anchor 🔴
6895 (HVL) – regime pivot 🔵
6915 – next call resistance (weekly) 🟢
As long as price holds above 6800 , the structure favors continued upside rotation , but sustained strength likely requires a reclaim above HVL . Failure to hold 6800 would quickly reintroduce downside volatility .

SPX – GEX Back to Positive🔶 SPX – HVL Reclaim & GEX Shift 🔶
SPX briefly traded below the High Volatility Level (HVL) yesterday, entering a 🔴 negative GEX regime , which increased downside sensitivity and intraday volatility. However, that breakdown failed to follow through.
Price has since reclaimed the HVL , and based on the 01/16 GEX profile , SPX is now back in 🟢 positive GEX territory , signaling a structural shift away from downside acceleration and back toward dealer-supported price behavior.
On the daily chart, this reclaim occurred directly off the rising trendline , which has defined the broader uptrend. The successful defense of this trend support suggests that the move below HVL was a temporary liquidity sweep rather than a regime change.
With HVL reclaimed and GEX flipping positive again, 🟢 upside flows regain control , and price becomes more responsive to call-side positioning rather than put hedging pressure.
🔶 Options Structure – Upside Reference 🔶
From an options structure perspective, the next major upside reference is the 7000 level , which represents:
a key call resistance zone
the dominant upside magnet in the current positive GEX environment
a natural extension target following the trendline bounce
🔶 Key Structure to Monitor 🔶
HVL – reclaimed, now acting as regime pivot 🟢
Rising trendline – trend integrity confirmed 🟢
Positive GEX (01/16) – supportive dealer positioning 🟢
7000 – primary upside target / call resistance 🟢
As long as SPX holds above HVL and the rising trendline , downside volatility should remain contained, and 🟢 rotation toward 7000 remains the higher-probability path. Failure to hold HVL would be the clearest signal that 🔴 negative GEX dynamics are reasserting.

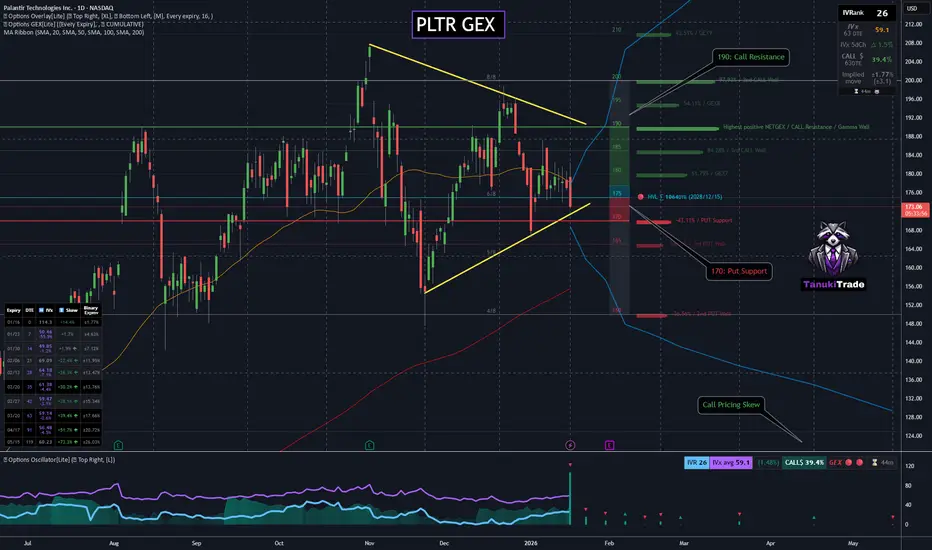
PLTR - GEX Compression Signals BreakoutPLTR has entered a tight volatility compression phase , both on price and in the GEX profile , which is now clearly squeezed between well-defined option levels. 🔵
🔶 Current Structure 🔶
Call resistance sits at 190
Put support is defined at 170
Price has been trading in a narrow range for over a week , confirming balance rather than trend 🔵
This type of GEX compression + price compression rarely persists for long, especially in a high-beta tech name like PLTR. Historically, these regimes resolve via sharp directional expansion , not slow grind.
From a regime perspective, PLTR is currently trading below the HVL , which keeps downside sensitivity elevated. A clean break below 170 would likely trigger 🔴 negative gamma dynamics , opening the door for accelerated downside.
🔶 Options Sentiment 🔶
Call pricing skew is elevated near 40% , signaling stronger call demand despite range-bound price 🟢
Implied volatility has been rising steadily over the past 5 sessions , confirming positioning ahead of a catalyst
Earnings are scheduled for 02/02 , adding fuel to an already compressed structure
🔶 Key Structure to Watch 🔶
170 – put support / downside trigger 🔴
190 – call resistance / upside breakout level 🟢
HVL – regime pivot 🔵
Compressed GEX profile – volatility expansion risk 🔵
With price, GEX, and volatility all compressing simultaneously, PLTR is setting up for a near-term breakout , with earnings acting as a potential catalyst. Direction will be determined by which side of the GEX range resolves first.
NVDA – Consolidation Breakout Toward 200 Core Resistance?🔶 Downside structure
Looking at NVDA on the daily chart, one level clearly stands out on the downside:
170 PUT support , where price has bounced multiple times in the past. This level has been well defended by put positioning, creating a solid structural floor. 🔴
🔶 Consolidation behavior
Over the past weeks, price spent a considerable amount of time sitting on the 50-day moving average , repeatedly testing it from below but failing to break through decisively. That dynamic now appears to be changing. NVDA is starting to push higher, suggesting a potential breakout from this consolidation range. 🟢
🔶 Upside reference level
If this breakout holds, the next key level to watch is 200 Call Resistance . This is currently the largest Call Resistance on the board, and it also aligns with an 8/8 MM level , adding technical confluence to the zone. 🟢
🔶 Options sentiment context
What’s important here is sentiment:
🔵 Call Pricing Skew is currently minimal, meaning the options market is not aggressively positioned for upside yet. This keeps the move cleaner and reduces the risk of an overcrowded bullish trade. In other words, this is not a euphoric call-heavy environment, which often allows price to travel further if momentum builds.
🔶 Scenario
🟢 If NVDA successfully breaks out of this consolidation and holds above the 50-day MA , a move toward the 200 Call Resistance becomes a very realistic upside target.
🔶 Key levels
🔴 PUT Support: 170
🔵 Trigger: Sustained breakout above the 50-day MA
🟢 Upside Target: 200 Call Resistance (8/8 MM)
Not financial advice — just a clean structure driven by price, positioning, and option market context.

Positive GEX Profile Points Toward 700 Gap FillMETA – Holding Above HVL, 50 DMA Reclaim in Progress, Upside Call Resistance at 700
META is currently trading below the 200-day moving average , but recent price action suggests a potential structural improvement rather than continued weakness.
From an options perspective, the broader structure remains Positive GEX , indicating that dealer positioning is still supportive on pullbacks. At the same time, IV remains low , which typically favors range expansion and directional follow-through once key technical levels are reclaimed.
On the daily chart, price is now starting to reclaim the 50-day moving average , a level that previously acted as dynamic resistance. Importantly, META is also holding above the High Volatility Level (HVL) , which keeps the short-term regime constructive rather than defensive.
Volatility conditions remain favorable:
Call Pricing Skew is elevated (~31.6%), showing persistent call demand
IV remains controlled, allowing price to move without immediate volatility compression pressure
Looking forward, the most important upside call resistance is the 700 level, which represents:
Highest core call resistance on the Feb 20 (Optimal Monthly) expiration
A major gap fill from the prior breakdown
A clear technical resistance zone visible on the daily chart
This confluence makes 700 a logical upside target if price can hold above HVL and fully reclaim the 50 DMA.
Key structure to watch:
200 DMA – higher timeframe resistance overhead
50 DMA – short-term trend reclaim in progress
HVL – holding above keeps structure constructive
700 – primary upside target (gap fill + core call resistance)
As long as price holds above HVL with supportive GEX structure, rotational upside toward 700 remains the higher-probability path .

PLTR GEX - Bull Flag Breakout SetupPLTR Technical & Options Setup Overview
PLTR is setting up a clean bull flag breakout on the daily chart, following a strong impulsive leg higher.
The consolidation has been holding above the 50-day moving average , which has acted as dynamic support throughout the flag structure. Two sessions ago price briefly dipped below the 50 SMA, but that weakness was immediately bought, signaling strong dip demand and structural acceptance above this level.
From an options perspective, the setup remains supportive. On the Feb 20 (Optimal Monthly) expiration, PLTR shows a Positive GEX Profile .
Volatility and skew conditions further strengthen the bullish case:
Core Call Pricing Skew is elevated (~36%), indicating persistent call demand
Implied volatility remains relatively low, leaving room for price expansion without volatility headwinds
Looking ahead, the next major reference is the 200 level , which represents the primary Core Resistance for the Optimal Monthly cycle. Given the compression within the bull flag and supportive options structure, 200 becomes a natural upside objective if the breakout confirms.
Structure to watch:
50 SMA – key trend support
Bull flag high – breakout trigger
Positive GEX – supportive dealer flow
200 – next major upside target (Core Resistance)
As long as price holds above the 50 DMA and volatility stays contained, risk remains skewed to the upside, with a measured breakout toward 200 favored.

Protective Put Support Zone & Gap FillAVGO – Breakdown Below HVL, Gap Fill Toward 320, Protective Put Support Zone
AVGO is trading in a high-volatility, momentum-driven downside phase , following a clean breakdown below the HVL. The move marks a clear regime shift, as price exited a tight transition zone and accelerated lower with conviction.
The downside was well signaled by sustained put-side pressure over multiple sessions, with price repeatedly rejecting from the 50 EMA . Once HVL failed, downside momentum expanded rapidly, consistent with a retail-driven move rather than a controlled dealer-defended range.
From an options structure perspective, protective put positioning now defines the next meaningful downside reference. Current positioning shows the next major protective put support clustered around 320 , which also aligns with a clean gap-fill level on the chart.
This makes 320 a dual-confluence area:
technical gap fill
protective put floor where dealer hedging dynamics may begin to dampen downside momentum
Until that zone is reached, price is effectively moving through thin structure, where volatility expansion and sharp intraday swings should be expected.
Key levels & structure:
Below HVL → bearish regime confirmed
50 EMA → repeated rejection, trend continuation signal
320 → primary downside target & potential stabilization zone (gap fill + protective puts)
Any stabilization or bounce attempts are more likely to occur only after interaction with the 320 area, not before.

GOOGL GEX & Bullish Decision Point at 320February 20 Expiration – GEX & Options Structure
Looking at the February 20 expiration, the options and GEX structure suggests that price is currently sitting at a critical decision zone .
Put side
The chart shows a clear put support level around 310 .
Price has briefly traded through this level, but there has been no strong downside continuation .
This keeps the scenario alive that 310 can still act as put support into this expiration.
Call side / Decision point
The next core resistance is located around 320 .
This level represents a bullish decision zone .
A clean break and acceptance above 320 could quickly shift dealer positioning.
Such a move would open the door for a potential gamma squeeze to the upside.
Technical context
Since summer, this is already the third similar bull flag structure on the daily chart.
The previous two structures resolved to the upside.
The current pattern has not yet confirmed a breakout.
This makes the 320 level especially important for technical confirmation.
Upside scenario
If price accepts above 320 , the next logical magnet becomes the next core resistance.
Based on daily structure and call wall positioning, this sits around 350 .
Volatility & Skew
Core pricing skew is currently around +25% , favoring calls.
Implied volatility has been compressing for several sessions .
This supports the idea that a directional expansion could follow once price resolves this range.
Summary
310 = key put support
320 = bullish decision point
Acceptance above 320 increases the probability of gamma-driven upside toward higher call resistance levels

$IWM — The Rate-Cut Leverage PlayLast week delivered one of those classic market paradoxes where everything that should be bearish suddenly became bullish:
layoffs → bullish
weak labor data → bullish
flat inflation → bullish
Why?
Because the market has now fully locked its focus on one thing only:
a Federal Reserve rate cut.
Volatility was sharp, price action even sharper, and the headlines kept flipping faster than most traders could adjust.
Let’s break down what actually happened — and what matters for the week ahead.
IWM GEX for 01/16/2025 expiration using TanukiTrade Options Overlay GRID System and the GEX Profile indicator
If the Fed cuts, small caps win the most — and last week proved it again.
IWM broke above the 250 call gamma level
Short-term gamma squeeze potential
Closed at new all-time highs
This is where rate-cut optimism expresses itself with maximum torque.
If the Fed turns dove on Wednesday → IWM can easily extend.

[06/16] Weekly GEX Roadmap - Diagonal Spreads or Put Hedges?📊 Weekly GEX Map (SPX)
This week’s GEX profile looks nearly identical to last week:
Positive bias above 6020 up to 6100
But a sticky chop zone remains from 5975 to 6020
Below 5950? That’s where things get interesting…
⚠️ What Happens If 5950 Fails?
In that case - welcome to negative gamma territory:
Delta becomes unstable → fast, erratic moves
Gamma loses influence → hedging effectiveness drops
Dealer hedging lags → market makers chase, not lead
Vega + theta distort readings → charm decay accelerates
Result:
GEX zones lose clarity.
Pinning breaks down.
Reactions become nonlinear and emotional.
If we drop below 5950, we might see acceleration instead of stabilization — despite the positive GEX profile.
💡 Trade Idea of the Week – With Caution
If not for Wednesday's macro risk (Fed rate decision), I'd suggest a bullish diagonal spread toward 6100–6150:
Limited downside
Defined risk
Covers the full squeeze zone
But with FOMC looming, I'd only hold this trade until Thursday and close once the debit doubles or earlier.
🧨 Macro + Geo Risks
Fed is priced for “no move” → any surprise = volatility spike
Rising tensions with Iran → oil and futures could react violently
Recommendation : Avoid OIL this week, especially futures and naked strategies
🛡️ Prefer Downside Protection?
If you expect weakness on SPX weekly:
Consider a put debit spread with the short leg at 5950, where the second strongest Put Support sits.
This type of structure can offer up to 6:1 reward-to-risk, making it one of the most efficient bearish hedges for this week.
If you enjoyed the above breakdown, feel free to check out my previous weekly analyses or explore my tools as well.
Until next time – Trade what you see, not what you hope,
– Greg @ TanukiTrade
