XAUUSD: at Key Resistance - Pullback Scenario in Focus To $5,400Hello everyone, here is my breakdown of the current XAUUSD setup.
Market Analysis
XAUUSD is trading within a broader bullish structure that previously developed inside a well-defined upward channel. After a prolonged consolidation phase marked by a clear range, price broke to the upside, confirmi
Gold Spot / U.S. Dollar
No trades
About Gold Spot / U.S. Dollar
Gold price is widely followed in financial markets around the world. Gold was the basis of economic capitalism for hundreds of years until the repeal of the Gold standard, which led to the expansion of a flat currency system in which paper money doesn't have an implied backing with any physical form of monetization. AU is the code for Gold on the Periodic table of elements, and the price above is Gold quoted in US Dollars, which is the common yardstick for measuring the value of Gold across the world.

XAUUSDHello Traders! 👋
What are your thoughts on Gold?
After a strong and uninterrupted rally, Gold reached the upper boundary of the ascending channel and faced a sharp rejection, triggering a deep corrective move. Considering the extended bullish move over recent weeks without any meaningful pullback,

Gold 30-Min — Volume Buy & Sell Reversal Triggered⚡Base : Hanzo Trading Alpha Algorithm
The algorithm calculates volatility displacement vs liquidity recovery, identifying where probability meets imbalance.
It trades only where precision, volume, and manipulation intersect —only logic.
✈️ Technical Reasons
/ Direction — LONG / Reversal 4355 Area

Hellena | GOLD (4H): LONG to resistance 5200.Since the movement continues and clearly shows no signs of reversing, I had to slightly revise the wave count, and it looks as if the impulse has been extended.
This means that the higher-order wave “3” has just ended or will end soon.
This means that wave “5” is not over yet and we should expect a

Gold Tests 4400 as Bullish Scenario EmergesGold Tests 4400 as Bullish Scenario Emerges
After taking into account all the confusion created by GOLD on our previous analysis, the chances are that gold may rise from the current zone.
Gold has already tested a very strong support zone dating back to mid-October 2025. It looks like the price h

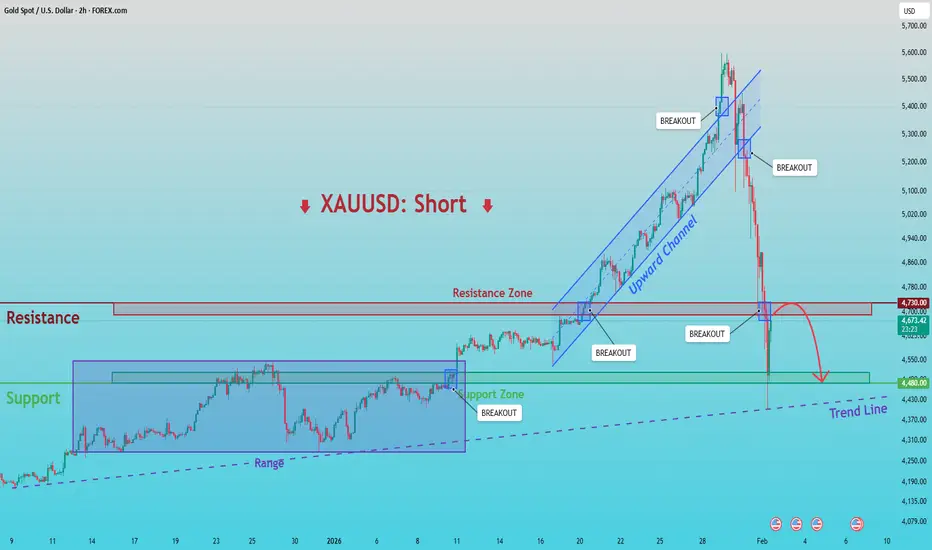
XAUUSD: Below 4,730 Resistance - Targeting 4,480 SupportHello everyone, here is my breakdown of the current XAUUSD setup.
Market Analysis
XAUUSD was previously trading within a clearly defined upward channel, where price respected both the rising support and resistance boundaries, forming a sequence of higher highs and higher lows. This structure conf
Gold Price Analysis – Key Resistance, Support Levels, and PotentThis chart provides an in-depth analysis of gold prices, highlighting critical resistance and support zones. The Sell Zone at 5,438.172 represents a key resistance level where price may face rejection, offering a potential sell opportunity if the level holds. The Support Zone at 4,933.394 is expecte

Gold Weekly Levels: Bears will target 4600 USD → Sell Rips🔱 GOLD WEEKLY SNAPSHOT — EXECUTIVE SUMMARY
🧨 Bears remain in control as sell-side pressure accelerates after the dump and ETF liquidations
🔻 Key sell zone: 5300 bearish FVG and the 5200 to 5300 lower timeframe FVG cluster where rips are for selling
🎯 Primary downside magnets: fresh buy-side liquid

Gold Reclaims Support After Sharp Drop - 5,100 Resistance as TP1Hello traders! Here’s my technical outlook on XAUUSD (4H) based on the current chart structure. Gold initially traded within a clearly defined range, where price moved sideways, signaling a period of consolidation and market balance before the next impulsive move. From this range, XAUUSD broke to th

Gold Price Analysis – Key Reversal Zones and Support LevelsThis chart provides an intraday analysis of gold prices, focusing on key resistance and support zones. The price is currently testing crucial levels: Trendline Resistance at 5,525.961, with a potential for reversal if it faces rejection. Resistance Zone is identified as a major reversal area. The Su

See all ideas
Summarizing what the indicators are suggesting.
Oscillators
Neutral
SellBuy
Strong sellStrong buy
Strong sellSellNeutralBuyStrong buy
Oscillators
Neutral
SellBuy
Strong sellStrong buy
Strong sellSellNeutralBuyStrong buy
Summary
Neutral
SellBuy
Strong sellStrong buy
Strong sellSellNeutralBuyStrong buy
Summary
Neutral
SellBuy
Strong sellStrong buy
Strong sellSellNeutralBuyStrong buy
Summary
Neutral
SellBuy
Strong sellStrong buy
Strong sellSellNeutralBuyStrong buy
Moving Averages
Neutral
SellBuy
Strong sellStrong buy
Strong sellSellNeutralBuyStrong buy
Moving Averages
Neutral
SellBuy
Strong sellStrong buy
Strong sellSellNeutralBuyStrong buy
Displays a symbol's price movements over previous years to identify recurring trends.