GOLD Bearish Bias!
HI,Traders !
#GOLD made a bearish
Breakout of the key
Horizontal level of 4189.93
Which is now a resistance
AndAfter retesting that area we
will be expecting
A further move down !
Comment and subscribe to help us grow !
Gold

Gold’s Correction Is Exhausting SellersGold is not collapsing. It is cleansing. After an explosive rally that pushed XAUUSD above 4380, the metal has undergone a sharp but orderly retreat to the 3940 zone. This pullback has flushed out weak hands and reset overbought conditions without breaking the core structure of the uptrend. The data across timeframes confirms that buyers are regrouping, not retreating.
On the daily chart, price has found support near the 20-period SMA at 4069, but more importantly, it has held well above the 50-day SMA near 3780. This wide cushion shows the underlying trend remains intact. The RSI has fallen from extreme highs above 90 to neutral territory near 35, eliminating the overbought pressure that threatened a deeper correction. The MACD histogram has turned deeply negative, but this reflects momentum exhaustion, not bearish conviction. Volume has declined on the down moves, signaling lack of aggressive selling.
The 4-hour chart reveals a critical detail. Price recently tested 3886, the low of the last major swing, and bounced sharply. This level now acts as strong technical support. The RSI on this timeframe has bottomed near 18 and is curling upward, while the MACD histogram has flipped positive for the first time in days. These are early signs of accumulation. The current price hovering around 3940 is not a sign of weakness but a consolidation phase where the market digests the prior move.
Weekly structure remains overwhelmingly bullish. Despite the recent drop, the close above 3886 in the prior week preserved the higher low pattern that began in early 2024. The 10-week SMA continues to rise steadily, now near 3776, and price remains well above it. Even the monthly chart shows no reversal signal. The latest monthly candle closed at 3858, still deep within the upper half of its Bollinger Band, and the OBV remains in an uptrend, confirming volume-backed strength.
This setup points to a resumption of the primary uptrend. Short term, gold will likely reclaim 4025 within the next 5 to 10 days as the 4-hour MACD crossover gains traction. Medium term, a retest of 4250 is probable within 4 to 8 weeks, targeting the previous consolidation zone that now acts as support-turned-resistance. Long term, with all major moving averages sloping upward and no structural damage done, gold is on track to challenge 4500 by the end of the first quarter of 2026.
The current dip is a tactical opportunity, not a strategic warning. The trend remains firmly in gold’s favor.

XAU/USD | Gold Setup Before FOMC – Big Move Coming Soon!By analyzing the Gold (XAUUSD) chart on the 2-hour timeframe, we can see that after the previous analysis, gold rose to $3,970 before facing heavy selling pressure that pushed it down to $3,908. Once price entered this demand zone, buyers stepped in again, driving gold back above $4,000.
As we marked on the chart, the $4,015–$4,050 range is a key supply zone, and today the price climbed to $4,030 before pulling back again. Gold is currently trading around $4,005, and if it holds below $4,014, we can expect a deeper decline.
Alternatively, if price breaks above $4,030, gold could aim for higher targets near $4,055 and beyond.
Keep in mind that tonight’s FOMC meeting could bring strong volatility — a rate cut of 25 basis points (to 4%) may cause short-term fluctuations, but a larger cut could trigger a sharp gold rally.
Stay cautious with your trades — I’ll update you after the FOMC results. Happy trading, guys! 💛
THE LATEST ANALYSIS :
Please support me with your likes and comments to motivate me to share more analysis with you and share your opinion about the possible trend of this chart with me !
Best Regards , Arman Shaban

Watch for support at 3990-3980 to consider going long on gold.#XAUUSD TVC:GOLD OANDA:XAUUSD
Gold prices have repeatedly tested the 4030 level without a successful breakout. Gold has now begun to decline, with short-term bears gradually releasing their momentum. Further downside is expected, with support expected in the 3990-3980 range. If gold prices can pull back to this range in the short term, we can consider going long on gold in anticipation of a rebound. Target range: 4030-4050

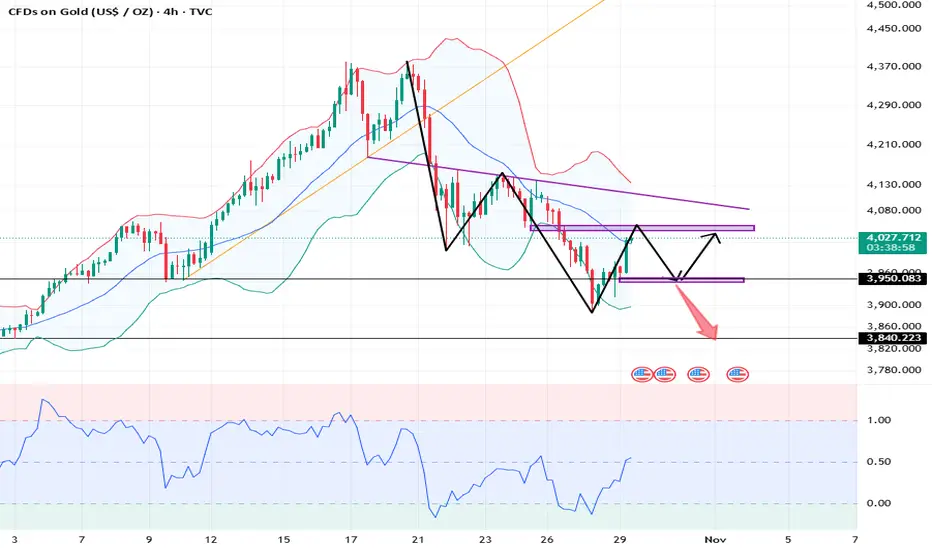
Gold Daily | The Pause That Defines the BullGold Daily – Support Holds, But the System Still Says Wait
Gold has now completed what looks like a classic 10 percent pullback inside a secular bull market: a move that tests conviction, not trend.
Price found support exactly at the green line, a level that has defined structure since late summer.
From a system perspective, however, the setup remains bearish for now.
MLR < SMA < Price < BB Center, and PSAR still above price, confirming that momentum hasn’t flipped yet.
The interesting part is how this technical pause meets the macro turning point.
The Fed just announced another rate cut, lowering rates by 25 bps and signaling more easing ahead. Historically, rate cuts have had a dual effect on gold.
In early cycles, they boost risk appetite, sometimes pulling capital into equities first.
Later, when easing becomes structural, gold reclaims dominance as real yields compress.
That’s why this zone matters.
Gold is sitting right where both technical exhaustion and monetary easing collide.
A bounce here would fit the larger bull narrative, a rotation from short-term fear back to long-term trust hedging.
A breakdown, on the other hand, would tell us the market’s still digesting the new policy shift.
Either way, this is a recalibration phase, not a top.
Pullbacks like this are the pauses that let bull markets breathe.
Bias Neutral-to-bullish, support confirmed, structure lagging, macro tailwinds building.
Always take profits and manage risk.
Interaction is welcome.

( Gold Protocol ) Bullish & Bearish Reversal DetectedStatus: Active Reversal Protocol
Symbol: Gold
Session: London–New York Overlap (Smart Exit Window)
Bullish Reversal Zone : 3980 : 3962
Bearish Reversal Zone : 4055 : 4070
Bias: Bullish & bearish Reversal
☄️ Volume Surge Confirmed — Sellers dominate exhausted highs
☄️ Session Aligned — Smart money exit window open
☄️ Cluster Shield Active — Supply imbalance verified
☄️ Delta Shift Negative — Buyers trapped above
☄️ POC Retest Completed — Liquidity absorbed at resistance
☄️ Structure Break Pending — Bearish bias confirmed
Goal: Controlled with minimal drawdown
Tactical Edge: Reversal Protocol through liquidity engineering
Confidence Level: ★★★★★ (Smart Money Aligned)
⤵️Every like & comment on our TradingView posts helps us grow. More engagement means more exposure, which benefits everyone in the community!

Second Gold Short AttemptGold has broken out of its wedge pattern and is now forming either a flag or a trend channel. My second attempt today will use a tighter stop level. It’s a risky setup but offers a high risk-reward ratio. I haven’t yet decided whether to take profit at the lower trendline or hold the position to the original target.

Gold (XAUUSD): possible buy setupGold (XAUUSD): possible buy setup. I think everything is clear on my chart. Wait for a good breakout, wait for a pullback with rapid reversal (engulf, v shape, etc.).
Cheers


Gold – FOMC Rate Cut: The Catalyst for the Next Major Rally?Gold is positioned for a potential major rally as all macroeconomic indicators align in its favor. The Federal Open Market Committee (FOMC) is set to announce a expected a 25 bps rate cut, already 99% priced in by the market. This dovish pivot — driven by slowing growth and cooling inflation — will reduce real yields, pressure the USD, and reignite bullish momentum in gold.
Despite recent risk-on sentiment and a ~10% correction from its highs, the primary driver for gold now shifts to monetary policy. The forward guidance from Fed Chair Jerome Powell will determine whether this becomes the start of a new leg up? or not!.
📈 The macro backdrop is overwhelmingly bullish for gold. A confirmed dovish shift by the Fed will likely push XAU/USD back above $4,150+/oz, marking the next impulsive wave.
1️⃣ FOMC Policy Outlook
The Fed’s decision today carries immense weight for global markets.
Expected Action: 25 bps rate cut
New Target Range: 3.75% – 4.00%
Market-Implied Probability: ~99%
🔹 Impact on Gold (XAU/USD)
Lower rates reduce the opportunity cost of holding gold. When real yields decline, investors rotate capital toward non-yielding assets that preserve value — like gold.
Dovish Cut (25 bps + Future Easing Signals): This is bearish for the USD (DXY), leading to a strongly bullish reaction in gold 🚀.
Hawkish Cut (Cautious Tone): This is neutral-to-bullish for the USD (DXY), causing a bearish reaction in gold 😕.
Aggressive Cut (50 bps): This is strongly bearish for the USD (DXY), and it leads to an extremely bullish reaction in gold 💥.
Fed’s need to support growth amid cooling inflation, the “dovish cut” scenario remains the base case — which strongly favors gold upside.
2️⃣ Macroeconomic Drivers
💵 US Dollar (DXY)
The USD Index (DXY) remains structurally weak, trading near 98.8–98.9 after a year-to-date decline of nearly 13% — its steepest fall in five decades.
A weaker dollar makes gold more affordable to foreign investors, increasing global demand.
➡️ With the Fed set to ease further, any short-term rebound in DXY will likely be temporary, reinforcing the long-term bullish outlook for gold.
📊 Inflation Dynamics
CPI (YoY): 3.0% — lower than expected
Core CPI (YoY): 3.0% — also cooling
PPI Outlook (Next Month Pending)
This disinflationary trend gives the Fed room to cut rates without fear of runaway inflation, pushing real yields lower — a key bullish driver for gold.
Even with inflation above the 2% target, the cooling trend validates the Fed’s pivot toward accommodation, which historically aligns with gold rallies.
🌏 Market Sentiment
Recent US–China trade optimism fueled a “risk-on” phase, lifting equities and temporarily pressuring gold.
However, this narrative is largely priced in, creating a value re-entry point for gold bulls.
Meanwhile, long-term structural demand = central bank accumulation, sovereign diversification, and geopolitical hedging = continues to support the metal.
3️⃣ Forecast & Outlook
The tug-of-war between short-term sentiment and monetary fundamentals is ending.
The Fed’s pivot toward easing will be the dominant catalyst going forward.
Bullish Catalysts:
✅ 99% probability of a rate cut
✅ Dovish tone expected from Powell
✅ USD weakness trend intact
✅ Cooling inflation data supports easing
Bearish Factors (Minor):
Short-term risk-on sentiment
Temporary DXY bounce
📈 Final View:
The risk-reward heavily favors the bullish side.
Gold’s pullback is an opportunity — not a reversal.
With monetary easing confirmed, XAU/USD could break above $4100/$4200 oz and extend toward new record highs in the coming weeks.

GOLD (XAUUSD): Short Trade Before the FED
I see an intraday pullback trade on Gold ahead of
FOMC & FED Interest Rate Decision today.
The price will likely retrace from the underlined resistance,
following a confirmed bearish imbalance and a formation
of a double top pattern.
Expect a bearish movement at least to 3988 level.
❤️Please, support my work with like, thank you!❤️
I am part of Trade Nation's Influencer program and receive a monthly fee for using their TradingView charts in my analysis.

Xauusd🔍 Current Situation (Oct 29, 2025, 09:00)
H4 and H2 remain in a bearish structural trend (BOS to the downside, forming lower lows).
However, M15–H1 are currently in a corrective upward impulse, which hasn’t been broken yet.
This means it’s too early to open new short positions — the market is likely moving higher to collect new liquidity before turning back down.

Gold Bullish Butterfly Forming – Reversal Ahead?As I expected in the previous idea , Gold started declining from the Resistance zone($4,192 – $4,137) and has now reached the Support zone($4,004 – $3,895) — full target achieved .
At the moment, Gold is moving within that Support zone($4,004 – $3,895) and Potential Reversal Zone(PRZ) .
Looking at the 1-hour time frame , we can spot a Bullish Butterfly Harmonic Pattern forming, which is likely to complete right in that PRZ .
I expect that in the coming hours, once Gold enters the PRZ , it could rise at least up to around $4,057(First Target) .
Second Target: $4,132
Stop Loss(SL): $3,889(Worst)
Please respect each other's ideas and express them politely if you agree or disagree.
Gold Analyze (XAUUSD), 1-hour time frame.
Be sure to follow the updated ideas.
Do not forget to put a Stop loss for your positions (For every position you want to open).
Please follow your strategy; this is just my idea, and I will gladly see your ideas in this post.
Please do not forget the ✅ ' like ' ✅ button 🙏😊 & Share it with your friends; thanks, and Trade safe.

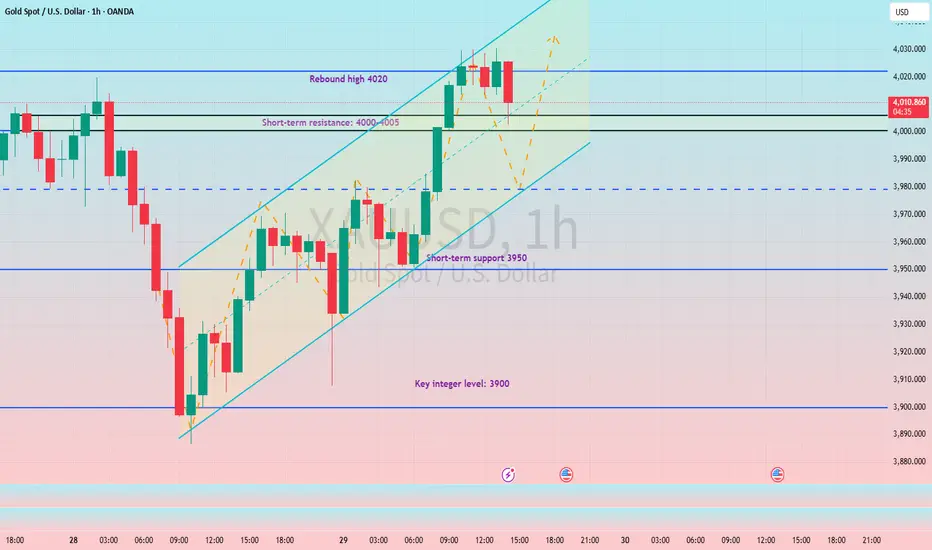
GOLD | Rebounds Above $4,000 Ahead of Fed DecisionGOLD – MARKET OVERVIEW | Rebounds Above $4,000 Ahead of Fed Decision 🪙
Gold futures climbed back above $4,000, rebounding in early trade ahead of the Federal Reserve’s rate decision later today.
The metal gained around 1%, supported by expectations that the Fed will cut rates by 25 basis points, a move that typically boosts demand for non-yielding assets like gold.
Markets have already priced in the rate cut, leaving investors focused on Chair Powell’s comments for clues on whether another cut could follow in December.
Technical Outlook
Gold remains in a bullish momentum as long as the price trades above 4,011, targeting 4,053 initially.
A 1H or 15Min close above 4,053 would confirm further upside toward 4,104.
However, if the price reverses and stabilizes below 3,982, it would shift the bias to bearish, opening the way toward 3,930 → 3,893.
Key Technical Levels
Pivot Zone: 4,011 – 4,016
Resistance: 4,053 · 4,104 · 4,148
Support: 3,982 · 3,930 · 3,893
Outlook:
Gold stays bullish while above 4,011, with potential to extend gains toward 4,104 if the Fed delivers a dovish tone.
But if Powell’s remarks turn unexpectedly hawkish and price stabilizes below 3,982, a deeper pullback toward 3,930–3,893 could follow.

xauusd 3894 or 4060 today?October 29, 2025, XAU/USD has specific price targets. The gold price is currently around $4,018, and traders are focusing on key technical levels and the upcoming Federal Reserve interest rate decision.
Below is a summary of the key price levels to watch before the market closes today.
Analysis Type Key Resistance Key Support Primary Target Alternative Target
Technical & Scenario-Based $4,005.79 $3,951.68 $4,059.90 - $4,114.01 (if resistance breaks) $3,893.96 (if support breaks)
Bearish Correction - $3,940 $3,870 -
Range-Bound $4,010 $3,860 Movement between $3,860 and $4,010 -
🚨 Key Market Driver Today
The single most important event influencing gold's movement today is the Federal Reserve's interest rate decision. Markets are overwhelmingly expecting a 25-basis-point rate cut, and how the market reacts will depend heavily on the tone (dovish or hawkish) set by Fed Chair Jerome Powell.
Dovish Signal (Bullish for Gold): If the Fed signals openness to further easing, it could weaken the US Dollar and help push gold above the $4,005 resistance toward the higher targets.
Hawkish Signal (Bearish for Gold): If the Fed suggests this cut is a "one-and-done" move, it could strengthen the Dollar and trigger a sell-off in gold, pushing it down to test the $3,951 support and potentially lower.
💡 A Note for Your Trading
Conflicting Signals Exist: While one technical model suggests a potential rise to $4,010, another maintains a bearish outlook with a target of $3,870, contingent on the price staying below $3,940. This highlights the market's uncertainty ahead of the Fed news.
Trade the Reaction: Many analysts advise waiting for the price to convincingly break through one of the key levels ($4,005 resistance or $3,951 support) before committing to a new trade direction, rather than anticipating the move prematurely.
In summary, for the remainder of today's session, watch the $4,005 resistance and $3,951 support levels. The Fed's announcement will likely determine whether the price moves towards $4,060 or falls back to $3,894.

Gold’s New Game — Higher Highs Again!In my view, gold has completed its correction from the previous rally and is now preparing to renew its all-time high.
On the chart, I’ve marked a 5-wave structure, which I believe represents the first wave of a much larger 5-wave sequence.
This suggests we could see gold far above $4600.
Honestly, I can’t even imagine how high it could go — or what might drive that kind of move.
It’s insane.

XAUUSD Short: Selling the Bounce Within the Descending ChannelHello, traders! The price action for Gold (XAUUSD) has been dominated by a bearish structure since the breakout below the ascending channel and rejection from the SUPPLY ZONE 2 near 4250. This move initiated a clear downtrend, forming a descending channel that has guided the market lower through a sequence of impulsive declines and short corrective rebounds.
Currently, the price is testing the Demand Line of this descending channel, located just above the Demand Zone around 3867. This zone represents a key area of potential buying interest that previously acted as a reaction point during earlier phases of the uptrend. In my view, the market is now entering a critical stage. A temporary corrective rally towards the upper boundary of the channel (near the Supply Zone 1 at 3950–4100) is likely before sellers may step in again to resume the broader downtrend.
My scenario anticipates that this corrective bounce will be limited, with sellers defending the Supply Zone 1, leading to another move downward toward the Demand Zone and potentially lower levels. A confirmed reversal signal in this area, however, could offer a long opportunity for a larger bullish impulse later on. Manage your risk!

GOLD SELLERS WILL DOMINATE THE MARKET|SHORT
GOLD SIGNAL
Trade Direction: short
Entry Level: 4,027.15
Target Level: 3,890.12
Stop Loss: 4,118.76
RISK PROFILE
Risk level: medium
Suggested risk: 1%
Timeframe: 2h
Disclosure: I am part of Trade Nation's Influencer program and receive a monthly fee for using their TradingView charts in my analysis.
✅LIKE AND COMMENT MY IDEAS✅

XAUUSD: Market Analysis and Strategy for October 29Gold Technical Analysis:
Daily chart resistance: 4090, support: 3840.
4-hour chart resistance: 4050, support: 3950.
1-hour chart resistance: 4050, support: 3980.
Today, the European session saw an accelerated rebound, breaking through $4000. The focus is on whether it can hold. If the price can stabilize above $4000 after the Fed's rate cut and Powell's speech, it will inevitably attract previous buying interest, solidifying the long-term upward trend. Conversely, if the price falls below $4000, it can be basically determined that a short-term top has formed. At that time, greater selling pressure will continue to amplify the decline until market risk sentiment shifts.
Based on the 1-hour chart, the price faces resistance around 4050, and the battle around the 4000 level remains crucial. Support is seen around 3980.
Trading Plan:
SELL: 4050 near
BUY: 3980 near
BUY: 3955 near
If you choose to trade, please avoid times when news releases occur.
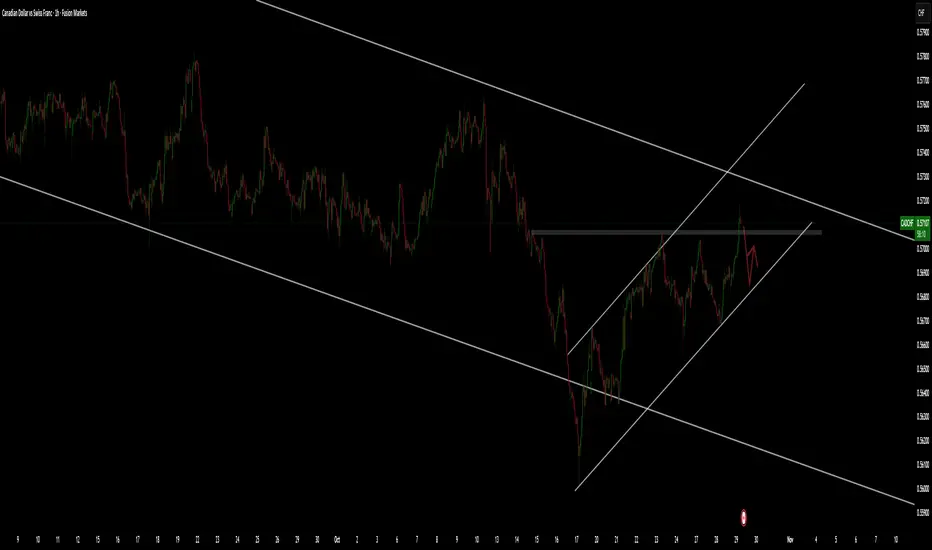
CADCHF pullback.CADCHF has been moving nicely within the channel. But overall it is in the DownTrend and now going for a pull back. If breaks the small channel a possible fall.
XAU/USD – Gold Faces Key RejectionXAU/USD – Gold Faces Key Rejection Zone Near 4,050 Ahead of Month-End
Gold prices (XAU/USD) are attempting a short-term rebound from the 3,900 support area after an extended bearish leg last week. However, the recovery momentum is now testing a critical resistance zone around 4,020–4,050, which previously acted as a major breakdown point.
From a technical standpoint, the overall structure remains bearish as long as price stays below 4,050. The recent move appears to be a retracement toward the 38.2% Fibonacci zone, aligning with the EMA dynamic resistance and prior supply area. A clear rejection from this region could trigger renewed selling pressure toward 3,908–3,880, while a confirmed breakout above 4,050 would open the door for a corrective push toward 4,180 and 4,390.
Key Levels:
Resistance: 4,050 / 4,180 / 4,390
Support: 3,908 / 3,880 / 3,792
Trading Strategy:
Scenario 1 (Bearish bias): Watch for bearish reversal signals at 4,020–4,050. A rejection candle or RSI divergence could validate short entries toward 3,908.
Scenario 2 (Bullish breakout): If gold closes firmly above 4,050 on H1–H4 timeframe, short-term buyers may target 4,180 before reassessing momentum.
Overall, sellers still hold control unless bulls reclaim 4,050 convincingly. Traders should monitor today’s U.S. data releases and Fed commentary for volatility triggers.
Remember to follow for more daily trading setups and technical insights.
