THE KOG REPORTTHE KOG REPORT:
In last week’s KOG Report we gave the bias level as bullish above 4003 and the red box we would be looking for to break to then confirm the move into the region we wanted. The move played well from the opening going on to complete all the red box targets together with our algo targets on gold.
Although it being risky we wanted to short from the given region, but due to price breaking through without even halting, we updated traders with the higher region we were looking to target, which also worked well.
On Friday, we managed to identify the pattern we wanted and activated a target of 4197 together with the break below the bias level. This for us again worked well to end the week with a wonderful short and then a TAP AND BOUNCE from the indicator level giving those who missed the short and opportunity to capture a 200pip long to end the week.
A phenomenal week in Camelot, not just on Gold but the many other pairs we trade and analyse.
So, what can we expect in the week ahead?
So, this week I have a bit of a concern with this bearish move. I have a sneaky suspicion that they may not have completed upside as yet, and instead, want to get traders in to thinking the retracement has started. Just a inkling for now so let’s see how the week opens and what region we attack first.
Above, I have a reversal on the hourly and the 4H chart but the daily, weekly and monthly are still suggesting higher pricing. Ideally, we need another bearish day for price to leave the 4200’s and come close to the 4150 level to hold before we decide we’re going to either consolidate and accumulate here or get a deeper pull back. Below, we have 4220 which is the level that will need to break for us to go lower with the initial target below being 4165 and below that 4129.
Our key level here initially is the 4295 level and above that 4310. 4310 is the line in the sand for bulls to attempt to break to go higher and complete the move back above to create another all time high. Failure, and we should get more confirmation of a deeper pull back that should attempt to target the lower 4000 mark.
As usual, we’ll let the algo confirm the move, the indicators will tell us which way to stay in, and the liquidity indicator will tell us when to play caution. For now, the path is on the chart, let’s see how we open and begin the week.
KOG’s bias of the week:
Bullish above 4230
Bearish below 4220
RED BOXES:
Break above 4255 for 4265, 4270, 4284 and 4304 in extension of the move
Break below 4237 for 4230, 4220, 4210, 4206, 4185 and 4177 in extension of the move
Please do support us by hitting the like button, leaving a comment, and giving us a follow. We’ve been doing this for a long time now providing traders with in-depth free analysis on Gold, so your likes and comments are very much appreciated.
As always, trade safe.
KOG
Gold

LiamTrading - XAUUSD: Mid-Term Correction Begins ...LiamTrading - XAUUSD: Mid-Term Correction Begins - Watch for Selling at Key Resistance Zone
Hello traders community,
After a surge due to geopolitical tensions, XAUUSD (Gold) is starting to show signs of a mid-term correction. The upward momentum has stalled, and prices are showing weakness from the peak region.
The market is currently in a state of tug-of-war, influenced by various macro factors, creating clear two-way trading opportunities.
📰 Macro Analysis: Interwoven Market
Gold prices are currently caught between three main streams of information:
Support (Bullish): The Israel–Hamas conflict and escalating geopolitical risks remain the main "safe haven" factor, keeping Gold prices anchored at high levels.
Pressure (Bearish): Signs of "cooling down" in US-China trade tensions reduce the demand for safe haven assets and restrain Gold's upward momentum.
Long Term (Bullish): Expectations that the Fed will soon cut interest rates continue to support Gold in the long term, although it does not have a strong short-term impact.
This contradiction makes it difficult for the market to break further, instead necessitating a technical correction.
📊 Technical Analysis
The M30/H1 chart clearly shows the correction structure forming:
Declining Structure: Prices have formed a distinct peak and dropped sharply, breaking short-term upward structures. The current uptrend is merely a technical recovery wave.
Dominant Sell Zone: The $4306 zone is an extremely important confluence area. This is:
The 0.382 Fibonacci Retracement level, a common retracement ratio.
An old support zone that has been broken, now becoming strong resistance ("Sell fibonacci and support" on the chart).
A large previous liquidity area, where sellers will strongly defend this region.
Price Decline Target: The main target for this decline is the VAL (Value Area Low) zone of the Volume Profile indicator, around $4180. This is a high-volume trading area, where buyers are likely to return.
🎯 Detailed Trading Strategy
The main priority is to watch for selling at Fibonacci resistance zones.
Scenario 1: Sell Correction (Sell) 📉
Entry: $4306
Stop Loss (SL): $4312 (A tight, safe SL above the resistance zone)
Take Profit (TP): $4288 - $4265 - $4233 - $4210 - $4190 (Final target is the VAL zone)
Scenario 2: Buy at Strong Support Zone (Buy) 📈
Entry: Watch for buying when prices correct deeply to the VAL $4178 zone.
Stop Loss (SL): $4170
Take Profit (TP): $4198 - $4225 - $4246 - $4270
Summary
Although long-term macro factors continue to support Gold, technically, a mid-term correction has begun. The optimal strategy is to watch for selling (Sell) when prices recover to the confluence resistance zone $4306 and take profits at the targets below, especially the VAL $4180 zone.
Always manage your capital tightly. Wishing traders a successful week!
Note: This article is for reference only and is not investment advice.

Gold (XAUUSD) Analysis – October 20, 2025Gold continues to trade within a strong ascending channel, maintaining its medium-term bullish structure. After forming a corrective “V-shaped” recovery from the 4,220 support zone (aligned with the 100-EMA), buyers have stepped back in, defending the lower trendline.
Gold continues to trade within a strong ascending channel, maintaining its medium-term bullish structure. After forming a corrective “V-shaped” recovery from the 4,220 support zone (aligned with the 100-EMA), buyers have stepped back in, defending the lower trendline.
The price action now shows early signs of bullish continuation as momentum builds above the short-term moving averages (EMA20 and EMA50). A clean break and retest above 4,260 could confirm a renewed push toward the upper boundary of the rising channel.
Key Technical Levels:
Support 1: 4,221 – confluence with EMA100 and local swing low
Support 2: 4,142 – deeper retracement area / 0.618 Fibonacci zone
Resistance 1: 4,290 – intraday pivot level
Resistance 2: 4,370 – upper channel target
Resistance 3: 4,450 – projected Fibonacci extension
Trading Strategy:
As long as gold holds above 4,220, the short-term bias remains bullish. Traders may look for confirmation of higher lows around the EMA cluster to position for a breakout toward 4,370–4,450.
If the structure fails below 4,220, a deeper correction toward 4,140 may unfold before buyers re-emerge.
Outlook:
Momentum indicators show recovery potential after a technical pullback. A breakout continuation scenario remains the primary bias, supported by trendline structure and moving average alignment.
Keep this setup on your watchlist and follow for more in-depth strategies in the upcoming sessions.

Global Uncertainty, Fed Moves, and the Golden Opportunity AheadHey everyone, good to see you here. Let’s unpack what’s been happening with gold after another explosive week in the markets.
Last Friday, gold pushed to new record highs, touching close to 4,400 before heavy profit-taking kicked in during the US session. The pullback shaved roughly 165 off the top, but even with that drop, gold still managed to close the week nearly 6% higher. That makes it nine straight weeks of gains — an incredible run we haven’t seen in years. Since this short-term rally began, gold’s climbed more than 25%, outperforming the 2020 surge that once shook the market.
So what’s driving this strength? It’s a mix of global uncertainty, geopolitical tensions, and traders positioning around the Fed’s policy shift. Rate cuts and the looming risk of a US government shutdown have added volatility, but also reinforced gold’s status as a safe-haven play. Every dip so far has been met with buyers stepping in confidently — a clear sign that sentiment remains firmly bullish.
Technically, the 4,200 zone stands out as key support. As long as price holds above it, the “buy-the-dip” strategy stays valid. The Fibonacci retracements around 0.5 and 0.618 align perfectly with this level, highlighting an area where buyers could reload before the next leg up.
If momentum keeps building, the path toward 4,500 looks open and realistic. The trend is strong, the fundamentals are supportive, and gold continues to attract both institutional flows and retail interest.
Right now, gold isn’t just shining — it’s commanding attention. The question is, are you watching closely enough to catch the next move?

Gold’s Golden Retest?Gold continues to trade within a rising blue channel, maintaining its overall bullish structure.
Currently, price is retesting the intersection between the lower blue trendline and the red structure zone, which has acted as strong support multiple times.
As long as this confluence area holds, I’ll be looking for trend-following longs targeting the upper boundary of the channel.
A break and close below this zone would temporarily pause the bullish momentum and open room for a deeper correction.
⚠️ Disclaimer: This is not financial advice. Always do your own research and manage risk properly.
📚 Stick to your trading plan regarding entries, risk, and management.
Good luck! 🍀
All Strategies Are Good; If Managed Properly!
~Richard Nasr

XAU/USD: Bullish Surge to 4400?As the previous analysis worked exactly as predicted, OANDA:XAUUSD is setting up for a bullish surge on the 4-hour chart , where price is bouncing off a solid upward trendline, converging with the EMA 50 as dynamic support and a key support zone, signaling potential continuation of the uptrend amid recent consolidation. This confluence creates a strong buying opportunity if buyers hold the line against short-term pullbacks.
Entry zone between 4090-4165 for a long position. Targets at 4380 (first) and 4400 (second) near the resistance zone, delivering a risk-reward ratio close to 1:3 . Set a stop loss on a close below 4090 to mitigate downside risks. 🌟 Monitor for confirmation via a bullish candle close above the entry with building volume, capitalizing on gold's safe-haven appeal in uncertain markets.
Fundamentally , no major news events are observed in the economic calendar today. However, key Chinese data releases such as the PBoC interest rate decision and Q3 GDP could indirectly influence gold through global risk sentiment and commodity demand. 💡
📝 Trade Plan:
✅ Entry Zone: $4,090 – $4,165 (buy zone near trendline + EMA 50)
❌ Stop Loss: Close below $4,090
🎯 Targets:
TP1: $4,380 (initial resistance)
TP2: $4,400 (major resistance / extended target)
💎 Risk-to-Reward: Approx. 1:3, offering a strong technical edge.
What's your take on this gold setup? Comment below! 👇

XAUUSD-GOLD 1H Chart—SELL Setup with 3 Profit TargetsHello Guys,
Here’s my 1-hour XAUUSD-GOLD analysis for you.
These are the exact SELL levels I’ll be watching:
🔵SELL level: 4285.9
🔴 Stop level:4335.3 (or adjust based on your own margin)
🟢 TP1: 4264.8
🟢 TP2: 4232.1
🟢 TP3: 4185.0
Risk-to-reward ratio on this setup: 2.05
If XAUUSD-GOLD reaches these levels, I’ll definitely take a SELL position.
Every like is my biggest motivation to keep sharing these analyses.
Thanks to everyone supporting me!

Grand Silver SupercycleI present the Grand Silver Supercycle. Silver has followed Elliott Wave Theory nicely through the years. The price hit a century low during The Great Depression, beginning what I believe to be the first wave of a supercycle. There is a clear five wave pattern up from this low, peaking in 1980. This is supercycle wave 1. Then, we see a five wave corrective pattern down, bottoming out in the early 90s. Alternatively, a three wave ABC pattern could be drawn. This is where supercycle wave 3 begins. Wave 3 is typically much more prominent than wave 1 in Elliott Wave Theory. For this reason, it makes sense that the next five wave pattern ending in 2011 is only the first subwave of supercycle wave 3. The second subwave corrected to the 2020 low, and we are currently on the third subwave. Within this subwave, we could either be starting a third wave (as shown in the chart) or still be on the corrective second wave. I believe the former is much more likely due to fundamentals.
Price targets within the current subwave were estimated as follows:
wave 3 length = 1.618 X wave 1
wave 3 target = $48
wave 4 length = 38.2% retracement of wave 3
wave 5 length = 1.618 X (wave 3 end - wave 1 start)
I'm more confident on wave 3 ending near $48 than I am of wave 5 ending near $95. There is strong resistance at $50, which coincides with the Elliott target zone. Wave 5 length can vary significantly. For silver at least, fifth waves have traditionally been long ones.
Fundamentals
Elliott Wave Theory is only a tool. It needs to be backed up by fundamentals when forecasting on long time frames. Silver is undervalued due to many years of supply outstripping demand, creating cheap prices. That is in the early stages of changing as now demand outpaces supply. Global silver demand was expected to hit an all time high of 1.21 billion ounces in 2022 (www.silverinstitute.org). This is largely due to increases in demand in both industry (Green Revolution) and personal investment (stackers hedging against inflation). Silver reserves currently stand at 530,000 metric tons (www.statista.com). The current demand is 38,000 metric tons per year. A simple calculation shows existing reserves could be depleted in 14 years. However, this calculation doesn't take into account new discoveries and recycling, which have so far kept pace with demand. Estimates of time to depletion of reserves vary wildly from a couple decades to a few centuries. At the moment, the prime driver of price (in addition to inflation) will be the deficit, not depletion of reserves.
Inflation is a totally different animal that is much harder to forecast long term due to its close relationship to government and Federal Reserve policy. It is more likely that when presented the choice, our leaders choose high inflation over debt default and depression. How this all is going to play out is anyone's guess. It seems for now our leaders are trying to kick the can down the road for as long as possible. If hyperinflation hits, the silver price will reach extraordinary heights.

EUR/USD (Euro vs U.S. Dollar) chart Pattern this is a 4-hour..EUR/USD (Euro vs U.S. Dollar) chart Pattern this is a 4-hour timeframe Ichimoku Cloud, and my marked two target levels labeled “Target Point.”
Here’s the breakdown:
Current price: around 1.1660 – 1.1670
Structure: price has broken above a descending trendline and is holding above the Ichimoku cloud, suggesting a bullish continuation.
My chart shows two upward projection levels (target zones).
🎯 Target Levels (as marked on my chart)
1. First Target Point: ≈ 1.1740 – 1.1750
→ This corresponds to the first measured breakout target — a moderate move above the current resistance.
2. Second / Final Target Point: ≈ 1.1800 – 1.1820
→ This is the extended target from the larger breakout structure, aligning with prior highs and resistance on the left side of the chart.
---
📈 Summary
Element Level (Approx.)
Current Price 1.1660
Target 1 1.1740 – 1.1750
Target 2 1.1800 – 1.1820
Support / Stop-Loss (suggested) Below 1.1630 (below the cloud base)
This setup indicates a bullish bias as long as price remains above 1.1630, aiming first for 1.1750, and then 1.1820 if momentum continues.

GOLD TREND MOVEMENTAfter gold sell on friday, we completed a minor bearish retracement channel ehich has been long expected followed by a bullish pullback to 4240's
Gold opened bullish this week as we're now at the 4260's as we aim back for 4300's as there is a clear path back to ATH just as the trend analysis implies. This trend shows the top liquidity levels and POI
Updates would be given as the market gains momentum

BTC/USD 1-hour chart Pattern..BTC/USD 1-hour chart Ichimoku Cloud with a breakout above the cloud and a descending trendline.
Here’s the analysis breakdown based on what’s visible:
Current price: ≈ $110,395
Previous resistance zone: around $111,000
Target point (as marked on my chart): ≈ $116,000
So my target level — as per your chart setup — is around $116,000 USD.
This aligns with a potential breakout continuation move, possibly measured from the height of the consolidation range (≈ $108,000 – $111,000) projected upward.
📈 Summary:
Entry (breakout): around $110,000
Target: $116,000
Stop-loss (suggested): below $108,000 (below the cloud / breakout zone)

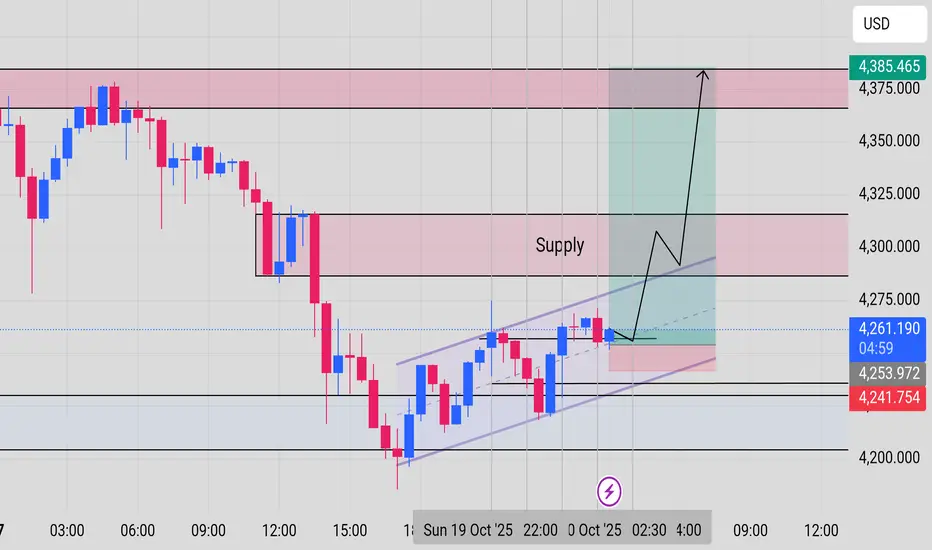
GOLD – 30m Chart Daily bias Trend : Short-term pullback inside an ascending channel, bullish bias for now
Trade Setup : Buy (Long)
Entry: ~4,261 (near channel support)
Stop-Loss: 4,241 (below recent low/support)
Take-Profit: 4,385 (next major resistance)
Key Zones:
Support: 4,254 (lower boundary of channel)
Supply/Resistance: 4,290–4,320 (may act as partial profit area)
Notes for Traders:
Buy near the lower channel line for better R:R.
Watch price reaction around supply zone; can scale out if needed.
Always respect SL to protect capital.
This content is for educational purposes and trade at your own risk
Gold (XAUUSD) Technical Analysis – October 20, 2025 (1H Chart)Gold continues to move within a steady ascending channel, maintaining a clear bullish structure across multiple timeframes. After a sharp correction from the upper trendline, the market found support near the confluence of EMA100 and EMA200, signaling that buyers are gradually regaining control.
At the moment, price is stabilizing around the EMA50 zone and showing early signs of recovery. A confirmed break and close above 4265 could trigger a new bullish leg targeting the upper boundary of the channel around 4470 – 4480.
Technical Overview
Trend: Overall bullish; the market continues to form higher highs and higher lows.
EMA structure: 20 > 50 > 100 > 200, confirming long-term bullish alignment.
Price behavior: Recent rejection from EMA200 and strong recovery momentum.
Fibonacci retracement: The 0.5–0.618 zone aligns with 4250 – 4240, acting as a key re-entry point for buyers.
Trading Plan
Primary bias: Buy on pullback continuation
Entry zone: 4255 – 4265
Stop loss: below 4210
Take profit: 4465 – 4480
This setup provides a favorable risk-to-reward ratio of approximately 1:3, suitable for both intraday and short-term swing trades.
Key Levels
4250 – 4265;EMA20 + Fibo 0.618 zone;Major Support
4210 – 4220;EMA100/200 confluence;Short-term Resistance
4330 – 4340;Previous local high;Major Resistance
4470 – 4480;Channel upper boundary
Market Outlook
The overall bias remains bullish. The recent pullback is viewed as a healthy correction before the next potential upward move. A confirmed close above 4270 would strengthen the bullish continuation scenario, while a break below 4210 would invalidate it.
Keep monitoring the 4250 – 4260 area closely; it may serve as a critical launching point for the next upward swing. Stay tuned for further market updates and strategy insights.

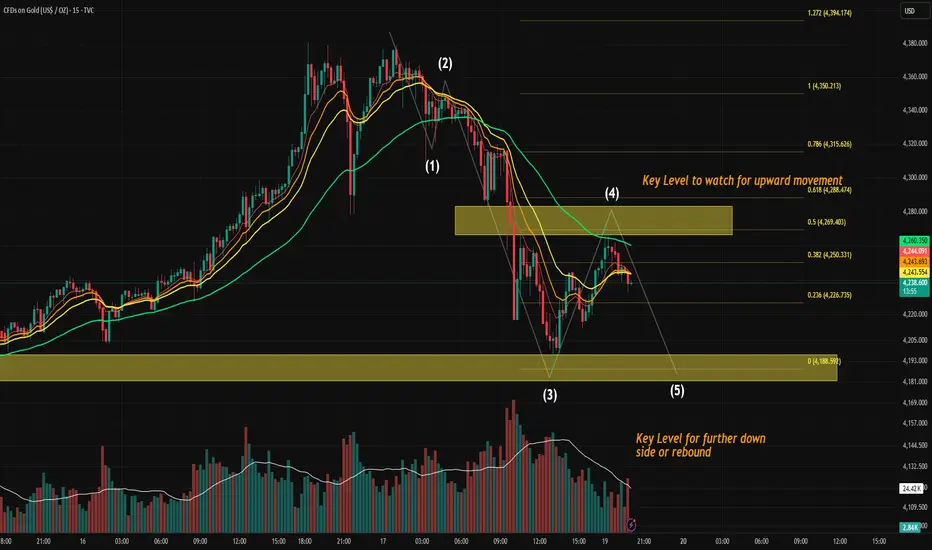
Elliott Wave Analysis: Gold Near Potential Wave 5 Reversal PointGold Price Action Analysis - Potential Wave 5 Setup (sub waves within Wave A going down)
Wave Structure Overview
The current structure on the 15-minute chart appears to be unfolding in a classic 5-wave impulsive sequence:
Wave (1) — Initial sell-off following local top formation.
Wave (2) — Sharp retracement, testing previous supply, rejected at previous premarket range high (Friday US Stocks premarket high)
Wave (3) — Strong impulsive move down with expanding volume, typical of a wave 3 extension.
It respected one of our previous opening range high (lower yellow level).
Wave (4) — Counter-trend rally into a prior supply block / zone, showing hesitation and rejection. (we are likely done, since it had retraced to 0.5 Fib of Wave 3), i am not ruling out where we may have one more small wave up before we get into the real wave (5).
Wave (5) — Still developing, assuming wave (4) is done, we are likely to push into the lower yellow demand zone, where either continuation or a significant rebound may occur.
One scenario that can happen is that we double bottom where wave 5 meet end of wave 3, and we start a corrective wave up which is a potential Wave B going up.
🟧 Key Levels to Watch
Upper Zone (around 4271–4290)
This zone aligns with the ORH level and prior Wave (4) rejection area.
➝ If broken with strong momentum, it can invalidate the immediate bearish Wave 5 scenario and hint at a deeper retracement or new bullish structure.
Lower Zone (around 4198–4181)
This is a strong demand zone, confluence with Wave (3) extension targets and potential end of Wave (5).
➝ Price reaction here is crucial: either we see a clean 5-wave completion and rebound, or further downside acceleration.
📊 Momentum Confirmation (MACD)
The MACD shows a decelerating bearish momentum going into Wave (5), which fits the classic pattern where Wave 3 has the strongest momentum and Wave 5 often shows divergence or a weaker push.
If MACD prints a higher low while price makes a lower low, that would confirm bullish divergence, a common reversal signal after an impulse.
📝 Trading Implications
Scenario A — Bounce at Demand Zone:
Look for reversal signals or bullish divergence near 4180–4198 to confirm the end of Wave (5). Potential short-covering rally could take us close to 4300
Scenario B — Breakdown Below Demand Zone:
A clean break and close below 4180 may open the door to extended bearish continuation — likely a larger degree correction or Wave C structure.
Invalidation:
A move and acceptance above the upper ORH zone would invalidate this short-term bearish count.
Final Thoughts
This setup is technically clean:
Clear Elliott structure
Key liquidity zones mapped
Momentum oscillator in sync with price action
⚠️ But remember, Wave 5s can truncate or extend, so flexibility is key. Watch how price behaves at the lower yellow zone — that’s where the next big move could be born.
Weekly Outlook — Gold Futures (MGCZ2025)Price is sitting between key levels after last week’s explosive move.
I’m watching 4,300 as immediate resistance — if bulls can’t hold above this level, I expect a sweep toward 4,200–4,150 (H4 + Daily FVGs) before continuation.
Monday might just be a setup day, building liquidity for a Tuesday/Wednesday move.
Key Levels:
🟦 4,392 – Previous Weekly High
🟨 4,300 – Near-term resistance
🟧 4,200 – Daily Low / Support zone
🟩 4,150 – H4 FVG top
Let’s see how Monday sets the tone for the week.
#Gold #Futures #TradingPlan #ICT #PriceAction

GOLD STRONG REJECTION|LONG|
✅XAUUSD after rejecting the demand level, is showing early signs of bullish intent. The rejection wick signals absorption of sell-side liquidity and potential expansion toward the imbalance near the 4,310$ target zone. As long as price stays above 4,220$, buyers remain in control. Time Frame 2H.
LONG🚀
✅Like and subscribe to never miss a new idea!✅

Nasdaq, Bitcoin, Gold, Dollar Index and Fiber Weekly OutlookMajor insights on all the above instruments and the possible draw on liquidity along with entry mechanisms.

Xauusd Gold Next SetupXauusd Gold Next Setup
This Analysis is based on Educational Purposes on base of technical Analysis
Key Point : 4236 - 4221.00 for bullish

Gold Technical AnalysisBased on Simple Technical Analysis ( Trendline + Support & Resistance )
Risk Disclaimer:
Please be advised that I am not telling anyone how to spend or invest their money. Take all of my analysis as my own opinion, as entertainment, and at your own risk. I assume no responsibility or liability for any errors or omissions in the content of this page, and they are for educational purposes only. Any action you take on the information in this analysis is strictly at your own risk. There is a very high degree of risk involved in trading. Past results are not indicative of future returns. Good luck :-)

Analysis and possible path of goldHi traders
One-hour structure of gold:
The structure of the one-hour time frame and above is still the bullish structure and the movement that can be imagined this week. The liquidity points and three resistance / support are marked on the chart. They are the market reaction points that can be triggered to enter at these levels in the lower time.
The area of 4202 is the choch-hunt line that can act as a support pullback and even the main positive reaction can be formed from this area, but ideally the current bottom is collected once again and rises from one of the three supports below the bottom.
Have a good week
Gold: First signs of a correction after a strong rallyHi traders and investors!
This analysis is based on the Initiative Analysis (IA) concept.
For the past nine weeks, gold has been flying upward — and now we’re starting to see signs of a pause in growth or even the beginning of a correction.
Friday’s candle showed very high volume, and this volume came from the seller side.
A similar, though smaller, volume was seen on August 8.
This could indicate that we may enter a correction or sideways phase.
The range of the most recent buyer initiative on the daily timeframe is quite wide.
Yesterday, the price came close to the 50% level of that initiative, but didn’t quite reach it.
The key levels to watch for potential buys are:
50% level of the buyer initiative — 4162,
upper boundary of the previous buyer initiative — 4059.
By the way, on the weekly timeframe, last week’s trading volume was the highest since March 2022.
All these signs point to a possible pause in growth.
Wishing you profitable trades!

XAUUSD Weekly expectations Long/Shirt ?! 🧩 Market Overview
Gold is currently trading around $4,253 , after a strong drop of about -1.6% .
Price is moving inside a rising (uptrend) channel, but the recent red candle shows selling pressure.
⚙️ Key Zones
Resistance: $4,378 → Recent high where price was rejected
Support: $4,036 → Previous low / major demand zone
Buffer Zone: $4,200 → Important area to watch for bounce or breakdown
SSL (Sell-Side Liquidity): Below $4,200 → Possible stop-hunt area
📊 Possible Scenarios
🟢 Bullish :
If price bounces from the $4,200 buffer zone, it may continue higher towards $4,300–$4,378.
🔴 Bearish :
If price breaks and closes below $4,200 , it may fall toward $4,100–$4,036 .
My View
Gold is now near a decision zone.
I’ll wait to see if buyers defend $4,200 or if sellers break it down.
No rush — patience brings better entries.
💬 Disclaimer
This is not financial advice. It’s an educational analysis based on technical structure and liquidity levels.

at the end , this is my opinion about GOLDAnd finally, this is my final opinion on #Gold in the one-hour time frame.
I hope all friends will send their good opinions and analyses through this format for the sake of education and better exchange of information ❤️
