Platinum- While everyone is chasing Gold’s rally, I’ve got my eyes on Platinum.
- That doesn’t mean Gold is a bad investment, it just means it’s already had its moment.
- Platinum feels “delayed,” but its time is coming.
- Observe closely, this simple graph reveals a tightening triangle.
Remember my first rule: Buy the blood, not the moon.
Stay sharp. Diversify. Never go all in.
Happy Tr4Ding
Gold

Gold Vs MoneySupply: a chart Peter Schiff Doesn't want u to seegold has upside.. expecting it to push toward its real valuation all time high..
over time gold has performed poorly at preserving capital. but academically recognized inflationary environments could be what was missing.

Gold Near 4,280 as US–China Tensions Fuel Flight to Safety!Hey Traders,
In today’s session, we’re monitoring XAUUSD for a buying opportunity around the 4,280 zone. Gold remains in a strong uptrend, with price currently correcting toward a key structural support area where buyers may look to re-enter.
From a fundamental standpoint, rising US–China geopolitical tensions have pushed investors toward safe-haven assets. Market sentiment is tilting defensive, and Gold — already hovering near all-time highs — continues to reflect that global risk aversion.
A sustained bid above 4,280 could reinforce bullish momentum and potentially open the path toward new highs if uncertainty persists.
Key level: 4,280 (support / trend confluence)
Bias: Bullish while above this level
Trade safe,
Joe.

GOLD Set To Grow! BUY!
My dear subscribers,
GOLD looks like it will make a good move, and here are the details:
The market is trading on 4307.6 pivot level.
Bias - Bullish
My Stop Loss - 4291.5
Technical Indicators: Both Super Trend & Pivot HL indicate a highly probable Bullish continuation.
Target - 4335.3
About Used Indicators:
The average true range (ATR) plays an important role in 'Supertrend' as the indicator uses ATR to calculate its value. The ATR indicator signals the degree of price volatility.
Disclosure: I am part of Trade Nation's Influencer program and receive a monthly fee for using their TradingView charts in my analysis.
———————————
WISH YOU ALL LUCK

XAUUSD: Rally can Reach new ATH - $4520 pointsHello everyone, here is my breakdown of the current Gold setup.
Market Analysis
Gold has been in a very strong and complex uptrend. We saw the price break out of an initial range and then establish a major Trend Line that has guided it higher, breaking through key levels like Support 2 at 3670 and Support 1 at 4020.
Currently, the most significant event is that the price has broken out above its main Trend Line. After this powerful move, the market has entered a natural corrective phase and is pulling back towards this broken line for a classic retest. This is a critical area to watch.
My Scenario & Strategy
I'm looking for the price to complete its correction down to this main ascending trend line. The key signal for me would be a confirmed and strong bounce from this dynamic support, which would tell me the pullback is over and the primary trend is ready to accelerate.
Therefore, the strategy is to watch for this bounce. A successful defense of the trend line would validate the long scenario. My new target for the next impulsive wave higher is 4520, which would represent a new ATH.
That's the setup I'm tracking. Thank you for your attention, and always manage your risk.

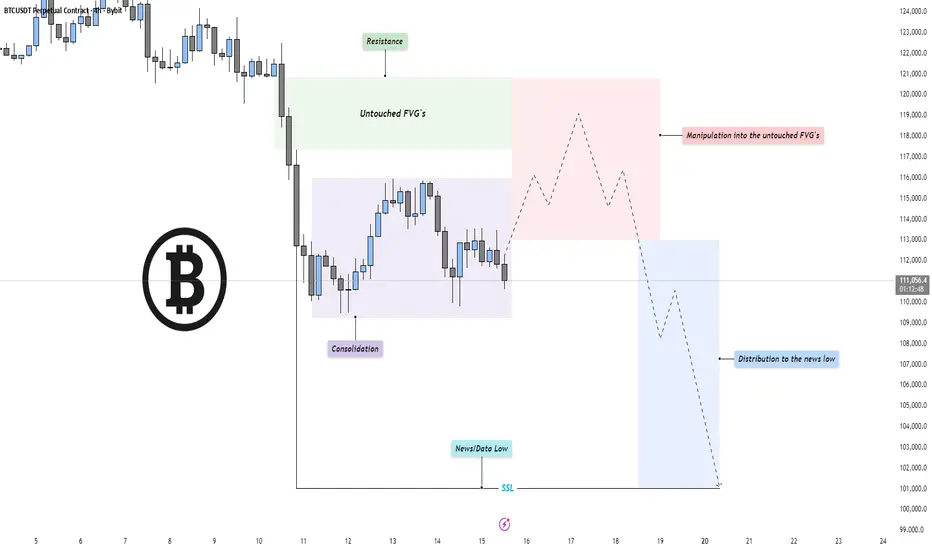
BTC - Perfect Power of 3 setup!Market Context
Bitcoin has entered a phase of compression after an extended bearish leg, with price currently consolidating near recent lows. The previous selloff created a clean structure of inefficiencies and untouched fair value gaps (FVGs) above, now acting as potential magnet zones for short-term retracements. The broader context remains bearish until those imbalances are efficiently mitigated.
Fair Value Gaps & Manipulation Zones
A clear pocket of untouched FVGs sits above the current range, aligning with resistance from prior breakdown points. Price could engineer a manipulation move into this zone, enticing late buyers before resuming the macro bearish direction. Such a move would serve as a liquidity grab and offer premium pricing for distribution before continuation lower.
Liquidity Dynamics
The market structure shows resting sell-side liquidity (SSL) below the recent “news/data low,” marked as a potential target for a deeper sweep. Once manipulation into the upper inefficiencies completes, the market could shift momentum to the downside, distributing into that liquidity and seeking new lows for rebalancing.
Final Thoughts
The current structure points toward a classic bearish continuation setup: consolidation, manipulation into premium inefficiencies, and a drive toward sell-side liquidity. Unless price breaks decisively above the untouched FVG chain, the expectation remains for a redistribution phase leading into the news low or beyond.
If this breakdown helped frame your bias, a like goes a long way — do you think price runs the FVG first, or dives straight into the liquidity below?
It is not a reversal callback correction to continue to buyGold gapped up at the opening, touched 4379 and then plunged nearly $100 before rebounding quickly. The fluctuations in the Asian session alone are so drastic. In addition, today is Friday and there is a risk of market closure, so intraday trading needs to be more cautious.
From the news perspective, the expectation of a Fed rate cut provides liquidity support, Sino-US trade tensions and geopolitical risks stimulate safe-haven demand, and the weakening of the US dollar and economic uncertainty amplify the appeal of gold. Many investors continue to increase their holdings of safe-haven assets in a complex macroeconomic context, providing solid and strong support for the rise of gold.
Although short-term prices fluctuate frequently, they have not fallen below the daily MA5 and MA10 moving averages. Therefore, it should not be regarded as a trend reversal, but a market shakeout. Therefore, we maintain a trading strategy that is mainly bullish and supplemented by short selling.
From a fundamental perspective, multiple rebound attempts failed to break through, making the upper 4380-4400 range a short-term resistance range. The short-term trend has the tendency to form an M top, so I will give several long trading opportunities during the day.
First of all, we should pay attention to the first support formed by 4315-4305 below, which is also the 61.8% retracement position of gold. If it repeatedly circles this position in the short term without breaking, we can try to go long on gold. For the second chance, I would give the support level of 4290-4280 below, which is near the trend suppression and the 50% dividing line, as well as the 4H MA10 moving average. I think we can try to go long on gold again within this range. The last chance I would give is around 4200, the starting point of this round of rise. Even if gold retaliates and falls, we can still maintain good trading opportunities.
During the day, we can go long on gold in batches according to the strength of gold's retracement.
OANDA:XAUUSD
XAUUSD: Market Analysis and Strategy for October 17Gold Technical Analysis
Daily Resistance: 4500, Support: 4059
4-Hour Resistance: 4380, Support: 4176
1-Hour Resistance: 4380, Support: 4280
Gold continued to rise by over $100 yesterday, reaching a high of 4380 in today's Asian session. At this rate, the next move is 4500.
Of course, this won't be the final target of this market rally.
In the short term, although there was a sharp drop of $100 in Friday's Asian session, it was quickly recovered, resulting in a V-shaped reversal, indicating that bullish sentiment has not subsided. The probability of setting a new high today, or even reaching 4400, remains high.
Operationally, continue to look for buying opportunities today. If the decline can be halted around 4330 or 4300, then continue to enter the market.
BUY:4330near
BUY:4300near
BUY:4280near

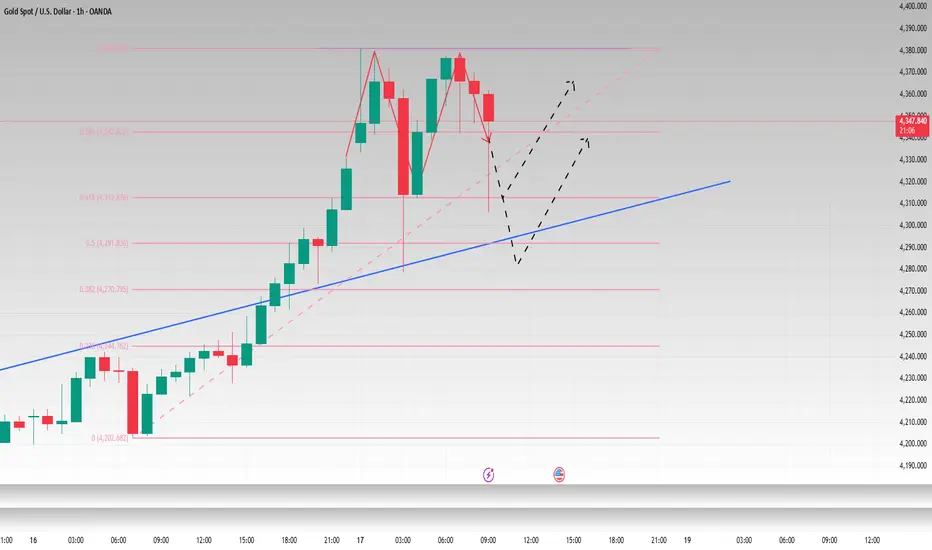
Use Average as Resistance for GoldGold is rising rapidly, making this a risky trade. The 21-period EMA usually works well for gold on the 15-minute timeframe. With a trailing stop set just above the moving average, I’m planning to target the trendline.

Gold flight to safety tradeThe Gold remains in a bullish trend, with recent price action showing signs of a continuation breakout within the broader uptrend.
Support Zone: 4260 – a key level from previous consolidation. Price is currently testing or approaching this level.
A bullish rebound from 4260 would confirm ongoing upside momentum, with potential targets at:
4400 – initial resistance
4450 – psychological and structural level
4500 – extended resistance on the longer-term chart
Bearish Scenario:
A confirmed break and daily close below 4260 would weaken the bullish outlook and suggest deeper downside risk toward:
4200 – minor support
4160 – stronger support and potential demand zone
Outlook:
A bullish bias remains intact while the Gold holds above 4260. A sustained break below this level could shift momentum to the downside in the short term.
This communication is for informational purposes only and should not be viewed as any form of recommendation as to a particular course of action or as investment advice. It is not intended as an offer or solicitation for the purchase or sale of any financial instrument or as an official confirmation of any transaction. Opinions, estimates and assumptions expressed herein are made as of the date of this communication and are subject to change without notice. This communication has been prepared based upon information, including market prices, data and other information, believed to be reliable; however, Trade Nation does not warrant its completeness or accuracy. All market prices and market data contained in or attached to this communication are indicative and subject to change without notice.

GOLD Is Bearish! Short!
Take a look at our analysis for GOLD.
Time Frame: 4h
Current Trend: Bearish
Sentiment: Overbought (based on 7-period RSI)
Forecast: Bearish
The price is testing a key resistance 4,338.72.
Taking into consideration the current market trend & overbought RSI, chances will be high to see a bearish movement to the downside at least to 4,203.99 level.
P.S
We determine oversold/overbought condition with RSI indicator.
When it drops below 30 - the market is considered to be oversold.
When it bounces above 70 - the market is considered to be overbought.
Like and subscribe and comment my ideas if you enjoy them!

GOLD → Positive backdrop. Consolidation before growth?FX:XAUUSD is consolidating after a shake-down in the Asian and Pacific sessions. The price hit a new low of 4278, but bulls are aggressively buying up two liquidations (manipulation?). The metal is preparing for its ninth consecutive week in positive territory, with an 8% increase over the week.
Key drivers: Fed members confirmed their readiness to cut rates in October and pointed to risks for the labor market. The situation with the trade war between China and the US is still tense.
However, negotiations between the presidents of three countries on the conflict in Eastern Europe have raised hopes for de-escalation, which has temporarily reduced demand for defensive assets. The shutdown continues, which supports the price of gold.
The correction in gold is a temporary pause, and any decline will be used for purchases.
Technically, the focus is on the global trading range of 4280-4380, with consolidation within 4350-4330. A breakout of the accumulation zone could trigger a move in the direction of the breakout
Resistance levels: 4350, 4380
Support levels: 4320, 4300, 4280
Technically, before rising, the price may test the liquidity zone located below the specified support zones. However, it is also worth watching the 4350 trigger—a breakout of resistance and a close above this level could trigger continued growth within the current bullish trend.
Best regards, R. Linda!

BTCUSD/XAUUSD where is the probability of equilibrium? 17/Oct/25BTCUSDXAUUSD ratio chart shown there is multi top pattern near 41 raio with price breaking the long term uptrend line. The Next major support could be at 1?! Gosh! BTC (fake money/ digital gold) same value with Gold ( real money /analog gold)?! WT....

Bitcoin. Oh mine! On Par with Gold by 2027? 17/Oct/25BTCUSD probably completed its cycle 7 (purple) high and now trending multi year low until till near 2027 which is cycle 8 (purple ) low. Based on EW pattern BTC could form a long-term flat pattern which price could go down to 3000 +/- by the time Gold which could be at around 3000?

DeGRAM | GOLD held the support line📊 Technical Analysis
● XAU/USD continues to respect the ascending support line, confirming an active short-term uptrend. Price rebounded from 4,308 support, forming a higher low structure that suggests momentum preservation.
● Immediate resistance lies at 4,376, where a breakout could extend the bullish leg if the current consolidation near 4,330 holds.
💡 Fundamental Analysis
● Gold remains supported by softer U.S. inflation expectations and rising geopolitical risk, keeping investor demand intact.
✨ Summary
● Long bias above 4,308; objectives 4,376–4,380. Trendline strength and supportive fundamentals signal continued short-term upside.
-------------------
Share your opinion in the comments and support the idea with a like. Thanks for your support!

Nears the Boss Resistance at $4,489 — Revaluation Era Incoming?Gold (GC1!) Nears the Boss Resistance at $4,489 — Revaluation Era Incoming? 🟡👑
No hype — this is it.
Gold Futures (GC1!) have pushed past $4,400 , approaching what I’ve long marked as the Boss Resistance at $4,489 . This is the final gate — and it's been sitting on my chart for years, untouched... until now.
That $4,000 level? It was our signal. The failed short attempt there wasn’t a mistake — it was confirmation. Since that breakout, gold’s been in vertical mode.
📍 Now we’re in the danger zone.
Expect chop, traps, or a reversal between $4,000 and $4,489 unless the Boss gets taken out with strength.
🔍 Big Picture: Revaluation May Be Coming...
The price action is wild — but the backdrop is even bigger.
🧾 Did you know the official U.S. valuation of gold is still $42.22 per ounce?
New research suggests Washington may be considering a gold revaluation — just like Roosevelt did in 1933. That move alone boosted U.S. gold wealth by 69% overnight.
Why revalue now? Here’s what’s brewing:
• 📉 National debt is exploding
• 🪙 Gold ETFs are soaking up demand
• 🌍 Central banks are stacking gold to escape USD dependency
• 💰 Revaluation would instantly add trillions in assets — without printing a dime
This isn’t just a rally — this is a structural reset.
📈 Levels Recap:
• Boss Resistance: $4,489 👑
• Breakout Floor: $4,000
• Intermediate Support: $3,602 and $3,000
• Long-Term Flip Zone: $2,537
Markets don’t move because of candles — they move because of confidence.
🧘 Mindset Check 🧘
Gold is rising because trust is falling.
We are entering an era where sound money is not just a preference — it’s a necessity.
One Love,
The FXPROFESSOR 💙
Gold front runs-----BTC Follows....

GOLD / XAUUSD – DAILY PLAN (Oct 17, 2025)🧭 MARKET CONTEXT
Main timeframe: M30 / H1
Current structure remains bullish, forming clear HH – HL sequences.
After a strong rally, price is now in a retracement phase toward a nearby demand zone aligned with the ascending trendline.
No sign of structure break yet (no BOS below the previous HL).
📈 PRIMARY SCENARIO (BUY SETUP)
➤ Entry Zone 1:
BUY GOLD 4280 – 4278
Stop Loss: 4275
Target 1: 4335
Target 2: 4350 (new HH)
Reason: This is a Bullish Order Block (OB) and BOS retest zone, aligned with the rising trendline.
Expecting a strong bullish reaction (rejection candle or engulfing bar) before triggering the buy limit.
➤ Entry Zone 2 (CP Setup – Confirmation Point)
BUY 4247 – 4245
Stop Loss: 4239
Target: 4300 / 4330 / 4350
Reason: This is the final demand zone near the main trendline, confluence of prior BOS + SSS (Structure Shift Support).
If price breaks below 4280 without reaction, patiently wait for confirmation around CP zone.
⚠️ ALTERNATIVE SCENARIO (STRUCTURE FAILURE)
If price closes below 4235 on M30, the bullish structure is invalidated.
→ The buy plan is canceled — wait for a pullback sell setup from 4280–4300 resistance.
If the buy stop loss is hit at 4239, monitor 4200 zone as the next H4 demand area.

Gold sweeps SL, wait for BUY LIMIT at Demand Zone 4,223-4,225Timeframe analysis: H4/30M
Logic: Trend Continuation after liquidity sweep.
MARKET STRUCTURE ANALYSIS (SMC Analysis)
Main Trend: Bullish (Price is moving within a parallel channel).
Structure Confirmation (BOS): The chart has confirmed an upward Break of Structure (BOS), indicating that buyers are controlling the market.
Liquidity Sweep/Fake: The strong bearish candle (marked as "Fake") is a move to sweep Stop Losses of early buyers and gather liquidity before Smart Money pushes the price in the main direction. This is an Inducement action.
Key Demand Zone (POI/Demand Zone/Order Block): The TIMING BUY area (4,223.154 - 4,225.000) is a potential Demand Zone/Order Block identified by Smart Money. The price is expected to retest this area before continuing to rise.
MAIN TRADING SCENARIO (LONG SETUP)
SCENARIO: Wait for the price to Pullback to the POI area to enter a buy order, continuing the main bullish trend.
Parameter
Value
SMC Description
Action
BUY LIMIT
Place a pending buy order
Entry Zone (POI)
4,225.000 - 4,223.150
Demand Zone/Order Block after liquidity sweep.
Stop Loss (SL)
4,214.390
Place below the low of the liquidity sweep candle ("Fake Low"), ensuring safety.
Take Profit 1 (TP1)
4,240.000
Target the nearest Swing High.
Take Profit 2 (TP2)
4,250.000
Target psychological resistance and mid-channel.
Take Profit 3 (TP3)
4,260.000+
Target the upper boundary of the parallel channel.
R:R Ratio
Approximately 1:2.5 to 1:3.5 (Depending on TP)
Good R:R ratio for a trend-following trade.
RISK MANAGEMENT
Risk: Only risk a maximum of 1-2% of the account for this trade.
Breakeven: When the price hits TP1, move SL to the Entry point (Breakeven) to protect capital.
Invalidation: If the price closes the D1/H4 candle below the SL level (4,214.390), the buy plan will be invalidated.

GOLD (XAUUSD): The Next Resistances
Here are the next potentially significant resistances on Gold to focus on.
Resistance 1: 4397 - 4403 area
Resistance 2: 4447 - 4453 area
Resistance 3: 4487 - 4503 area
Consider the underlined horizontal and vertical supports
for potential buying after pullbacks.
❤️Please, support my work with like, thank you!❤️
I am part of Trade Nation's Influencer program and receive a monthly fee for using their TradingView charts in my analysis.

DeGRAM | GOLD formed a bullish takeover📊 Technical Analysis
● XAU/USD shows a bullish takeover after rebounding from the support line near 4,219, confirming buyers’ control in the short-term structure.
● Price is now trading within an ascending channel, aiming toward the 4,240–4,250 resistance area, with intraday pullbacks likely forming higher lows.
💡 Fundamental Analysis
● Gold gains support from softer U.S. yields and cautious Fed remarks, improving sentiment for safe-haven assets.
✨ Summary
● Long bias above 4,219; objectives 4,240–4,250. Strong bullish candle and favorable macro backdrop confirm short-term upward momentum.
-------------------
Share your opinion in the comments and support the idea with a like. Thanks for your support!

Gold 1H – Will Dovish Fed Bets Keep Gold Above 4300?XAUUSD – Intraday Trading Plan | by Ryan_TitanTrader
📈 Market Context
Gold prices remain resilient near $4,365 as traders assess the shifting outlook for U.S. monetary policy. After softer inflation data earlier this week, market sentiment has turned cautiously dovish — investors are speculating that the Federal Reserve may cut rates sooner in 2026 if growth indicators weaken further.
However, today's focus is on the U.S. housing and labor data, which could influence short-term volatility. A strong report may revive dollar demand and trigger profit-taking in gold, while weaker readings could boost safe-haven interest and push XAUUSD higher toward 4,400+.
Expect intraday swings as liquidity hunts unfold before any decisive trend confirmation.
🔎 Technical Analysis (1H / SMC Style)
• The structure remains bullish, supported by consecutive Breaks of Structure (BOS) and a clean reaccumulation phase during the 4,230–4,270 consolidation.
• Price recently tapped a premium supply zone near 4,400, where early sellers may attempt short-term reactions.
• The discount demand zone at 4,300–4,302 aligns with a 0.382–0.5 Fibonacci retracement and previous BOS support, offering a high-probability re-entry area for continuation.
• Liquidity sweeps above 4,400–4,398 could attract institutional profit-taking before the next bullish leg resumes.
🔴 Sell Setup: 4400 – 4398
SL: 4410
TP targets: 4340 → 4315
🟢 Buy Setup: 4300 – 4302
SL: 4293
TP targets: 4345 → 4385 → 4410+
⚠️ Risk Management Tips
• Wait for M15 ChoCH/BOS confirmation before entering any setup.
• Expect volatility during U.S. macro data releases — spreads may widen temporarily.
• Use partial take-profits near intraday liquidity zones and trail stops once structure confirms bullish continuation.
✅ Summary
XAUUSD maintains its bullish structure above 4,300. A short-term pullback toward the 4,300–4,302 demand zone could offer another opportunity for buyers to rejoin the trend.
While profit-taking may occur at 4,400, the broader bias remains “Buy the Dip” unless a confirmed shift in structure occurs below 4,293.

Gold's Historic Rally: Why It HappenedGold approaches $4,500 per ounce for the first time in history. Up more than 50% in less than a year. Everyone's asking the same question: Is this a historic breakout, or the setup for a massive crash?
The answer requires looking at three things: what brought us here, where we are technically, and what could go wrong.
PART 1: THE MACRO STORY
Gold doesn't just rally because people are "scared." It rallies because of structural shifts in how the world's largest institutions view money, risk, and trust.
Central Banks Are Buying Gold at Record Pace
Here's a number that should get your attention: Central banks bought 1,045 tons of gold in 2024. That's the second-highest annual total on record.
In 2025, the buying hasn't slowed down. Poland alone has accumulated 67 tons year-to-date. Turkey, India, Kazakhstan, and others are following suit.
But here's what's really happening: This isn't about inflation hedging. If it were, Western central banks (US, Europe) would be buying too. They're not. Instead, emerging market central banks are diversifying away from the dollar.
Why? Because they watched what happened in 2022 when the US froze Russian reserves. When you hold dollar-denominated assets, they can be weaponized. Gold can't be sanctioned. Gold can't be frozen.
Central banks don't panic sell on a 5% dip. When they buy, they hold. This creates a structural price floor. Every pullback gets accumulated.
What this means: Central bank buying is the foundation of this rally, not a temporary catalyst.
The Federal Reserve is Cutting Interest Rates
According to the CME FedWatch Tool, there is a level of certainty that the Fed would cut rates in October 2025, with markets pricing in another cut in December this year.
When interest rates fall, something important happens to gold: its "opportunity cost" decreases.
Here's the simple version: Gold pays no interest. So when bonds also pay almost nothing (after inflation), holding gold looks pretty reasonable. But when real yields are high, bonds look better and gold looks worse.
Right now, the market is pricing in lower real yields ahead. That's bullish for gold. If the Fed doesn't cut as much as the market expects, that changes everything.
What this means: Rate cuts fuel the rally.
Geopolitical Instability & Currency Debasement
Global tensions remain elevated: Middle East instability, US-China friction, and the ongoing Russia-Ukraine conflict. But that's not the real driver here.
The real driver is the loss of faith in government money.
Gold is at an all-time high, not just in US dollars. It's also hitting all-time highs in euros, yen, and yuan. This isn't a dollar story. This is a global reassessment of what "money" actually means.
Meanwhile, the US national debt is over $35 trillion. Debt-to-GDP is at World War II levels. Other countries (Japan, Europe) are in similar situations, printing money and running massive deficits.
When governments print excessively, investors need a hedge. Gold can't be printed.
What this means: As long as deficits remain high and geopolitical chaos persists, gold has structural demand that goes beyond cycles.
The Bottom Line
Three powerful forces are all pushing in the same direction:
Central banks structurally accumulating gold (de-dollarization)
The Fed cutting rates (lower real yields = gold support)
Global monetary instability (currency debasement = safe-haven bid)
This combination hasn't existed in most traders' lifetimes. That's why this rally feels different. And why it's lasted this long.

GOLD BULLISH We have seen gold to be in a strong bullish momentum as its has broken the 4000 price margin and still keeps buying,This is the active trend channnel of gold as the path still leads to 4400,4420 .
4315 and 4360 are key liquidity zones
