GOLD BOUGHT XAUUSDGold recap , gold has hit (take profit) simply by following the trend and trading simple , I now expect it to have a temporary price rest before it can raise and continue its upward momentum
Gold

Gold (XAUUSD): break, buy.Gold (XAUUSD): break, buy. If you see a candle close above the level, you can buy.
Cheers

Gold breaks above structure, bulls eye 4,320$Hello, Traders! It's Leo. Are you following XAUUSD?
Chart Analysis:
Price continues to respect the ascending structure, showing steady bullish pressure.
Breakout Confirmation: The breakout above 4,060$ marks a shift from consolidation to trend continuation.
Targets: Next resistance sits at 4,320$, with 4,080$–4,040$ acting as the new demand zone.
Softer U.S. yields and weaker Dollar tone ahead of key CPI data are helping bulls regain traction, keeping price biased toward 4,320$.
💬 Share your view in the comments — are you watching for continuation or a pullback setup?
(Gold gains ground as traders await U.S. inflation data this week)

The bull market has returned. Am I bullish at this price level?#XAUUSD TVC:GOLD OANDA:XAUUSD
Gold prices performed strongly yesterday, closing with a large bullish candle on the daily chart and stabilizing above the daily MA5, officially signaling the return of bulls to the market.
Gold strengthened further today, and from a technical perspective, the bullish trend remains intact. Therefore, continuing to go long on gold is clearly safer. The bullish signal given last night regarding a pullback to the 4075 support level remains valid. However, with the passage of time and the continued strength of gold, a direct pullback to this level in the short term is somewhat difficult. But as a point of multiple pullbacks on smaller timeframes and near the daily MA20, the 4075 support remains reliable. Therefore, we can consider it a defensive level for the short-term bulls. As long as gold prices remain above this level, the bullish momentum will not change.
Currently, looking at the hourly chart, the 4125-4110 range is the support zone for the short term. If the price retraces to this level during the European session, it would be a good entry point, and we can continue to go long on gold within this range.

Gold Steadies Near 2-Week Highs | Traders Watch 4168 Breakout GOLD | Overview
Gold’s outlook remains positive in the near term, as the precious metal extended its rally this week amid optimism over an imminent end to the U.S. government shutdown and expectations of continued monetary easing from the Federal Reserve.
Technically:
Gold has stabilized above 4130, indicating solid bullish momentum, with potential to reach 4155 and 4168.
A sustained move above 4168 would further strengthen the uptrend, targeting 4190 – 4207.
However, if the price closes a 1H candle below 4130, it would suggest a shift to bearish momentum, exposing downside targets at 4105 and 4085.
Pivot Line: 4130
Resistance: 4155 · 4168 · 4207
Support: 4105 · 4085 · 4055
Outlook:
Gold remains bullish while above 4130, with momentum favoring a move toward 4155–4168 and potential extension to 4207.
A confirmed 1H close below 4130 would signal the start of a bearish correction toward 4105–4085

14 Year HVF that still offers 7X upside. SILVER Miner. $EXKEndeavour Silver is a mid tier producer with 4 mines in Mexico and Peru.
Focusing on exploration projects across the Americas.
EXK aims to become a leading senior silver producer.
It's Terronera reached commercial production last month and is forecast to process 350k tonnes over the next 6 months with avg grades of 120g/t Silver and 2.5g/T of Gold
EXK has a extensive pipeline of exploration projects.
The company expects free cash flow in Q4 2025 and Q1 2026
Management targets 30M ounces by 2030
EXK is in growth phase by higher production and new mine outputs but has faced earnings pressure due to derivative losses and rising costs. It has a solid asset base, and future earnings outlook anticipate improved cash flows.

XAUUSD: Buyers Defend $4,040 — Targeting $4,140 ResistanceHello everyone, here is my breakdown of the current Gold setup.
Market Analysis
XAUUSD has recently confirmed a bullish structure after bouncing strongly from the $4,000–$4,040 Support Zone, an area that coincides with the ascending Trend Line visible on the chart.
This level has repeatedly acted as a Buyer Zone, where multiple fake breakouts occurred — signaling liquidity sweeps and failure of sellers to maintain downward momentum. Each test of this support has been followed by a sharp bullish reaction, confirming strong demand and accumulation activity in this zone.
Currently, Gold is showing a controlled recovery phase, moving above the $4,040 Support and gradually approaching the $4,120–$4,160 Resistance Zone, which also aligns with the Trend Line extension and previous consolidation area. This zone represents the next critical reaction level for price. A confirmed breakout above it could open the way toward further continuation, while a rejection may lead to a corrective pullback back toward the $4,040 support. The recent price behavior — including several fake breakouts followed by strong recoveries — suggests that large buyers remain active, defending the bullish structure. As long as price holds above $4,040, the overall sentiment stays constructive and favors a gradual continuation toward the upper resistance levels.
My Scenario & Strategy
As long as XAUUSD remains above the $4,000–$4,040 Support Zone, the bullish bias remains valid.The next upside objective is located around $4,140–$4,160, where sellers may reappear based on past reactions. I expect the market to potentially form a small pullback before resuming its move higher. A sustained breakout and close above $4,160 would confirm a continuation toward $4,200 and possibly higher in the medium term.
However, if Gold breaks below $4,000, this bullish setup becomes invalid, and the price may return toward deeper support levels near $3,960–$3,940 before any new buying interest develops.For now, the structure supports buying pullbacks while the price stays above key support.
That's the setup I'm tracking. Thank you for your attention, and always manage your risk.

Gold Technical Outlook:
Price has stabilized above the 4105 level, indicating a potential bullish continuation toward the resistance zone at 4160.
A break and confirmation above 4160 on the 1-hour or 4-hour candle would strengthen the bullish sentiment and open the way for further upside targets at 4188 and 4220.
However, if the price drops and breaks below 4105, this would invalidate the bullish scenario and shift the outlook toward a downward move targeting the 4075 support level.

Gold Technical Outlook
Price has stabilized around the 4060 resistance zone (confirmation with a 1H or 4H candle close). If the level holds, the bias remains bullish, with potential upward movement toward the 4100 resistance. A break above 4100 would open the way for continued bullish momentum, targeting the next levels at 4133 and 4168.
However, if the price fails to sustain above 4060 and confirms a reversal candle, it may trigger a downside correction toward the 4030 support zone. A confirmed break below 4030 (1H candle close) would likely extend the bearish move toward the 3965 level.
Bias Trend: Bullish
Volatility: High

Gold (XAU/USD) – Bullish Momentum Continues Above Key Support ZoGold (XAU/USD) – Bullish Momentum Continues Above Key Support Zone
Gold remains in a strong uptrend structure on the H1 timeframe, forming higher highs and higher lows after breaking through the previous consolidation range near the 4,000–4,020 area. The price has respected the ascending trendline and recently formed a minor retracement before showing signs of bullish continuation.
The zone around 4,115–4,120 serves as the nearest support, aligned with the trendline and the last higher low. As long as the price holds above this level, the bullish structure remains intact.
The next resistance area is projected near 4,180–4,185, where traders should watch for potential profit-taking or reversal signals.
Trading Strategy:
Buy Entry: Around 4,135–4,140 (on retest of trendline support)
Stop Loss: Below 4,115
Take Profit: 4,180–4,185
Risk–Reward Ratio: ~1:2
Technical Confluence:
✔ EMA cluster trending upward confirming momentum
✔ RSI remains above the midline (bullish bias)
✔ Fibonacci 38.2% retracement aligns with the retest area
If price closes below 4,115, the short-term bias may shift toward 4,080 or deeper retracement. However, as long as the trendline holds, buyers maintain control.
Stay patient and wait for confirmation near the support zone before entering. Follow for more daily gold strategies and price-action updates.

XAUUSD: Market Analysis and Strategy for November 11Gold Technical Analysis:
Daily Resistance: 4192, Support: 4030
4-Hour Resistance: 4150, Support: 4080
1-Hour Resistance: 4150, Support: 4125
From a technical perspective, the monthly/weekly charts continue to show a bullish trend in the short term. The daily chart's "rounded bottom" upward pattern is basically confirmed, and the MACD/KDJ indicators provide support for upward momentum. As those who have read my recent analyses know, I have consistently emphasized that a break above 4080-4085 would further trigger bullish sentiment. Going forward, pay attention to the support level where the previous resistance turned into support, and also monitor the continuation of the upward trend. Support is expected around 4085-4080.
Combined with the 1-hour chart, although the upward momentum of the moving averages has slowed somewhat, the overall trend remains unchanged. During the European and American sessions, watch for opportunities to buy if the price tests the support levels around 4125 and 4117.
BUY:4125~4117
BUY:4102near
BUY:4090near
SELL:4155~4162near

Gold Buying Plan.Gold continued its expected bullish trend, rising further after the Asian session opened. The daily chart closed sharply higher, breaking through and firmly establishing itself above the $4100 mark. The 10-day and 7-day moving averages have formed a golden cross and are trending upwards, while the RSI indicator is above the 50 level. On the hourly and 4-hour charts, the Bollinger Bands are widening upwards, with the price trading within the upper half of the band, and the moving average system is also trending upwards. Gold remains bullish!
In the short term, some downward correction is possible, which is normal given Monday's gains of over $100. A short-term technical pullback is reasonable. However, the strength of this correction remains to be seen, as it occurs within a strong uptrend and can unfold in various ways, not necessarily a large price drop, but perhaps a period of sideways consolidation.
If the price quickly completes its technical correction near the short-term support level, then the market may see a period of high-level consolidation or even a second upward move. For support, we're watching the intraday low of 4080 from Monday. If this level holds, the current rebound isn't likely over yet, and we can consider buying on dips near this support level.
Key Levels:
First Support: 4100, Second Support: 4081, Third Support: 4060
First Resistance: 4140, Second Resistance: 4168, Third Resistance: 4192
Gold Intraday Trading Strategy:
Buy: 4090-4095, SL: 4080, TP: 4120-4130;
Sell: 4185-4190, SL: 4200, TP: 4170-4160;
More Analysis →

EUR/USD 4-hour chart Pattern...EUR/USD 4-hour chart:
The current price is around 1.1566.
The chart shows two upward “Target Point” zones marked on the right.
From the markings:
First Target Point ≈ 1.1700
Second Target Point ≈ 1.1890
✅ Targets:
🎯 TP1: 1.1700
🎯 TP2: 1.1890
These appear to be bullish breakout targets based on a descending-trendline break and Ichimoku cloud support.

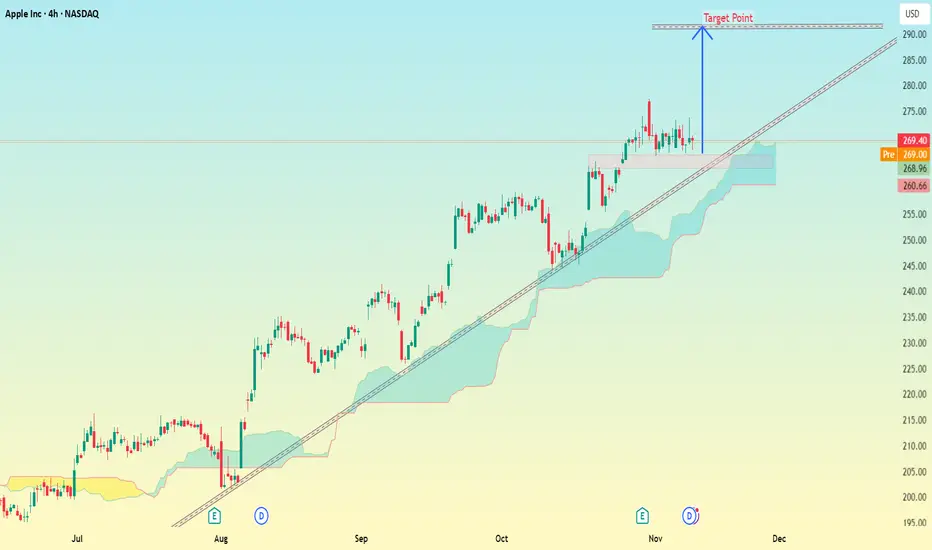
Apple Inc. (AAPL) 4H – NASDAQ chart Pattern...Apple Inc. (AAPL) 4H – NASDAQ chart:
Here’s a detailed read of the setup my drawn 👇
---
🧭 Chart Overview
Current Price: ≈ $269.4
Trend: Strong uptrend (price holding above Ichimoku cloud & rising trendline)
Support Zone: Around $265 – $266 (where price retested the trendline + cloud)
Resistance/Target Box: Marked on my chart as Target Point near the upper trendline.
---
🎯 Target Analysis
My blue arrow points to a resistance zone near the top of the ascending channel.
The Target Point zone is around $285 – $288.
→ That’s roughly +6% to +7% upside from the current level.
---
📈 Summary
Type Level (USD) Notes
Entry (current) 269–270 Price retesting support/trendline
Target 285 – 288 Channel top / bullish target
Stop-loss (recommended) 260 – 261 Below trendline & Ichimoku cloud
---
⚠ Notes
If AAPL closes below $260, this trendline support breaks, and momentum may shift bearish.
But as long as it stays above $265, it looks strong toward $285+.
Watch volume — a breakout above $275 with volume would confirm move to target.
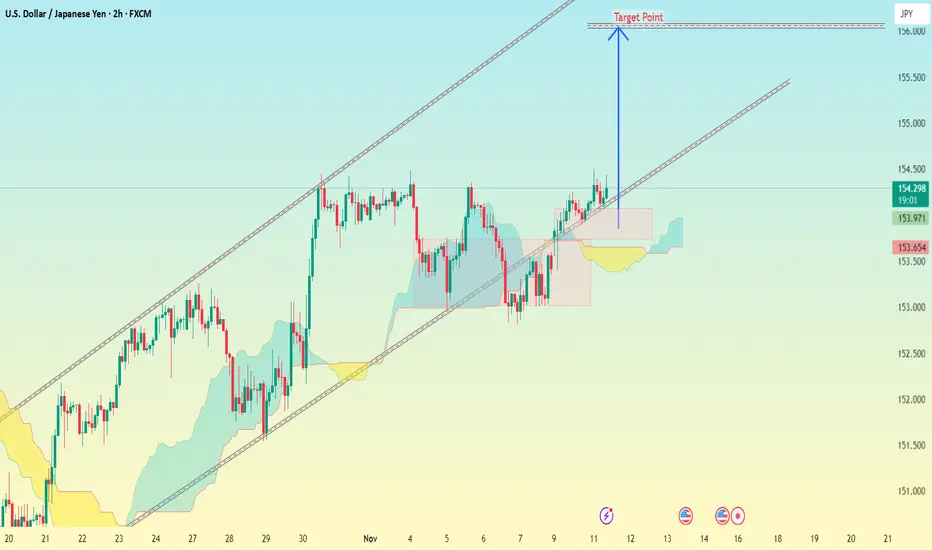
USD/JPY (2H timeframe, FXCM) chart Pattern...USD/JPY (2H timeframe, FXCM) chart:
Here’s the setup my drawn — and what it suggests:
---
🧭 Chart Summary
Current Price: Around 154.31
Trend: Uptrend channel (price moving between two parallel rising lines)
Breakout: Price has bounced above the midline and seems to be heading toward the upper boundary
Ichimoku Cloud: Price is above the cloud → confirming bullish momentum
Box (pink): Indicates previous consolidation or retest zone around 153.6–153.9
---
🎯 Target Analysis
From my chart, the blue arrow labeled "Target Point" points toward the upper trendline of the channel.
Target Zone: Around 155.80 – 156.00
(that’s where my upper channel resistance + target point line meet)
---
📈 Summary
Level Type Target Zone
Entry (current) — 154.3
1st Target Main upward target 155.8 – 156.0
Stop-loss (recommended) Below last swing / cloud 153.5 – 153.6
---
⚠ Notes:
As long as price stays above 153.8, bullish continuation looks strong.
If price breaks below 153.5, this bullish setup becomes weak and might turn sideways or bearish.
I can trail stop-loss once price crosses 155.0.
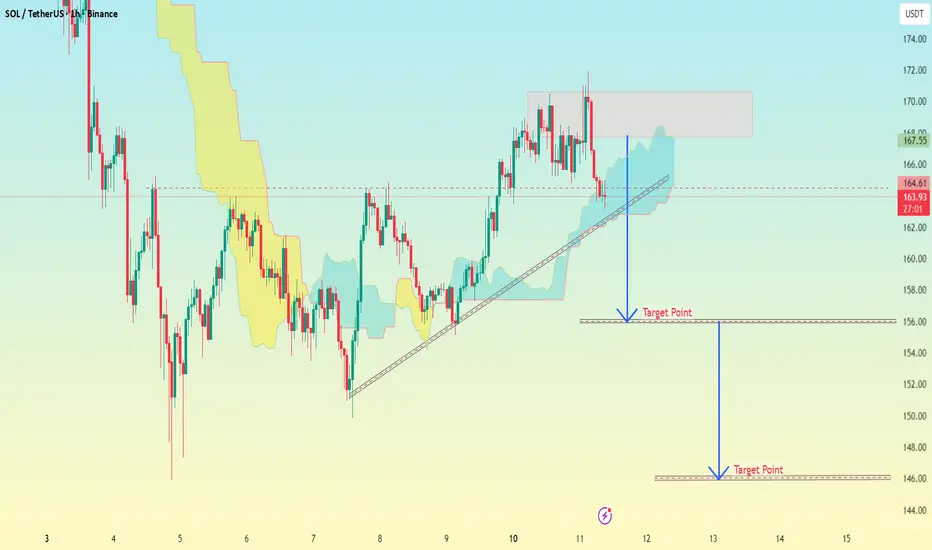
(SOL/USDT 1H timeframe...(SOL/USDT 1H timeframe on Binance):
Here’s what I can interpret from the structure shown:
Current Price: Around $164
Support Trendline: Rising from around $158 → $164 (now price has slightly broken or retested this line)
Resistance Zone: Highlighted in red box near $169–$172
Two Target Points are drawn on the chart:
🎯 Target 1:
The first blue arrow (labeled Target Point) points to around $156.
→ This is likely the first downside target after trendline break.
🎯 Target 2:
The second blue arrow (lower one) points to around $146–$147.
→ This is my extended or final bearish target if the price continues falling.
---
🔍 Summary:
Level Type Target Zone
Target 1 Short-term $156
Target 2 Major target $146–$147
---
⚠ Tip:
If SOL closes below $162 on 1H or 4H candle → high chance to move toward $156.
If it loses $156 support, then $146 becomes realistic.
But if SOL reclaims and closes above $168–$170, the bearish setup fails and bullish continuation toward $174+ can begin.
DeGRAM | GOLD broke a resistance level📊 Technical Analysis
● XAU/USD broke out of a prolonged consolidation and now trades above the key ascending support line near $4,020, confirming bullish structure development. The breakout indicates momentum shift from accumulation to expansion.
● Price targets the $4,138–$4,140 resistance area, where previous supply emerged, suggesting room for an upward move before potential consolidation.
💡 Fundamental Analysis
● Softer U.S. inflation expectations and cooling Treasury yields have supported renewed gold demand as investors rotate toward safe-haven assets.
✨ Summary
● Support: $4,020. Resistance: $4,138. Gold is poised for a medium-term climb while holding above trendline support.
-------------------
Share your opinion in the comments and support the idea with a like. Thanks for your support!

GOLD: Short Trade Explained
GOLD
- Classic bearish setup
- Our team expects bearish continuation
SUGGESTED TRADE:
Swing Trade
Short GOLD
Entry Point - 4134.0
Stop Loss - 4142.2
Take Profit - 4115.5
Our Risk - 1%
Start protection of your profits from lower levels
Disclosure: I am part of Trade Nation's Influencer program and receive a monthly fee for using their TradingView charts in my analysis.
❤️ Please, support our work with like & comment! ❤️

Gold H1 – End of Wave 5: Is a Corrective ABC Coming?⚡ XAUUSD – Elliott Wave Intraday Outlook | 11/11
📈 Elliott Wave Context
Gold has completed a clean 5-wave impulsive structure on the H1 timeframe, with Wave 5 pushing into the premium zone above 4130.
Price now shows early exhaustion at the highs, suggesting the market is preparing to transition into a corrective ABC phase.
A confirmed reversal signal will be:
✅ H1 close below the Wave 2–4 trendline → confirming the start of Wave A.
🔎 Technical Breakdown (Wave Structure)
• Wave 1: Initial rally from 3964
• Wave 2: Shallow pullback near 3985
• Wave 3: Strong impulsive breakout toward 4070+
• Wave 4: Mid-cycle correction holding structure
• Wave 5: Final push topping around 4130–4140 (current swing high)
The 5-wave impulse is now completed → market likely moves into A–B–C correction.
📉 Expected Elliott Wave Path (ABC)
Wave A
• First levels: 4105 (Fibo 0.236)
• Main target zone: 4078 (Fibo 0.382)
Wave B
• Corrective rebound toward
o 4105, or
o 4115–4120
Wave C
• Strongest leg of correction
• Ideal target zones:
o 4035 (Fibo 0.618 retracement of the full 1–5 impulse)
o 4004 (Fibo 0.786 retracement)
• Wave C often ≈ Wave A → aligns with 4035–4004
📌 Intraday Trade Plan (Elliott-Based)
✅ Scenario 1 – SELL the upcoming correction (Preferred)
Entry:
• After H1 candle closes below the 2–4 trendline,
or wait for a Wave B retest into 4105–4120.
Stop Loss:
• Above the Swing High → 4145
Take Profit:
• TP1: 4078
• TP2: 4035
• TP3: 4004
✅ Scenario 2 – BUY only if wave invalidation occurs
If gold breaks and holds above 4145, Wave 5 may be extending.
Entry: above 4145
SL: 4120
TP: 4170–4200
✅ Summary
Gold has finished a textbook 5-wave impulse and is now likely entering a corrective ABC structure.
The highest-probability opportunity today is to sell the Wave B retracement and target deeper corrective zones at 4035–4004.

GOLD surpasses $4,140/ounce, signaling a new cycleOANDA:XAUUSD continued to climb in the Asian session on November 11, trading around $4,148/ounce, up $32 in the morning alone, after rising nearly 3% in the previous session. The two-day rally, the strongest since May, reflects the defensive sentiment of global investors in the face of a weakening US economic outlook and the possibility of the Federal Reserve (Fed) soon shifting monetary policy.
Bloomberg said gold maintained its gains after the US Senate approved a bipartisan deal to end the longest government shutdown in history, supported by President Donald Trump. The bill is expected to pass the House of Representatives this week by a 60-40 vote, paving the way for the resumption of work for hundreds of thousands of federal workers and stalled food aid.
The political situation has eased somewhat, but investors remain cautious. The reopening of the government means that a slew of delayed economic data will soon be released, which could shed more light on the growth picture. Bloomberg analysts said the upcoming data “are likely to show a worsening economic outlook,” reinforcing expectations for a Fed rate cut sooner than expected.
The probability of a 25 basis point cut in December is now above 65%, according to CME's FedWatch tool. Falling bond yields and a weak dollar have pushed money back into gold, the traditional safe haven, especially as the global rate-hike cycle ends and US fiscal risks emerge.
In the international market, gold is still up more than 50% since the beginning of the year, despite a short-term correction last month. Net buying from central banks, especially in Asia and the Middle East, and increased physical gold investment in the private sector, continue to be the core drivers for the prolonged bull cycle.
Commentary: Gold’s Return as a Barometer of US Economic Confidence
Gold’s November rally was more than a short-term political response. It reflected a deeper shift in global market sentiment: that the US dollar is losing its primacy amid rising debt, fiscal spending and domestic political divisions.
While U.S. stock markets hover around historic highs, institutional investors are beginning to rebalance their portfolios in a defensive direction, increasing their exposure to precious metals and government bonds. At the same time, central banks in China, India and Turkey continue to accumulate gold, a move that makes both financial and geopolitical sense, as they seek to reduce their dependence on the dollar payment system.
If the Fed does ease later in the year, gold could consolidate above $4,000 an ounce as a new price level, while risk assets face correction pressure. In an era where U.S. financial stability is no longer a given, the precious metal is returning to its old role as a gauge of confidence in the U.S. currency and government.
Technical analysis OANDA:XAUUSD
Gold prices are consolidating above the $3,970–$3,850/oz support zone, after bouncing back from the 0.382 Fibonacci line ($3,972) and remaining within the rising price channel (channel a) formed since July. The price structure suggests that a correction has been completed, as the recovery in buying pressure pushed the price above the short-term MA around $4,055, towards the 0.236 Fibonacci level at $4,128, which is currently a key short-term resistance zone.
The RSI has recovered from the 40 zone to near 60, indicating a return of bullish momentum, while recent daily candles have all closed above the medium-term uptrend line. A firm close above $4,130 could confirm the bullish trend, opening a new bullish cycle with the next target at $4,216, and further to the $4,380/oz zone, the upper end of the current price channel. Conversely, a loss of $3,940 would weaken the bullish structure and send gold back to the $3,850–$3,870 accumulation zone.
• Observation:
Gold is showing signs of forming a new base above the $4,000 area, reinforcing the scenario of a medium-term bullish cycle if it breaks the $4,130 resistance. Short-term profit-taking pressure may appear, but the main trend is currently leaning positive in the second half of November.
SELL XAUUSD PRICE 4180 - 4178⚡️
↠↠ Stop Loss 4184
→Take Profit 1 4172
↨
→Take Profit 2 4166
BUY XAUUSD PRICE 4088 - 4090⚡️
↠↠ Stop Loss 4084
→Take Profit 1 4096
↨
→Take Profit 2 4102

XAUUSD: Market Analysis and Strategy for November 10thGold Technical Analysis:
Daily Resistance: 4145, Support: 3930.
4-Hour Resistance: 4085, Support: 4017.
1-Hour Resistance: 4085, Support: 4046.
Gold's current upward momentum is driven by a combination of factors: a weakening dollar, uncertainty surrounding the previous government shutdown, and geopolitical concerns, creating a perfect safe-haven storm.
Technically, the bullish outlook remains on longer timeframes such as the monthly and weekly charts, with clear bottom support. Rising expectations of a Fed rate cut further fuel this bullish sentiment. The weak dollar index supports gold prices, while weak employment data and a collapse in consumer confidence reinforce the narrative of an economic slowdown. With the US government reopening imminent after voting, previously missed data releases will cause significant volatility. Pay close attention to the implementation of the government reopening agreement; short-term safe-haven demand is unlikely to subside. Geopolitically, the ongoing conflict between Russia and Ukraine, the escalating Israeli-Palestinian conflict, and the renewed threat from the Houthis are multiple powder kegs increasing global political uncertainty.
Gold has broken out of its recent trading range on the daily candlestick chart, allowing for trend-following trading. On the upside, the key level to watch is 4080/85; whether it can hold is crucial for further bullish moves. A short-term "rounding bottom" pattern is quite evident on the daily chart. On the downside, watch for a retest of the 4000 level.
Looking at the 1-hour chart, the moving averages are in a bullish alignment, and support levels are moving higher. During the European and American sessions, focus on the continuation of the upward trend, paying attention to whether it can hold above 4080. Support is seen around 4055/4050.
Trading Strategy:
BUY: 4055~4050
BUY: 4018~4015
SELL: 4141~4150
More Analysis →

XAU/USD – Ahead of U.S. Data: Continuation or Reversal?🌐 MARKET CONTEXT
The gold market is currently navigating a juncture of competing forces: on one hand, the continuing expectation of central bank pivoting and safe-haven demand; on the other, risks from a stronger U.S. dollar and higher real yields. For instance, recent commentary highlighted that gold broke above ~US$4,074-oz amid weak U.S. data and growing hopes of a Fed rate cut.
OneRoyal News
+2
ODI: Think change
+2
Additionally, the milestone of gold surpassing US$4,000 per ounce has underlined both its strong momentum and the questions about whether this is a sustainable trend or ripe for a pullback.
World Gold Council
+1
From a sentiment standpoint:
The risk-on component: if data disappoints, gold could rally further.
The risk-off / hawkish policy risk: if inflation or jobs data surprise to the upside, the dollar and rates may rise, weighing on gold.
For the upcoming London → New York sessions, focus is on how gold reacts around major technical zones, and whether price structure shows continuation or reversal.
Thus, the bias today is conditional bullish, leaning long on confirmed demand zones, but ready to flip to bearish if supply zones trigger rejection.
📉 TECHNICAL ANALYSIS (SMC + Liquidity Structure)
The price is in a broader up-trend (following the breakout above key resistance zones) but is now entering high-probability structural decision zones.
We have clear Supply and Demand zones:
Some prior Resistance turned Support zones around ~4,021-4,074 (per recent reports) act as demand/higher-probability buy areas.
OneRoyal News
+1
A supply zone around ~4,080 and above is noted as a target and potential reversal area if momentum falters.
OneRoyal News
+1
Regarding SMC confirmations: look for liquidity sweeps (stop-loss hunts), fake BOS (Break of Structure), or mitigation before entering. A clean confirmation before a trade increases probability.
Example: If price rises into 4,080-4,078 and then sweeps above 4,086 then reverses, that may signal a “trap buy and sell” scenario (structure break then reversal). Conversely, if price dips to 3,990-3,988 or 3,930-3,928 and shows a sweep of liquidity then a strong bullish candle, we may have a CHoCH and continuation long.
🔑 KEY PRICE ZONES
4,080–4,078 ▶️ Sell Zone – High-probability supply nearest to session high, look for rejection.
4,161–4,163 ▶️ Buy Zone – A higher demand zone / breakout target area acting as strong structural bounce.
4,081–4,083 ▶️ Buy Zone – Demand zone near current structure, reactive long setup if confirmed.
3,990–3,988 ▶️ Buy Zone – Deep demand/support zone for larger reversal potential.
Stop-loss levels:
Sell stop-loss: 4,086
Buy stop-loss (4,161 zone): 4,155
Buy stop-loss (4,081 zone): 4,075
Buy stop-loss (3,990 zone): 3,982
⚙️ TRADE SETUPS
✅ BUY SCENARIO 1 – STRUCTURAL SUPPORT HIGH TARGET
Entry: 4,161–4,163
Stop-loss: 4,155
TP1: ~4,180 TP2: ~4,210 TP3: Open
Logic: A breakout into this zone or strong bounce from it would indicate continuation of bullish momentum and structural demand dominance.
✅ BUY SCENARIO 2 – MID-STRUCTURAL DEMAND
Entry: 4,081–4,083
Stop-loss: 4,075
TP1: ~4,100 TP2: ~4,135 TP3: Open
Logic: A reactive long setup if price pulls back to this zone and confirms demand (liquidity sweep + bullish candle). Good London session focus.
✅ BUY SCENARIO 3 – DEEP SUPPORT ACCUMULATION
Entry: 3,990–3,988
Stop-loss: 3,982
TP1: ~4,020 TP2: ~4,060 TP3: 4,100+
Logic: Larger-scope reversal zone, ideal if price falls into this area and shows structure change (CHoCH) from bearish to bullish.
⚠️ SELL SCENARIO – SESSION SUPPLY REJECTION
Entry: 4,080–4,078
Stop-loss: 4,086
TP1: ~4,040 TP2: ~3,990 TP3: ~3,930
Logic: If price rises into this supply zone and shows rejection (e.g., wick up, reversal candle) then expect a short. Especially potent during New York session when liquidity is high.
🧠 NOTES / SESSION PLAN
Prioritize confirmation: don't enter solely on touching zone — wait for structure (M5/M15) and liquidity event.
London session: likely focus on BUY setups (4,081 zone, 3,990 zone).
New York session: monitor for the SELL setup at 4,080–4,078 if price approaches.
Monitor macro data releases (U.S. inflation, job numbers) which could provoke volatility and invalidate setups.
Risk management: each trade should respect stop-loss and maintain risk ≤2% of account; trail stops once TP1 hits.
Avoid chasing after large rapid moves; allow the market to structure into zones rather than predicting broken conditions.
🏁 CONCLUSION
The bias for today: bullish conditional — we favour buys on confirmed demand zones (4,161–4,163; 4,081–4,083; 3,990–3,988) but remain alert for a bearish reversal if price exhausts into the supply zone around 4,080–4,078 with clear rejection. Today’s structure offers a wide range of actionable zones; success will depend on discipline to wait for confirmation and managing risk strictly.
