Gold (XAU/USD) – Technical Outlook and Trade Plan for TodayGold continues to move inside a well-defined range after rejecting the 4048 resistance zone. The price action has completed a corrective “M-pattern” structure, hinting at potential downward pressure if buyers fail to hold above the 4030–4040 area.
Technical Breakdown
Key Resistance: 4048 – 4055 (previous swing high and Fibonacci retracement 0.786)
Immediate Support: 4000 – 3985 (mid-range liquidity zone)
Major Support Zone: 3920 – 3900 (target from projected harmonic leg)
EMA(9): Currently at 4033, acting as short-term dynamic support
Market Context
The recent bullish impulse appears exhausted as momentum slows near the upper boundary of the range. The RSI (H1) shows early signs of bearish divergence, confirming that buyers are losing strength. If the price closes below 4020, it could trigger a new wave of selling toward the 3950–3920 area.
Trading Strategy
Scenario 1 – Bearish Setup:
Sell below 4020 with targets at 3985 and 3920. Stop-loss above 4055.
Scenario 2 – Bullish Breakout:
A confirmed breakout and retest above 4055 could extend to 4088–4100.
Bias: Short-term bearish while below 4055.
Conclusion
Gold remains inside a corrective phase after testing upper resistance. Unless bulls defend 4030 strongly, bears may take control and drive price back to the lower boundary around 3920.
Keep this analysis saved and follow for more daily trading strategies and Fibonacci trendline setups to stay ahead of market moves.
Gold

Gold (XAUUSD): High R/R risky sellGold (XAUUSD): High R/R risky sell. Let's see if this setup works. go with low volume so you don't lose anything.
Cheers

We recommend buying gold on dips.Gold maintained a wide trading range, with a slight increase on Friday's daily chart. The price found support above the 5-day moving average, with the 10-day and 7-day moving averages around 3980. The RSI indicator is running above the midline. On the shorter-term 4-hour and hourly charts, the Bollinger Bands are expanding upwards, with the price trading near the upper band. Gold is currently near the upper edge of the trading range at 4050!
Looking at the 1-hour chart, the previous upward trend in gold has been broken. A strong rally to 4050 occurred during the Asian session, but the overall support level for gold is at 3965. Therefore, the upside potential for gold is likely to continue, but attention should be paid to key support levels. Buying on dips is recommended. In terms of trading volume, Friday's volume was relatively balanced, so we need to pay attention to whether there will be a further increase in volume. This would indicate a potential turning point in the gold market, with a possible larger short-term rise.
Key Levels:
First Support: 4030, Second Support: 3992, Third Support: 3975
First Resistance: 4046, Second Resistance: 4075, Third Resistance: 4140
Gold Trading Strategy:
Buy: 3975-3980, SL: 3965, TP: 4000-4010;
Sell: 4075-4080, SL: 4090, TP: 4060-4050;
More Analysis →

A Detailed Report on the Gold Market Until the End of December A Detailed Report on the Gold Market Until the End of December 2025
Fundamental Analysis (Fundamental Analysis)
Gold witnessed a record surge during 2025 that made it one of the best-performing assets, with its price exceeding $4,000 per ounce and delivering roughly 50% annual gains through October. This jump is attributed to a mix of economic and political factors that strengthened the appeal of the precious metal as a safe haven. Below are the most prominent fundamental factors affecting the gold market in the current period (November – December 2025):
Federal Reserve policy and rate decisions :
After a long tightening cycle during 2022–2024, the Federal Reserve reached peak interest rates and began shifting toward easing in late 2025. Investors expect the Fed to cut rates by 25 basis points at its upcoming December meeting, following a similar cut in late October. Although the Fed cut rates in October, Jerome Powell’s tone was hawkish, which limited the positive effects of the cut and gave the dollar a temporary boost. In general, falling interest rates (and a lower real yield) support gold since it is a non-yielding asset, while higher rates weigh on it. For this reason, expectations for the start of a rate-cut cycle pushed gold higher this year, whereas any hawkish signals or rate hikes could weaken the metal’s bullish momentum.
Economic data (inflation, growth, unemployment) :
U.S. inflation slowed to about 3% in the fall of 2025—slightly above the Fed’s 2% target. Although it has moderated compared with the 2022 peak, inflation remains above target, keeping the focus on interest-rate policy. The labor market shows unemployment near 4% with a slight uptick during 2025, indicating moderate economic activity. Economic growth faced pressures due to prior monetary tightening and geopolitical uncertainty, prompting analysts to talk about mild stagflation risks. The latest inflation and employment data will play an important role in guiding Fed expectations, and thus gold’s movement through the remainder of the year.
Geopolitical tensions and global conflicts :
Rising geopolitical tensions were a key driver pushing gold prices higher. The ongoing war in Ukraine and instability in parts of the Middle East reinforced safe-haven demand. But the most notable development came on the U.S.–China front: U.S. President Donald Trump reignited the trade war in October by announcing 100% tariffs on China, sparking a wave of concern that propelled gold above $4,000 for the first time. This escalation drove investors strongly into gold and accelerated its climb. Later, in late October, there was a surprising breakthrough with the announcement of a trade truce between Washington and Beijing, including a one-year deal on rare earths, a reduction in some tariffs, and increased purchases of U.S. soybeans. This de-escalation trimmed geopolitical/trade fears and softened safe-haven demand for gold toward the end of the month. Additionally, other political factors—such as the U.S. government shutdown that occurred in early October—affected markets; as the shutdown entered its seventh day, economic uncertainty increased, adding another factor that sped up gold’s rise. On the other hand, Europe saw political tensions such as a government crisis in France, which contributed slightly to higher gold demand. In short, any renewed escalation—whether war, trade disputes, or political crises—would support gold, while any de-escalation or diplomatic solutions could ease the bullish momentum.
U.S. Dollar Index (DXY) :
Gold typically moves inversely to the dollar. In 2025, the dollar came under pressure and fell by about 10% against major currencies, making gold cheaper for holders of other currencies and boosting demand. For example, when Trump warned of escalating the trade war in October, the dollar fell by about 0.5% immediately, supporting gold’s climb to new highs. But late in the month, with signs of a trade agreement and the Fed’s hawkish tone, the dollar rebounded, weighing on gold. The dollar’s recent strength—though temporary—drove gold to correct below $4,000 for a time. Overall, a weaker dollar lifts gold and the opposite is true; therefore the DXY’s path in the coming weeks—whether it continues to decline or rebounds supported by monetary policy—will be a decisive factor for gold’s movement.
Equity and bond markets :
Gold’s relationships with stocks and bonds in 2025 were shaped by economic uncertainty. During risk-off periods and equity market declines (such as on days of trade escalation), gold rose as investors rotated into safe havens. Conversely, with positive news and a return of risk appetite, we saw Wall Street rally and safe-haven demand for gold ease. For example, news of the trade truce and positive earnings from tech firms pushed the S&P 500 and Nasdaq higher in late October, coinciding with gold falling about 8% from its peak. U.S. bond yields had a dual effect: rising yields (from hawkish Fed expectations or higher inflation) increase the opportunity cost of holding gold and pressure its price. This occurred partly during the recent correction as Treasury yields reached relatively high levels, making bonds more attractive versus gold. By contrast, falling yields on expectations of rate cuts support gold—and we saw this for most of 2025 as the Fed kept rates elevated and then hinted at cuts, which lowered real yields and sent gold sharply higher. In short, any disruption in stocks or a drop in yields will be positive for gold, while persistent gains in stocks or yields may cap its upside temporarily.
Demand from central banks and institutions :
Global central banks have been buying gold at historic levels from 2022 through 2025 as part of a strategy to diversify reserves away from the dollar. They have been purchasing more than 1,000 tons of gold annually—double the previous decade’s average—to hedge against sanctions and inflation and reduce reliance on dollar assets. In 2025, this strong pace continued, providing structural support for the gold market (especially with record purchases from countries such as China, Kazakhstan, and Poland). Gold-backed ETFs likewise saw massive inflows from Western investors this year, with inflows exceeding $64 billion through Q3 2025—a record above the pandemic peak. This institutional investment demand reinforced the uptrend and helped gold break past prior price forecasts. Analysts, however, warn that a resolution of major conflicts (such as a final settlement to the war in Ukraine or in the Middle East) could reduce the hedging motives of central banks and investors. For now, official and investment demand remains a structural support for the market in the medium term.
Other factors :
U.S. public debt has risen to unprecedented levels ($36 trillion), raising concerns about fiscal sustainability, weakening long-term confidence in the dollar, and pushing some investors toward gold as a hedge. We also saw debates over the Fed’s independence and political pressures on it—especially under a new administration—which added to the motivations to hold gold as a hedge against any unconventional monetary policies. These structural factors (huge debts, erosion of confidence in the dollar, political risks) strengthened the notion of a re-evaluation of gold in the global financial system and made the yellow metal a focal point of financial debate in 2025 after decades of relative neglect.
Financial institutions’ forecasts for gold prices (November – December 2025)
Despite gold reaching historic levels this year, most houses remain cautiously optimistic about its performance for the rest of 2025. The current consensus points to gold trading between $3,800 and $4,000 on average during November and December. Forecasts also see the possibility of temporary rallies above $4,100 if the pace of U.S. rate cuts accelerates or if geopolitical conditions worsen again. Conversely, any political calm and continued monetary hawkishness may keep gold below $4,000 and perhaps push it toward the key $3,800 support. The main bank and institutional forecasts are as follows:
Goldman Sachs: Goldman Sachs remains the most bullish bank on gold. It raised its medium-term price forecast and expects gold to reach around $4,900 by December 2026. In the near term, Goldman sees scenarios in which gold could reach $5,000 if the Fed’s independence comes under pressure and investors shift just 1% of the U.S. bond market ($57 trillion) into gold. For the short term (end-2025), Goldman and other analysts estimate a range between the high $3,000s and low $4,000s, with potential upside if economic or political conditions deteriorate unexpectedly.
J.P. Morgan: J.P. Morgan adopted a strongly positive view of gold in 2025, considering it a high-conviction investment this year. It expects the uptrend to continue, supported by the onset of a U.S. rate-cut cycle. In its latest reports (October 2025), it maintained a long-term bullish view, expecting gold to average about $5,055 by Q4 2026. This aligns with its view that the move above $4,000 resulted from an economic cycle that will last for years. In the nearer term, the average of banks’ forecasts at the start of the year for 2025 quarters was about $3,400–$3,700, which gold has already exceeded. J.P. Morgan did not issue a specific number for end-2025 in its latest report, but it emphasized ongoing supportive factors (investor and central-bank demand) and favored further upside as the Fed begins easing policy.
Citi and HSBC: Banks such as HSBC and Citigroup took a more cautious approach after the recent jump. HSBC raised its average 2025 gold price forecast by only about $100 to $3,455 per ounce, implying prices remain near current levels on average (this figure is well below the current spot price above $4,000 because it’s an annual average). HSBC also sees the possibility of gold reaching $5,000 in 2026 if supportive factors persist. Citigroup, for its part, indicated that it trimmed its short-term forecasts slightly after gold rose above $4,300 and then declined, viewing part of the rally as exaggerated and temporary amid geopolitical panic. Overall, these institutions described the recent pullback below $4,000 as a healthy correction after a rapid rise, advising investors to act cautiously (lighten positions to lock in profits or hedge) while being ready to buy again at lower levels.
Other banks: Deutsche Bank raised its 2026 gold forecast to $4,000 (from $3,700 previously) in light of strong official demand and tight recycled supply. Standard Chartered expects the average price to be $4,488 in 2026 with momentum continuing, supported structurally. Bank of America and UBS, among others, became more positive than they were at the start of 2025, with medium-term forecasts clustered between $4,200–$4,300 by 2026. Overall, the broad consensus is that gold will hold strong levels for the rest of this year, with a likely trading range between $3,800–$4,300—unless exceptional events push it outside this range. Out-of-consensus scenarios include negative inflation surprises or major geopolitical crises that could drive it toward testing $4,500 soon, or, conversely, strong growth data or major conflict resolutions that could pull it down toward $3,600–$3,700. But most analysts lean toward gold being relatively stable around current levels with a slight upward bias through the end of 2025.
Technical Analysis (Technical Analysis)
On the technical front, gold’s movement has been strongly bullish in recent months, interspersed with short, sharp corrections. Below we review price action and trend across several time frames—from the long frame (6 months) down to 5 minutes—with key support and resistance levels for each, along with near-term and year-end scenarios.
6-Month frame (semiannual): The semiannual chart (last 6 months) shows a strong, sustained uptrend for gold. During this period, price advanced about +21% (from ~$3,300 to >$4,000), posting a new all-time high around $4,381 per ounce in mid-October. This time frame indicates that gold has been forming successive higher lows and higher highs since mid-2025, confirming a long-term uptrend. Indicators on this horizon (such as long-term moving averages) support the continuation of the broader uptrend, with price still above most major averages. The most important supports on the semiannual frame are around $3,800–$3,830 (the latest main correction band), then $3,600 in case of a deeper decline. These levels are potential rebound zones as prior peaks turned into support. The clear resistance on this frame is the recent ATH at $4,381; a break above it would suggest the uptrend is continuing toward new targets, possibly psychological handles like $4,500 and above. Overall, the semiannual trend remains bullish unless price breaks below the $3,600–$3,800 support, which could signal a shift in the bullish structure.
3-Month frame (quarterly): Over the last 3 months, gold continued higher but at a slower pace as volatility increased. It opened near $3,860 three months ago, climbed to the $4,381 high, then pulled back to close near $4,000 at the start of November. This suggests the net quarterly gain was limited (~3.7%) due to the recent correction that erased part of the advance. On this frame, gold entered a corrective/sideways phase after its peak, forming a range between roughly $3,820 (quarterly support) and $4,100 (nearby quarterly resistance) in recent weeks. The nearest support on the quarterly chart is $3,820–$3,830 (roughly the October low), followed by $3,700–$3,750 if the correction deepens. On the other hand, immediate resistance sits around $4,070–$4,100 (a level that saw a bounce during the latest decline). A clear break above $4,100 could open the way to re-test the ATH at $4,380. The trend on this frame is broadly bullish but with weakened momentum lately.
1-Month frame (monthly): Looking at the monthly chart (monthly candles), we can see more detail for October and early November 2025. October’s candle was striking: it opened around $3,500–$3,600, then surged to the $4,380 high before closing near $4,000. This monthly candle formed a pattern akin to a “Shooting Star” with a long upper shadow, reflecting selling pressure in the second half of the month. Key monthly support lies around $3,800, then $3,600 as a lower support. Monthly resistance is naturally the $4,380 high.
1-Week frame (weekly): The weekly chart highlights movement in recent weeks. After a series of consecutive weekly gains, we saw a weekly reversal starting from the third week of October. Gold posted losses for two consecutive weeks by the end of October. The bearish candles indicate that price entered a short-term correction. The nearest important weekly support is $3,880 (last week’s low), followed by $3,800 as a strong support to watch, while weekly resistance is currently around $4,100–$4,110.
Summary of short-term technicals:
Daily (1D): The daily chart reveals recent moves in detail. After hitting the $4,381 peak, gold entered a short-term downtrend and bottomed near $3,997. Currently, price is trying to hold above the $4,000 level. The nearest daily support is $3,960–$3,980, then the stronger support around $3,900. Daily resistance is at $4,050–$4,070. The short-term trend is sideways with a slight bullish tilt.
4-Hour (4H): Price has formed a small double bottom around the $3,950–$3,980 area. Gold is currently moving in a tight sideways range between that support and the $4,050–$4,080 near-term resistance. The 4H trend is consolidation with a bullish bias.
1-Hour (1H): The hourly chart shows a series of minor rising highs and lows, indicating gradual recovery. Very close support is $4,000, then $3,980. Hourly resistance is $4,060, then $4,100. The current move is a slight corrective uptrend (minor uptrend), but relatively weak.
Short frames (30, 15, 5 minutes): On these intervals, gold is oscillating in a defined, narrow range, often between $4,000 and $4,050, awaiting a catalyst to break the current choppiness. The trend on these frames is broadly neutral.
Summary table – support/resistance levels and trend by time frame
/*
Summary table — support/resistance levels and trend by time frame
+------------------------+--------------------------------------+-----------------------------------------------+----------------------------------------------+
| Time Frame | Current Trend | Nearest Support | Nearest Resistance |
+------------------------+--------------------------------------+-----------------------------------------------+----------------------------------------------+
| 6 months (semiannual) | Strong uptrend (long-term trend) | $3,800-$3,830 (major) / $3,600 (next) | $4,380 (ATH) / $4,500 (psych.) |
| 3 months (quarterly) | Broadly bullish; slowing momentum | $3,820 (correction low) / $3,700 (lower) | $4,070-$4,100 (immediate) / $4,380 (ATH) |
| 1 month (monthly) | Bullish; signs of exhaustion | $3,800 (strong) / $3,600 (lower) | $4,380 (Oct high) / $4,500 (target if break) |
| 1 week (weekly) | Up overall; corrective now | $3,880 (last weekly low) / $3,800 (pivot) | $4,100 (weekly) / $4,380 (major/ATH) |
| 1 day (daily) | Choppy; slight bullish bias | $3,960 (daily) / $3,900 (strong) | $4,070 (daily) / $4,150 (higher) |
| 4 hours (4H) | Sideways; bullish tilt | $3,950 (intraday) / $3,900 (secondary) | $4,050 (immediate) / $4,120 (next) |
+------------------------+--------------------------------------+-----------------------------------------------+----------------------------------------------+
*/
Expected weekly trend and end-2025 scenario
Weekly scenario (first week of November):
Gold will likely see steady performance with a chance of a slight rise. After its recent decline, the yellow metal appears to be in a phase of regrouping strength. The most likely outcome is that gold will fluctuate within a defined range, perhaps between $3,900 as support and $4,100 as resistance, with attempts to break higher. The nearer scenario is range-bound trade with a bullish tilt.
End-2025 scenario:
As we approach the end of December 2025, expectations vary. The most likely scenario is that gold remains within a relatively wide range of about $3,800 to $4,400 through the end of December, with an overall bias toward moderate gains. We may see gold attempt to re-test its all-time high at $4,380 during November or December if strong catalysts emerge. A slide below $3,800 would mean the market is entering a deeper correction. Therefore, it is more likely that gold stays above $3,800. A realistic end-2025 outcome could be a price near $4,100–$4,200 per ounce. In sum, the overall trend through the end of 2025 leans toward moderate upside with the possibility of a record annual gain for gold, but within a volatile trading framework.
Relationship with other markets and channels of mutual influence
There are important correlations between gold and several other markets (currencies, interest rates, equities) that play a role in its price action. Details follow:
Gold’s relationship with the U.S. dollar (USD & DXY): Historically, gold is inversely correlated with the strength of the U.S. dollar. In 2025, this correlation was clear; the roughly 10% weakening of the dollar over the year was one of the reasons for gold’s strong rise. Any significant dollar rally could cap gold’s advance, while continued dollar weakness or further declines would create a favorable environment for gold to resume rising.
Gold’s relationship with U.S. interest rates and bond yields: The level of real interest rates is among the most important determinants of gold’s price. When Treasury yields rise, holding gold becomes less attractive. Conversely, rate cuts and falling yields strongly support gold. Gold’s direction in the coming months will be inversely linked to the path of interest rates.
Gold’s relationship with equities (S&P 500 and Nasdaq): Gold is inversely related to equities in a risk-appetite context. During market turmoil and falling stocks, demand for gold as a hedge increases, pushing its price higher. This pattern appeared several times in 2025. Through the end of 2025, if equities remain strong, gold may struggle to surpass its recent highs, while any pullback in stocks (even a moderate one) will support gold.
Conclusion
The gold market in the final months of 2025 remains in investors’ sights given its large gains and the surrounding uncertainties. The fundamental analysis points to a mix of supportive drivers (monetary easing, political risks, investment demand) and opposing ones (profit-taking, potential dollar strength). Technical analysis confirms that the broader trend is up, but the market is currently in a phase of correction and consolidation. A breakout from the current range is likely to be decided by upcoming Fed decisions and developments in trade and geopolitics. Investors are advised to monitor these factors closely and remain flexible, as gold continues to be a strategic hedge in an unstable global environment.
Sources
Official news and reports (Federal Reserve, BLS, BEA) in addition to analyses from financial agencies such as Bloomberg, Reuters, Investing, Forex Factory, and others were relied upon to ensure the accuracy of the information and forecasts above.

GOLD LOCAL BEARISH BIAS|SHORT|
✅XAUUSD is reacting from a premium supply zone after a buy-side liquidity sweep. A retracement toward inefficiency below 3980$ remains probable as smart money seeks to rebalance price delivery. Time Frame 2H.
SHORT🔥
✅Like and subscribe to never miss a new idea!✅

THE KOG REPORT THE KOG REPORT:
In last week’s KOG Report we wanted to stick to a similar plan from the week prior, looking for price to attempt either the high to short it again, or, for price to attempt to break the lower box and then give us the opportunity to long again. We had to switch to intra-day trading during the week due to the ranging and as usual, the indicators worked well giving us some good trades and we near enough got what we wanted from the KOG report analysis and the red box targets published.
So, what can we expect in the week ahead?
Potential for this range to continue during the first half of the week with the immediate resistance above at 4006-10 which will need to break in order to target the 4030 level which is what we’re looking for. For this to happen, support 3990 needs to hold us up and if we can push upside it’s that 4030 level we want to keep an eye on. Rejection there can again lead to another swoop of the lower regions but, we need to keep in mind that red box below. That is the key level of defence for the early part of the week and will need to break!
The indicators are suggesting lower at the moment but we need more confirmation and we also need to see if they fill the void left over above from Friday.
In our opinion, another choppy week ahead, more ranging and whipsawing while we accumulate and await that clear confirmation of direction. Until then, it’s level to level and intra-day Red box trading for us.
RED BOXES:
BREAK above 4004 for 4010, 4014 and 4030 in extension of the move
BREAK below 3990 for 3985, 3979, 3970 and 3965 in extension of the move
Many of you have asked what the “Bubbles/circles” are on the chart! These are the hot spots we have been sharing with you that work well as RIPs! We share the monthly results and daily hot spots and I’m sure our traders will agree, they are powerful!
Please do support us by hitting the like button, leaving a comment, and giving us a follow. We’ve been doing this for a long time now providing traders with in-depth free analysis on Gold, so your likes and comments are very much appreciated.
As always, trade safe.
KOG

GOLD Will Fall! Sell!
Hello,Traders!
GOLD smart money tapped into a premium supply zone, engineering liquidity above equal highs before reacting lower. Expect price to deliver downside toward the next demand imbalance. Time Frame 2H.
Sell!
Comment and subscribe to help us grow!
Check out other forecasts below too!
Disclosure: I am part of Trade Nation's Influencer program and receive a monthly fee for using their TradingView charts in my analysis.

XAUUSD – Weekly Trade Plan(Nov 10 → Nov 14, 2025)
Bias: Neutral–Bullish, focusing on reaction zones between key supply and demand levels.
🌐 MARKET CONTEXT
Overview: After a strong rally earlier in Q4, Gold is now consolidating around the $4,000 zone, reflecting the tug-of-war between Fed rate-cut expectations and upcoming U.S. inflation data (CPI & PPI).
Sentiment: Current sentiment leans slightly risk-off, as U.S. yields remain elevated, but safe-haven demand for Gold persists.
Expectations: The market is likely to remain range-bound / corrective until a clear macro catalyst appears.
Main Bias: Prioritize selling from supply zones and buying from demand zones, but always wait for structural confirmation (CHoCH / BOS) before entering.
📉 TECHNICAL ANALYSIS (SMC + Liquidity Structure)
Structure: The market is moving in a sideways H4 range between 3,930 and 4,130.
Liquidity focus:
Above 4,130: Cluster of buy-side liquidity — potential for stop-hunt sweeps.
Below 3,930: Sell-side liquidity, untested low area.
Pattern outlook:
The 4,046–4,052 area has been tested twice, forming a potential mini-distribution zone.
The 3,928–3,930 demand zone remains untested — a possible liquidity sweep before rebound.
SMC Logic:
A fake BOS / sweep above 4,130 could trigger a strong short setup.
A sweep below 3,930 + CHoCH bullish could confirm a long setup.
🔑 KEY PRICE ZONES
Price Zone Type Description
4,130–4,128 🔻 SELL Zone #1 Major D1 supply zone & liquidity cluster above the range
4,046–4,044 🔻 SELL Zone #2 OB + POC + liquidity trap near previous highs
3,930–3,928 🟩 BUY Zone #1 H4 demand zone + SSL sweep potential
3,922 ⚠️ Stop Threshold Below this, short-term bullish bias invalidated
4,052 / 4,136 🧱 Stoploss Levels Corresponding stops for each sell setup
⚙️ TRADE SETUPS
✅ SELL SCENARIO 1 – HIGH SUPPLY (SWEEP ABOVE RANGE)
Entry: 4,130 – 4,128
Stoploss: 4,136
TP1: 4,046
TP2: 3,995
TP3: 3,930
Logic: Liquidity sweep above the range high, targeting distribution reaction from major supply.
✅ SELL SCENARIO 2 – RANGE SUPPLY REJECTION
Entry: 4,046 – 4,044
Stoploss: 4,052
TP1: 4,000
TP2: 3,930
TP3: 3,928
Logic: OB + VAL + liquidity confluence at top of range; wait for M5 CHoCH confirmation before entering.
✅ BUY SCENARIO – MAIN STRUCTURAL SUPPORT SWEEP
Entry: 3,930 – 3,928
Stoploss: 3,922
TP1: 3,995
TP2: 4,044
TP3: 4,128 (trail)
Logic: Sweep of SSL below previous low → bullish CHoCH confirmation → ideal Smart Money demand entry.
🧠 NOTES / SESSION PLAN
Focus on London session for potential buy setups near 3,930–3,928.
Watch New York session for sell setups at 4,046–4,128, especially if price sweeps liquidity first.
Avoid entering during major CPI / PPI news releases.
Use M5–M15 confirmations (CHoCH, FVG fill) before execution.
Avoid overtrading — wait for clear structural confirmation to reduce stop-hunt risk.
🏁 CONCLUSION
Gold continues to range between 3,930 ↔ 4,130, showing no clear breakout yet.
Primary setups:
Sell from 4,046–4,128, with stops at 4,052 / 4,136.
Buy from 3,930–3,928, with stop at 3,922.
Strategy: Trade both ends of the range with structure confirmation; avoid trading inside equilibrium.
For this week, focus on buy-the-dip below 3,930 and sell-the-rally between 4,046–4,130.

Ending US G. shutdown could bring GOLD to daily support?US government shutdown has slowed longer term trend on XAUUSD with 2 weeks of bearish move finally formed an weekly inside bar which is the lowest volatity in the last 12 weeks! however, as there is bearish rejection, with potential ending of shut down could lead GOLD to drop again to the daily support to 3885.00 or lower?
as 3 weeks price action is showing a continued bearish move, any break from the weekly high, price may bring the price back below the weekly low which potentailly create a lowertimeframe bearish trend.
Therefore, weekly high is to watch for possible rejection, once price rejects, once down trend coinfirms, we will be looking for sell set up to daily support level.

1980 Redux? SILVER set to Outshine the NYSE Composite.Has Silver set the stage to approach its all time high's versus the "Big Index" that was last seen close to 50 years ago.?
Why this chart is spectacular:
Silver has moved sharply higher this year, breaching it's historic $50 threshold, a feat last seen in 1980 and 2011.
Notable the Silver/US Equities ratio (using the TVC:NYA as a broad proxy) is forming a multi year bottom structure. Suggesting we are in the process of a powerful repricing from equities to commodities.
This is not a crash call on Stocks.
Simply put Metals and commodities are just likely be faster horses and receive higher capital allocations.
We've seen the Big short during the GFC.
We've seen Saylor's Big long trade on #BTC
is Silver the Big Reversal?

#DAX at a record ALL TIME HIGHand Yet this move is far from over
My final log target is still 8000 points away.
We are witnessing #Fiat melt away in front of our eyes.
Are you actually making money is the real question?
#gold #silver #bitcoin

GOLD (XAUUSD): Support & Resistance Analysis for Next Week
Here is my structure analysis for Gold for next week.
Support 1: 3868 - 3927 area
Support 2: 3766 - 3830 area
Support 3: 3690 - 3736 area
Resistance 1: 4023 - 4109 area
Resistance 2: 4187 - 4245 area
Resistance 3: 4357 - 4383 area
As we discussed earlier, the price is stuck within a range now
and we see a consolidation.
With the absence of high impact fundamentals, a sideways price action
will likely continue.
❤️Please, support my work with like, thank you!❤️
I am part of Trade Nation's Influencer program and receive a monthly fee for using their TradingView charts in my analysis.

GOLD DAILY CHART ROUTE MAPHey everyone,
Please review our Daily Chart Route Map, now featuring updated levels for tracking Golds movement.
We continue to track our refreshed proprietary Goldturn Channel, our unique method for constructing ascending channels. Price action is now testing the swing range and the swing range seems to be holding support as expected. This swing range support also falls inline with the channel half line providing stronger support.
As long as ema5 remains above the swing zone we expect price to play between this range until the full updated long term swing is completed into 4145. An ema5 break below the swing range will open the lower channel floor for test, currently sitting at 3824
As always, we will keep you all updated with regular updates throughout the week and how we manage the active ideas and setups. Thank you all for your likes, comments and follows, we really appreciate it!
Mr Gold
GoldViewFX

XAUUSD: Buyers Target $4,080 Resistance ZoneHello everyone, here is my breakdown of the current Gold setup.
Market Analysis
Gold (XAUUSD) has recently formed a constructive bullish structure after rebounding from the 3,930–3,960 Buyer Zone, which aligns with the lower boundary of the Upward Channel. This demand zone has consistently acted as a strong accumulation area, indicating that buyers are actively defending it. Prior to this rebound, price moved within a Downward Channel, where several fake breakouts occurred — showing that sellers were gradually losing momentum and failing to maintain downside pressure.
Currently, a breakout from the Downward Channel shifted the market tone, and since then, XAUUSD has started forming higher lows, signaling an early trend reversal. The price is now trading back inside a new Upward Channel, and the structure suggests buyers are preparing for a continuation move. At the moment, XAUUSD is approaching the mid-range of the channel, while the next major resistance sits near 4,130, which previously acted as a supply level and point of distribution.
My Scenario & Strategy
The current setup suggests that as long as price remains above the 3,930–3,960 demand region, the bullish setup remains intact. I expect Gold to continue moving gradually toward the 4,080–4,130 resistance zone in the short term. A confirmed breakout above 4,130 would likely signal strong bullish continuation, opening the way for a larger upward move toward 4,200 and beyond.
However, if XAUUSD breaks back below 3,930, the bullish structure would be invalidated, and price could revisit deeper support levels before attempting another upward leg. For now, I prefer to look for long entries on pullbacks within the channel, targeting a continuation toward the resistance levels mentioned above.
That's the setup I'm tracking. Thank you for your attention, and always manage your risk.

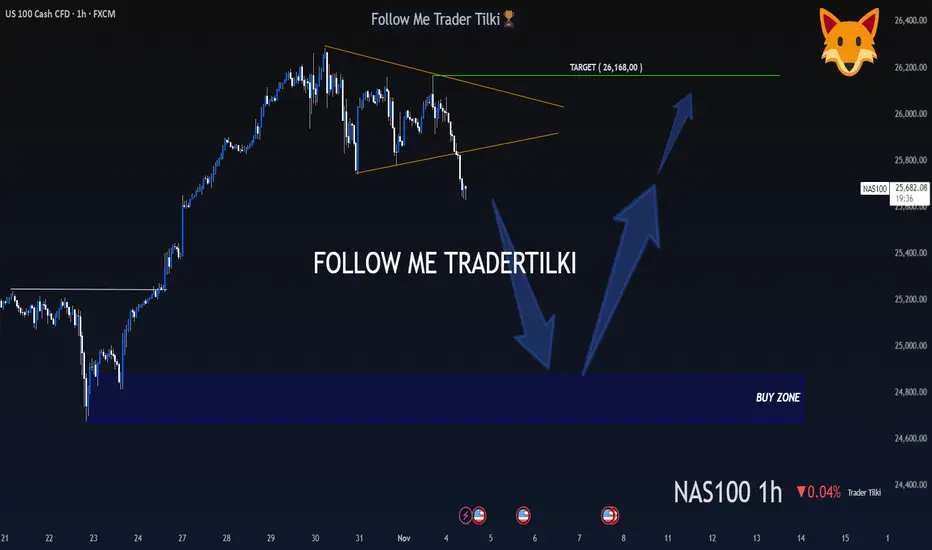
A Hunter Waits Patiently, Then Strikes Like a Lion - US100 - 1HMy dear friends, greetings,
My friends, I have set the buy levels for US100 at 24,872 and 24,677.
I will never enter a trade or put myself at unnecessary risk before these levels are reached.
My friends, in order to consistently win in this market and to become a successful trader, patience is essential.
If you act with patience and strategy, you will always be a winning trader, just like me.
I would also like you to know that my target is set at the 26,168 level.
My friends, every single like from you is my greatest motivation to share these analyses.
I sincerely thank everyone who supports me with their appreciation.
With my respect and love.
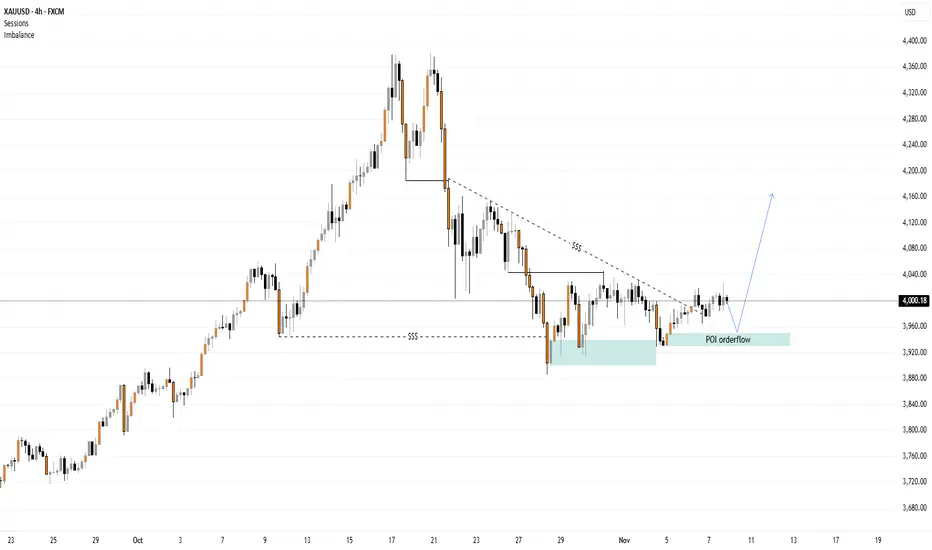
Gold Analysis H4 - Bullish orderflowAfter gold broke below the 3944.48 level, the market initially showed signs of further downside movement, potentially aiming to sweep more liquidity resting beneath that zone. However, the nature of the breakout suggests that it could itself be a liquidity grab rather than the start of a genuine bearish continuation.
The candle that broke this level was quickly rejected, indicating that selling pressure may have been absorbed by strong buy orders. This kind of price reaction often signals the presence of institutional accumulation or smart money activity.
As a result, the order flow now appears to be shifting, potentially preparing for a bullish move. If momentum continues to build, price may aim to sweep the liquidity resting above the trendline before deciding on the next directional move.
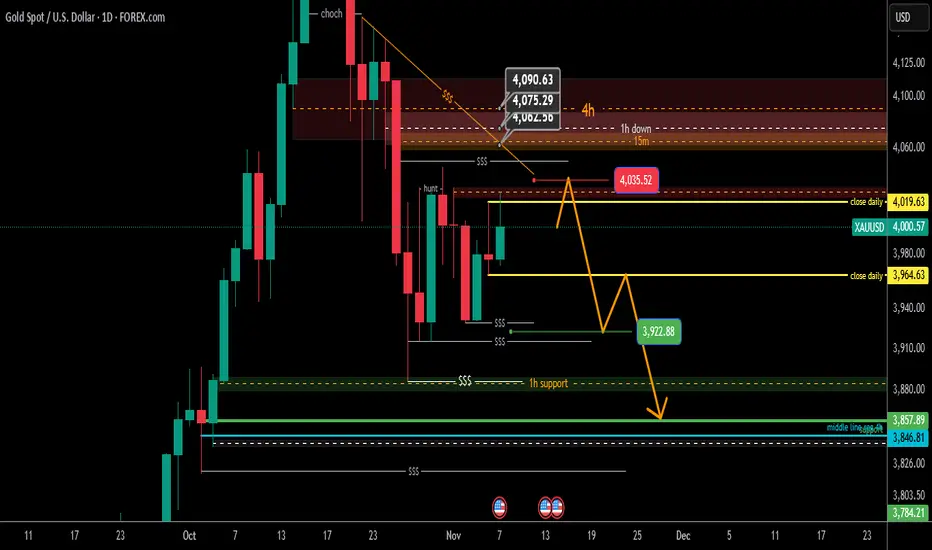
Gold Analysis Daily Time Frame
Hello Traders
Gold is within its daily range (4024 - 3929) and for Monday it will be important whether it can close above or below the marked candle.
I expect a similar move for gold this week, the condition for this move is that the daily candle does not close above 4019, if the Monday candle moves towards 4035 and immediately stabilizes below 4019, this path can be expected to continue until liquidity levels are low.
The three levels of 4062, 4075 and 4090 are still important resistance points, and the market has not yet pulled back to these levels, so the price may be slightly higher than these areas to continue the path. Good luck
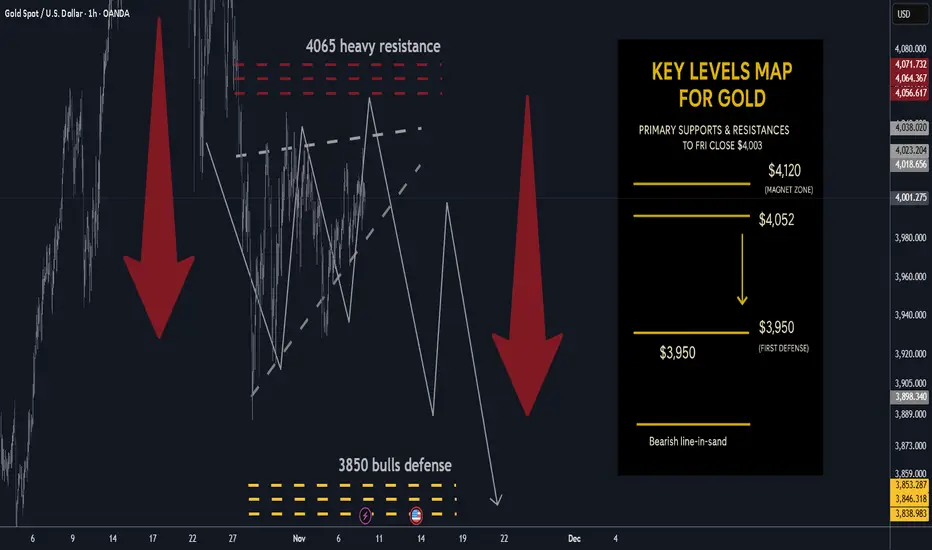
Gold next week: Key S/R Levels and Outlook for Traders🔥 GOLD WEEKLY SNAPSHOT — BY PROJECTSYNDICATE
🏆 High/Close: $4,024.9 → ~$4,003 — sellers faded upticks; weekly close soft but back above the round $4k.
📈 Trend: Neutral / mild correction inside range; not expecting immediate new highs while <$4,080–4,120.
🛡 Supports: $3,950 → $3,900 → $3,850 — pivotal shelves for bears’ take-profit and control.
🚧 Resistances: $4,040 / $4,080 / $4,120 — repeated supply zones; first taps favored for fades.
🧭 Bias next week: Short sells into $4,040–$4,120; TP $3,950 then $3,850 (your plan). Invalidation on sustained reclaim > $4,120–$4,175; loss of $3,850 risks extension lower.
🌍 Macro tailwinds/headwinds (this week’s tape):
• Narrative tone: Kitco flagged “razor’s edge” near $4,000 with mixed views (bubble vs. consolidation), while another Kitco piece framed the stall as a “healthy pause.”
• WSJ flow: Headlines oscillated between “slips below $4,000” and modest up-days; net read is consolidation around $4k with quick two-way trade.
• Levels: Spot finished the week essentially on $4k; intrawEEK high couldn’t clear early-week $4.02–4.03k cap.
🎯 Street view: After last month’s print above $4,000 (first ever), WSJ tone shifted to digestion; rallies still attract supply until a decisive reclaim of upper resistance.
________________________________________
🔝 Key Resistance Zones
• $4,040 — immediate ceiling; weekly high proximity, likely to cap first tests.
• $4,080 — secondary supply ledge from recent failures.
• $4,120 — upper band; acceptance above here starts to neutralize the correction.
🛡 Support Zones
• $3,950 — first defense / first TP.
• $3,900 — round-number shelf; loss invites momentum probes.
• $3,850 — critical structural base and second TP; break risks downside acceleration.
________________________________________
⚖️ Base Case Scenario
Compression within a rising-wedge-like structure, ranging $3,850–$4,120. First pushes into $4,040–$4,120 are sellable for rotations toward $3,950 → $3,850 while the market respects weekly lower highs.
🚀 Breakout / Breakdown Triggers
• Bull trigger: Sustained acceptance > ~$4,120–$4,175 turns the tone constructive again and reopens $4,200+.
• Bear trigger: Daily close < $3,900 increases odds of full $3,850 test; failure of $3,850 risks momentum spill.
💡 Market Drivers to watch
• Fed path / real yields (rate-cut odds vs. sticky inflation narrative in WSJ copy).
• USD swings (no broad USD weakness → upside attempts stall).
• ETF/CB flows (Kitco interviews highlight split sentiment; dip-buyers active, momentum players cautious).
• Event risk (headline sensitivity remains high; quick squeezes into resistance possible).
🔓 Bull / Bear Trigger Lines
• Bullish above: $4,120–$4,175 (sustained).
• Bearish below: $3,900 → $3,850 (risk expands under $3,850).
🧭 Strategy for this week
Short from resistance: Scale in around $4,040 → $4,080 → $4,120;
TP #1: $3,950; TP #2: $3,850;
Risk: Hard stop on a daily close above $4,120 (or intraday breach that holds on retest). Consider trimming if a news-driven squeeze tags $4,175 and fails.
Market Psychology: Gold vs Bitcoin - Where We Really Are🧠 The Psychology Test That Changes Everything
Here's a simple test that will tell you everything about where TVC:GOLD and IG:BITCOIN is in its cycle:
Look at these two charts. Which one screams "bull market euphoria"?
────────────────────────────────────
Chart One
🥇 TVC:GOLD : A Textbook Bull Market
Current Price: $4,000.92
Peak Price: $4,390 (Recently hit)
RSI: 69.15
Phase: EUPHORIA → COMPLACENCY (Post-peak pullback)
What the Psychology Chart Shows:
Looking at FOREXCOM:XAUUSD price action overlaid with the Wall Street Cheat Sheet:
✅ Clean parabolic structure - No ambiguity
✅ Multiple phases completed - Hope → Optimism → Belief → Thrill → Euphoria
✅ Peak already hit at $4,390 - The pink Euphoria circle was touched
✅ Now pulling back from peak - Classic post-euphoria behavior
✅ RSI cooling from overbought - Down from 85+ to 69.15
✅ Volume still elevated as reality sets in
This is what a COMPLETED bull market looks like.
When you see this chart, you don't second-guess. You don't wonder "is this a bull market?"
You KNOW it is.
────────────────────────────────────
Chart Two
₿ IG:BITCOIN : Still in Early Stages
Current Price: $101,802.2
RSI: 44.61
Phase: OPTIMISM (not even Belief yet)
What the Psychology Chart Shows:
Looking at INDEX:BTCUSD price action overlaid with the Wall Street Cheat Sheet:
⚠️ "We are here" marker - Sitting in the OPTIMISM phase
⚠️ Haven't reached Belief yet - The green zone is still ahead
⚠️ Thrill phase - Blue circle far above current price
⚠️ Euphoria phase - Pink circle even further away
⚠️ RSI at 44.61 - Not even close to overbought
⚠️ Fourth Halving marker - April 22, 2024 clearly noted
This is what mid-cycle consolidation looks like.
────────────────────────────────────
🔍 The Critical Difference
Let me use an analogy: Think of market cycles like a marathon.
FOREXCOM:GOLD (Chart 1):
Mile 26 - Just crossed finish line - Race is over, starting to cool down
Runners are slowing down after sprint (Post-euphoria)
Crowd peaked, now dispersing (Volume still high but declining)
Everyone saw the finish (Peak at $4,390)
Now wondering if they should have sprinted harder
CRYPTOCAP:BTC (Chart 2):
Mile 8 of 26 - Still early in the race
Runners are fresh and steady (Optimism)
Crowd is watching but not cheering wildly yet
Most people aren't even at the venue yet
Many spectators think the race might be cancelled
────────────────────────────────────
📊 Side-by-Side Psychology Comparison
────────────────────────────────────
🎯 What This Tells Us About IG:BITCOIN
If COINBASE:BTCUSD were truly at a cycle top, it would look like CAPITALCOM:GOLD :
❌ Parabolic vertical moves
❌ RSI pinned above 75 for weeks
❌ Volume exploding
❌ Everyone saying "Bitcoin to $500K"
❌ Taxi drivers asking about crypto
❌ Magazine covers everywhere
❌ No doubt whatsoever about the trend
But OANDA:BTCUSD looks nothing like that:
✅ Choppy consolidation
✅ RSI in neutral zone (44.61)
✅ Volume moderate
✅ Everyone asking "Is the bull market over?"
✅ Retail despair and fear
✅ Zero mainstream coverage
✅ Maximum doubt about the trend
────────────────────────────────────
💡 The Psychology Principle
Here's the key insight from behavioral finance:
**"If you have to ask whether you're in a bubble, you're not in a bubble."**
TVC:GOLD : No one is asking if TVC:GOLD is in a bull market. It's obvious.
IG:BITCOIN : Everyone is asking if IG:BITCOIN is in a bull market. That's your answer.
────────────────────────────────────
🧩 Where Each Asset Really Is
TVC:GOLD - Post-Peak Bear Market Transition:
Completed Phases:
✅ Hope (Oct '23 - May '24)
✅ Optimism (May '24 - Dec '24)
✅ Belief (Dec '24 - May '25)
✅ Thrill (May '25 - Sep '25)
✅ EUPHORIA - PEAKED at $4,390 (Oct '2025)
Current Phase:
🔶 COMPLACENCY - "It'll come back to $4,390"
Price: $4,000.92 (down ~9% from peak)
Classic post-euphoria denial behavior
What's Next:
Anxiety → Denial → Panic → Capitulation (2026+)
Time Remaining: Bull market is OVER - bear phase beginning
────────────────────────────────────
KRAKEN:BTCUSD - Early-Mid Bull Market:
Completed Phases:
✅ Hope (2023 - Post-FTX recovery)
🟡 OPTIMISM (Current - 2024-2025)
Phases Still Ahead:
⬜ Belief
⬜ Thrill
⬜ Euphoria
What's Next:
Break into Belief phase → Thrill → Euphoria
Time Remaining: Given CRYPTOCAP:BTC high volatile nature - 2-6 months of upside potential
────────────────────────────────────
🎨 The Visual Test (Do This Right Now)
Step 1: Look at the TVC:GOLD chart
Does it look like a bull market? YES
Could you be wrong? NO
Is there any doubt? ZERO
Step 2: Look at the IG:BITCOIN chart
Does it look like a bull market? MAYBE?
Could you be wrong? POSSIBLY
Is there any doubt? TONS
Step 3: Ask yourself
**"Would a cycle TOP have this much doubt and fear?"**
The answer is NO.
────────────────────────────────────
📈 What the RSI Divergence Tells Us
TVC:GOLD RSI Pattern:
Peaked above 85 during euphoria
Currently cooling at 69.15
Rolling over from overbought
Classic post-peak behavior
This is bear market transition
IG:BITCOIN RSI Pattern:
Sitting at 44.61
Plenty of room to run
Not even approaching overbought
Recent "Bear" signals flushing out
This is early-cycle behavior
Think of it like a gas tank:
TVC:GOLD : Hit redline at $4,390, now coasting down on fumes
IG:BITCOIN : 45% full, tons of room to run
────────────────────────────────────
🔥 The Contrarian Insight
What the majority thinks:
" TVC:GOLD is in a bubble, IG:BITCOIN topped"
What the charts actually show:
TVC:GOLD is in a mature bull market (near end)
IG:BITCOIN is in early-mid bull market (tons of runway)
The irony:
Everyone trusts TVC:GOLD rally (late stage)
Everyone doubts IG:BITCOIN rally (early stage)
This is exactly backwards.
────────────────────────────────────
🎭 The Emotional State Comparison
TVC:GOLD Holders Right Now:
😰 Starting to feel anxious (down from $4,390)
🤔 "It'll bounce back, right?"
📉 Checking price hoping for recovery
🙃 "I should have sold at $4,390"
😬 "This is just a healthy correction"
This is COMPLACENCY - the denial phase after euphoria.
IG:BITCOIN Holders Right Now:
😰 Anxious and doubtful
🤐 Not talking about their positions
😔 Wondering if they should sell
📉 Feeling defeated
💀 "Maybe the cycle is over"
Which emotional state typically marks:
Post-cycle tops? → TVC:GOLD current state (Complacency/Denial after Euphoria peak)
Cycle middles? → IG:BITCOIN current state (Doubt during Optimism)
────────────────────────────────────
💎 The Bottom Line
Using the Wall Street Cheat Sheet as our guide:
TVC:GOLD :
Phase: Thrill → Euphoria
Completion: ~95% through cycle
Risk/Reward: High risk, limited reward
Action: Take profits soon
IG:BITCOIN :
Phase: Optimism (just finished Hope)
Completion: ~30% through cycle
Risk/Reward: Moderate risk, massive reward
Action: Accumulate aggressively
────────────────────────────────────
🧠 The Psychology Lesson
The market is designed to make you feel wrong at exactly the wrong time:
When TVC:GOLD peaked at $4,390 (Euphoria) → You felt confident, " TVC:GOLD to $5K!"
Now TVC:GOLD is pulling back (Complacency) → You feel like "it's just a correction"
When IG:BITCOIN is cheap and poised (Optimism) → You feel scared to buy
This is why most people:
Miss selling tops (felt too good at $4,390)
Hold through corrections (denial and complacency)
Sell bottoms during fear (Optimism feels scary)
To win, you must:
Trust the structure over the sentiment
Buy when it feels uncomfortable (Optimism/Belief)
Sell when it feels amazing (Euphoria/Peak)
────────────────────────────────────
📍 Where We Actually Are
HOPE → OPTIMISM( IG:BITCOIN ) → BELIEF → THRILL → EUPHORIA ( TVC:GOLD $4390 Peak) → COMPLACENCY → ( TVC:GOLD Current)
IG:BITCOIN is 3-4 phases behind TVC:GOLD .
TVC:GOLD already peaked. IG:BITCOIN hasn't even started its parabolic phase yet.
────────────────────────────────────
🎯 What This Means for Your Portfolio
If you're holding TVC:GOLD at $4,000:
You missed the peak at $4,390
You're in post-euphoria complacency
"It'll bounce back" is denial
Risk/reward is terrible now
Exit strategy needed YESTERDAY
If you're doubting IG:BITCOIN at $102K:
You're sitting in Optimism
You're early to the party
Peak is 3-4 phases away
Risk/reward is excellent
Accumulation strategy needed NOW
────────────────────────────────────
🔚 Final Thought
The next time someone tells you " IG:BITCOIN topped," show them these two charts side by side.
Ask them: "Which one actually topped?"
The answer is clear: TVC:GOLD peaked at $4,390 and is now in complacency denial. IG:BITCOIN is still in optimism.
TVC:GOLD finished its race.
IG:BITCOIN is just finishing Act 1.
The Golden Bull Run isn't over—it's barely begun.
────────────────────────────────────
This is educational content comparing market psychology across asset classes. Not financial advice. Always do your own research and manage risk appropriately.
────────────────────────────────────

Gold’s Tight Range = Big Opportunity! Watch These Key Levels.COMEX:GC1! COMEX:GC1! (Gold Futures) | Market Analysis & 2025 Outlook
After hundreds of requests since my last ideas, I’ve decided to share another detailed breakdown — this time for Gold Futures COMEX:GC1! . Let’s dive in.
COMEX: COMEX:GC1! Breakdown
Fundamental Analysis → NEUTRAL to BULLISH
Gold remains range-bound as markets await clearer direction from global inflation data and U.S. rate expectations. Safe-haven demand continues to support the metal, but a strong dollar has kept price capped.
Technical Analysis → RANGING (Neutral Bias)
Currently consolidating within a 4H range since October 25th, with price bouncing between resistance near 4045 and support around 3940.
A close below 3940 opens the door for lows near 3823.
A close above 4045 could trigger a move toward the fair value gap around 4235.
If price sustains above 4235, the next major target would be a breakout beyond the all-time high at 4398.
This sideways structure suggests accumulation before a decisive move — traders should stay patient for a confirmed breakout before committing heavy capital.
Sentimental Analysis → Market in Waiting Mode
Gold traders are showing hesitation — institutions and retail alike are waiting for key macro catalysts. The current equilibrium reflects indecision rather than reversal.
My Suggestion:
While the bias remains neutral, a smart strategy is to wait for confirmation from the range extremes.
Trade Plan:
BUY Setup: If we see a strong 4H or daily close above 4045, aim for 4235, then 4398.
SELL Setup: If price closes below 3940, look for continuation to 3823 before considering long re-entries.
Use proper risk management — risk small until direction confirms.
Conclusion
Gold’s current range offers both opportunity and caution. Be patient and let the breakout guide your next move. Remember — the market rewards discipline more than prediction.
If you enjoyed this breakdown, drop a LIKE, COMMENT, and FOLLOW for more updates and technical setups.
See you soon on the next trade idea! ✨📊

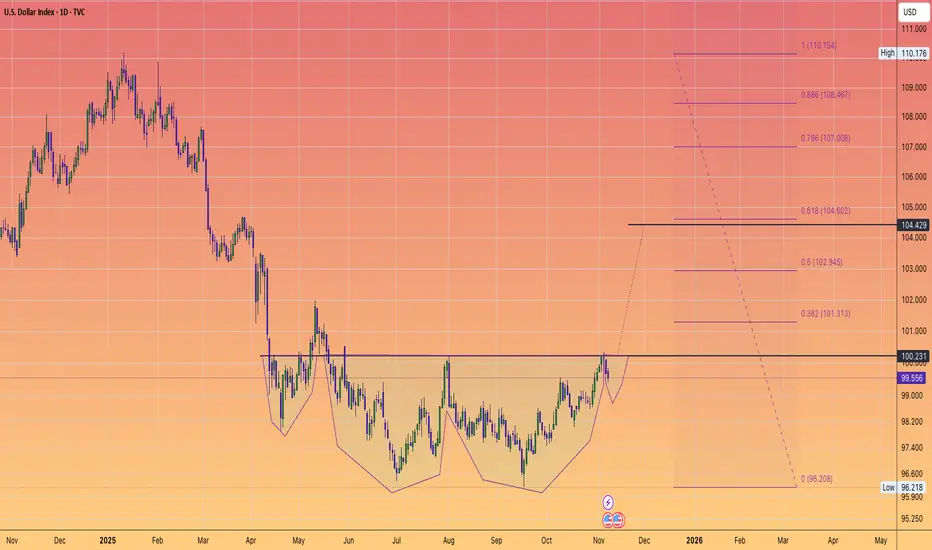
$DXY eye a 5 point move. RISK OFF.The dollar index is reversing course.
And I believe highly likely to trigger this complex inverse head and shoulder's.
A swift move to the 105 region
lines up with a expected downside move in #BTC
A corrective move in the #PreciousMetals
and further profit taking on the #AI trade.
I believe this all could play by Xmas.
So the odds of a #SantaRally are slim given current price action that we are seeing across the board.
FRACTAL and elliott wavesI think the structure in 2011 is very similar to the one in 2025.
Due to the fractal and Elliott waves, I expect a drop to 3666 on the route I've drawn.
I've already published my chart showing the next steps.

YALLA XAUMO — GOLD (XAUUSD) | Weekly Institutional 📘 EDUCATIONAL ONLY — NOT FINANCIAL ADVICE
All times Africa/Cairo (UTC+2). Report time: Sat, 08 Nov 2025 — 10:09
🟡 YALLA XAUMO — GOLD (XAUUSD) | Weekly Institutional — COMPREHENSIVE (Approved Protocol)
Spot ref: 4,000.18 • GC1 (front): 4,009.8 • GC2 (next): 4,043.3
→ Term spread (XCM): +0.84% → Contango
— GC futures curve explainer —
• Contango → GC2 > GC1 (normal upward curve; storage/carry is priced in; not bearish by itself).
• Backwardation → GC2 < GC1 (near-term demand/supply stress; often bullish spot impulse).
• Term spread (%) → (GC2 − GC1) / GC1 × 100 → shows curve slope/steepness.
────────────────────────────────────────────────────────────────────
1) SNAPSHOT & MAP (W1 focus, using your attached GC1/GC2 & XAUMO boards)
• State: Balanced / Sideways around 4,000 handle (POC ≈ 4,000–4,001).
• Boxed range (cash): 3,976–4,027 (VA Low ≈ 3,988–3,990; VA High ≈ 4,010–4,012).
• Immediate inflection: 4,010 (accept above → 4,027/4,034), 3,996 (accept below → 3,983/3,976).
• Weekly VWAP bias: flat-to-slightly up; value building near 4,000.
2) XGM GATE MAP (where the week tends to open)
• Above 4,010 gate → bullish distribution to 4,027 → 4,034/4,043.
• Below 3,996 gate → bearish rotation to 3,983 → 3,976 → 3,965.
• Inside 3,996–4,010 → fade the extremes back to POC (4,000 ±).
3) GC FUTURES STRUCTURE (Daily)
• GC1 ~4,009.8, GC2 ~4,043.3 → mild contango (+0.84%) consistent with carry; no squeeze signal by structure alone.
• Basis vs spot ~ +0.24% (spot 4,000.18) → curve not pressuring immediate spot dislocation.
4) FIB-KICKER / VOLUME MATRIX (from your boards)
• Pullback magnets: 61.8% ≈ 4,004; 88.6% ≈ 4,010.
• Extension magnets: 118% ≈ 4,031–4,034; 138–150% ≈ 4,056–4,075 (stretch if RVOL expands).
• Volume note: rotation pockets inside 3,996–4,010; outside requires RVOL > 1.1 to sustain.
5) ICHIMOKU REGIME TABLE (directional read)
• 4H: Bullish continuation, “retracement in progress.”
• 1H: Mixed / tactical bearish on dips; flips bullish only above 4,012–4,016 acceptance.
• 15m/5m: Buy-the-pullback bias into 4,010 when momentum > EMA(9/21).
6) VALUE MAP (POC/VAL/VAH/VWAP)
• POC ~ 4,000–4,001 • VAL ~ 3,988–3,990 • VAH ~ 4,010–4,012 • WVWAP ~ flat ≈ 4,001
• Interpretation: Acceptance above VAH unlocks 4,027/4,034; failure at VAH reverts to POC then VAL.
7) XAUMO TREND MAP (confidence %)
• Weekly: Sideways-up (58%)
• 4H: Gentle up (55%)
• 1H: Neutral→up only above 4,012 (48% below / 56% above)
• 15m: Up on RVOL>1 / EMA9>EMA21 (60%)
8) KICKER PROJECTIONS (what good looks like)
• Bull path: Probe 4,004 → reclaim 4,010 → build above → 4,027 → 4,034/4,043.
• Bear path: Lose 3,996 → 3,988 → 3,983/3,976 → stretch 3,965 if RVOL>1.2.
9) SESSION BIAS TABLE (London/NY execution tips)
• London Open (LO): Fade early sweep toward 3,996/3,988, target mean (4,000) or VAH (4,010) if momentum confirms.
• pre-NY: If VAH holds support, squeeze to 4,027; if VAH rejects, short back to 4,000 → 3,996.
• NY Main: Break-and-hold above 4,012 tends to run stops to 4,027/4,034; miss = chop back to 4,000.
10) CROSS-ASSET HEATMAP (from your watchlist snapshot)
• VIX ~19 (calm-ish but reactive) • US30 +0.09% • NASDAQ −0.35% • XAU/EUR +0.44%
• Read: Mild equity softness + steady VIX = supportive on dips if DXY doesn’t spike.
11) LIQUIDITY MAP (where stops likely sit)
• Tops: 4,012–4,016 (acceptance flip), 4,027, 4,034/4,043.
• Bottoms: 3,996, 3,988, 3,983, 3,976, 3,965.
12) ECON-AWARE NOTES (weekly posture)
• With curve in mild contango and cash boxed at 4,000, news shocks likely decide who wins 3,996 vs 4,010.
• Plan: Execute technicals; expand size only when RVOL > 1.1 and ADX (LTF) rises.
13) EXECUTION CHECKLIST
HTF bias aligned? (Weekly/4H not fighting your 15m idea)
Above/below gate (4,010 / 3,996) decided?
RVOL > 1.1 and 9>21 EMA on entry TF?
SL1 = structure + ATR(15m)×0.6; SL2 (tailgate) trails behind EMA21/VWAP band
Partial at TP1; move SL1 to BE once +0.75R; trail SL2
14) TRADE SCENARIOS (examples; educational only)
A) Swing (weekly box breakout)
• Long 4,012–4,016 acceptance, SL1 4,004, SL2 trail 21-EMA(15m)
• TP1 4,027, TP2 4,034 (runner 4,043)
• Probability: 62% if RVOL > 1.1 and 1H flips up
• Alt (reversal): Short 3,996 break & hold, SL1 4,004, TP1 3,988, TP2 3,976 (prob 55%)
B) Edge-Fade (inside the box)
• Short 4,010–4,012 rejection (bear wick / delta stall), SL1 4,016, TP1 4,000, TP2 3,996
• Long 3,988–3,996 absorption, SL1 3,983, TP1 4,000, TP2 4,010
• Probability: 58% while range persists; stand down when RVOL expands >1.2
C) Scalping (5m→15m calibrated)
• Long on pullback to 4,001–4,004 with EMA9>21 & RVOL line up, SL1 3,997, TP1 4,008, TP2 4,012
• Short on fail back under 3,999 with EMA9<21, SL1 4,003, TP1 3,994, TP2 3,990
• Use SL2 tailgate once +0.6R; max hold 3–5 bars
D) Continuation (momentum burst)
• Above 4,027 with footprint expansion → quick run 4,034 then 4,043
• Below 3,983 with RVOL>1.3 → 3,976 then test 3,965
• Manage with SL2 trailing behind micro-swings
15) RISK MANAGEMENT (XAUMO style)
• Position tiering: ½ size inside 3,996–4,010; full size only after acceptance outside the box with RVOL>1.1.
• SL1 = structure+ATR buffer; SL2 = tailgate trail. If TP1 hit → lock BE, trail for TP2.
• No add-ons if ADX(15m) falling and RVOL<1.0.
────────────────────────────────────────────────────────────────────
ARABIC QUICK SUMMARY (ملخص عربي)
• السوق متوازن حوالين 4000. البوابة لفوق 4010–4012، وتحت 3996.
• سيناريو الشراء: تثبيت فوق 4012 → 4027 ثم 4034/4043.
• سيناريو البيع: كسر 3996 → 3988 ثم 3976.
• إدارة المخاطرة: SL1 هيكل + ATR، و SL2 تريل ورا EMA/VWAP. خُد جزء عند TP1 وحرك الباقي BE.
FRENCH QUICK SUMMARY (Résumé)
• Marché neutre autour de 4000. Portes: 4010–4012 (haussier) / 3996 (baissier).
• Achat: acceptance > 4012 → 4027 puis 4034/4043.
• Vente: rupture < 3996 → 3988 puis 3976.
• Risque: SL1 structure + ATR, SL2 suiveur; prendre TP1 puis basculer BE.
🏆 Winners trade with XAUMO
