XAU/USD Short to Longs idea Yes — I still believe Gold remains bullish overall. The recent downside movement looks like a healthy correction before price continues its rally upward. I’m noticing price building liquidity, so I’ll wait for a breakout and a clean tap into one of my key POIs.
Currently, price is sitting in a 30min demand zone near a 2hr supply, where I expect a possible short-term reaction. After that, I’ll be waiting for the next solid buying opportunity — ideally from the 3hr demand around 3,860, or from a new demand that may form closer to current price this week.
Confluences for Buys:
- Price broke major structure to the upside and is now retracing
- Liquidity above (trendline + Asia highs) waiting to be taken
- 3hr demand around 3,860 could fuel the next rally
- Bullish candlestick momentum remains strong
- Higher time frames still show clear bullish structure
P.S.If price breaks below 3,850 with clear bearish structure, I’ll consider a short-term bearish phase. Until then, I’ll stay focused on long opportunities in line with the dominant trend. Have a great trading week!
Goldbuysetup

Gold (XAU/USD) 4H Chart Analysis – Short-Term Reversal from ?Technical Overview:
Gold has recently rebounded from a High Demand Zone around the $3,900–$3,910 region, showing clear signs of buyer re-entry after a prolonged bearish correction. The candle structure suggests strong bullish intent, with higher lows forming and a potential continuation toward the next liquidity area.
Key Observations:
🔹 High Demand Zone: Price reacted strongly here, indicating institutional buying pressure.
🔹 High Prop POI (Point of Interest): Served as a key accumulation level before the breakout.
🔹 SMC Trap: Indicates a prior liquidity grab, trapping late sellers before the move up.
🔹 Bullish Momentum Building: Consecutive bullish candles after rejection from the demand zone strengthen the reversal bias.
Target Projection:
🎯 Immediate Target: $4,080 – $4,100 (aligned with local resistance and liquidity grab zone).
🛑 Support: $3,905 (must hold to maintain bullish structure).
💎 Extended Target (if momentum continues): $4,160 – $4,180 (previous major swing high zone).
Summary:
Gold is showing a short-term recovery phase within a broader bullish structure. A confirmed 4H close above $4,030 would likely propel price toward the $4,100 region, while a drop below $3,900 would invalidate the bullish setup.
📊 Suggested Title:
"Gold Rebounds from Key Demand Zone, Eyes $4,100 Resistance 🔥"

Gold Price Analysis - Gold Breakout Levels 4200 vs 4040Gold is trading inside a tightening rising channel after forming a strong higher timeframe rejection from the ATH which pushed price into a corrective phase. Buyers have repeatedly defended the strong support zone near 4000-3980 creating a false breakout low followed by a controlled recovery showing that demand remains active.
However, each rally into the weak-high resistance at 4160-4200 has shown fading momentum meaning sellers are still protecting this zone aggressively. Until price breaks out with a clean close and retest above this resistance gold will remain in a neutral to slightly bullish consolidation phase driven by stop hunts and choppy movements inside the channel.
A successful breakout above 4200 can trigger a bullish continuation toward 4240 then 4320-4360 and possibly back to the ATH zone while a breakdown below 4040 rising support would shift the structure bearish again exposing the 3980 demand and potentially a deeper drop to 3900 if buyers fail there.
In simple terms buyers still control support, sellers still control resistance and the next big move will come once one of these critical levels breaks with strength.
✅ Option 1-Strong Bullish Bias
Gold is still respecting the rising channel and defending the strong support zone around 4000-3980. As long as price stays above the rising trendline bullish structure remains valid. A clean breakout above 4160-4200 will confirm continuation toward 4240 → 4320 → ATH retest. Buyers are still in the game, waiting for the breakout.
✅ Option 2-Neutral to Bullish
Gold is consolidating inside a rising channel after rejecting the ATH. Support remains strong around 4000-3980 while sellers continue to defend 4160-4200. A breakout on either side will define the next major move. Above 4200 bullish continuation toward 4240 and 4320+. Below 4040 deeper pullback toward 3980 and possibly 3900.
✅ Option 3-Neutral to Bearish
Gold is struggling to break above 4160-4200 showing seller strength at the top of the range. If price fails again and breaks below the rising channel near 4040 downside can accelerate toward 3980 and 3900 for liquidity. Bulls must hold support to avoid a deeper correction.
Gold remains trapped between 4040 support and 4200 resistance inside a rising wedge. Buyers holding strong at the bottom but sellers still defending the top. Break above 4200 bullish continuation toward 4320. Break below 4040 bearish move to 3980-3900. Still a range waiting for breakout confirmation.
Note
Please risk management in trading is a Key so use your money accordingly. If you like the idea then please like and boost. Thank you and Good Luck!

Gold (XAU/USD) – Bullish Rebound Expected from Key Support ZoneTechnical Structure
Uptrend Confirmation: Despite the pullback, the overall structure remains bullish — higher highs and higher lows are intact.
Support Zone (Green Box): The area between 4,132 – 4,197 acts as a strong demand region where a reversal is likely.
Target Point: The upside target lies near $4,378 – $4,381, coinciding with previous highs and resistance.
📈 Bullish Scenario
If price tests the support level and shows rejection (bullish candles or wicks), we can expect:
Entry: Around $4,160 – $4,200
Target: $4,380 – $4,381
Stop Loss: Below $4,120
This would confirm a continuation of the uptrend after a healthy correction.
📉 Bearish Scenario
If price breaks below $4,120, it could trigger:
Deeper correction toward $4,060 – $4,000
Momentum shift from bullish to short-term bearish.
🟢 Signal Summary
Direction Entry Zone Stop Loss Take Profit Confidence
BUY (Long) $4,160 – $4,200 $4,120 $4,380 ⭐⭐⭐⭐ (Strong if support holds)
⚠️ Conclusion
Gold is showing signs of retracement within an uptrend.
If the support zone holds, we can expect a bullish reversal toward the $4,380 target point.
However, a break below $4,120 will signal a deeper correction before any new rally.

Gold (XAU/USD) Breakout Rally Toward New Highs!Analysis:
Gold (XAU/USD) continues its strong bullish momentum on the 4-hour chart, forming a series of higher highs and higher lows, confirming a sustained uptrend. The recent breakout above the resistance zone near $4,150–$4,170 indicates renewed buying interest and momentum buildup.
After a brief retest of the breakout area, price has started climbing again — a sign of trend continuation supported by bullish candle formations and strong market sentiment.
Technical Outlook:
Support Zone: $4,140 – $4,170 (previous resistance turned support)
Bullish Confirmation: Continuation pattern with clean structure and volume support
Momentum Bias: Strongly bullish while above $4,150
🎯 Target: $4,300 – $4,320 zone
🛑 Stop Loss: Below $4,140 to limit downside risk
📈 Summary:
As long as gold stays above the breakout level of $4,170, the market remains bullish, with upside potential toward $4,300–$4,320, aligning with the next major resistance area.

FOMC Fallout or Fakeout? Stay Sharp, Stay DisciplinedHello Traders,
What are your thoughts on the strong downside move we saw yesterday, likely triggered by the release of the FOMC meeting minutes? Personally, I believe this could be a temporary reaction, as the minutes revealed a dovish stance from the Federal Reserve.
As price approaches our area of interest, it's crucial to monitor price action closely on the lower timeframes to assess where it's likely headed. Patience is key—always trade with the trend.
If you're considering selling in this highly bullish market, at the very least wait for a major structure shift. You can identify this by watching for a break of the 50 SMA on the daily chart or a clear break of the most recent strong lower high.
Let’s stay consistent and disciplined.
Happy Trading!

WILL GOLD BREAK THE BOX : LETS ASK FROM GOLD Hello
Iam Expect From gold that i will see it will break the consolidation box
Buy Gold When Its Break The Box And Continuation Buying Gold
Gold Give A Bullish FVG So We Are Expecting Bullish Momentum
Gold Buy At Bullish FVG And 3376 / 3370 Buy Zone
Manage Your Trade , Good Luck With Your Trading

Gold Retesting Support 3,350–3,345-Short-Term Buying Opportunity📊 Market Overview
Gold is currently trading around 3,350 USD/oz, slightly higher than the previous session thanks to expectations that the Fed will cut interest rates amid a weakening USD. The market remains cautious ahead of upcoming U.S. inflation data, which could provide new momentum for gold prices. Additionally, President Trump’s confirmation that gold imports will not face tariffs has helped stabilize investor sentiment.
📉 Technical Analysis
• Key Resistance: 3,400 – 3,410 USD/oz
• Nearest Support: 3,345 – 3,350 USD/oz
• EMA09: Price is currently below the EMA09 on the H1 timeframe → short-term downward pressure still persists.
• Candlestick / Volume / Momentum: After a sharp drop on August 11, price is sideways around the support zone; RSI on H1 is about 56, not yet overbought, indicating potential for a rebound if support holds.
📌 Outlook
Gold could rebound short term from the 3,350–3,345 zone if U.S. inflation data comes in lower than expected and the USD continues to weaken. However, if price breaks below 3,345 with strong selling pressure, the downtrend may extend to 3,335 or 3,330.
💡 Suggested Trading Strategy
BUY XAU/USD: 3,346 – 3,343 USD/oz
🎯 TP: 40/80/200 pips
❌ SL: 3,339 USD
SELL XAU/USD: 3,407 – 3,410 USD/oz
🎯 TP: 40/80/200 pips
❌ SL: 3,413 USD

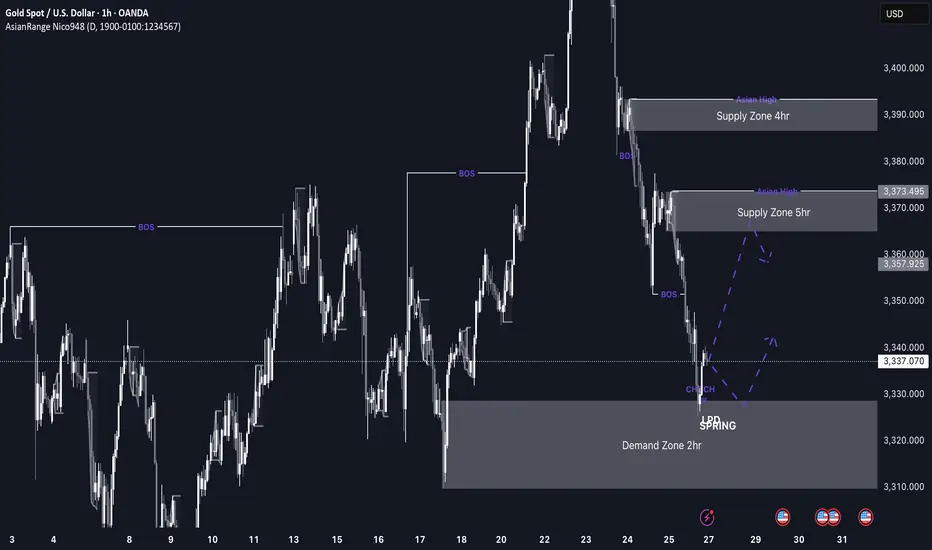
GOLD imminent possible buys up to 3,370 This week’s price action on GOLD is shaping up to be very interesting. After weeks of sustained bearish pressure, price has now entered a discounted 2hr demand zone sitting at a swing low, which makes it a high-probability area for a bullish reaction, especially as markets open.
If we do get the expected bullish reaction from this level, I’ll be watching the 3,370 region, where there’s a clean 5hr supply zone. If price reaches that level, I’ll be looking out for distribution and a potential short setup from there.
Confluences for GOLD Longs:
Price has been very bearish recently, so a retracement is expected
Currently sitting in a discounted 2hr demand zone
The overall long-term trend is still bullish
Early signs of accumulation and bullish reaction from this zone
P.S. If price fails to hold this current demand zone and breaks lower, then bearish momentum may continue. In that case, I’ll look for new long opportunities around 3,290 where a deeper demand zone exists.
Gold – 24 July: Watching H4 OB Zone for Bullish ReversalGold – 24 July Outlook
Watching H4 OB Zone for Potential Reversal
📌 Recap of 23 July Trade:
As outlined in yesterday’s analysis, the M15 Order Block ( 3417–3412 ) held well. The market reacted precisely from this level, and our long setup successfully hit the defined 120-pip target .
However, after reaching a high near 3434 , the price failed to break above and instead rejected sharply, breaking the recent M15 higher low — a key structural sign that signals the start of a possible H4 pullback phase.
🔍 Current Market Context:
Trend Overview:
While the overall bias remains bullish, this break of M15 structure suggests short-term weakness and a corrective move in progress on the H4 chart.
Key Zone in Focus:
H4 Order Block Zone: 3359 – 3345
This is a critical zone to watch today. The market is currently trading around this area, and it could act as a potential reversal point where the uptrend resumes.
🎯 Trading Plan:
– Closely monitor the price action within the 3359–3345 zone.
– If price respects this zone and LTF (e.g., M1) shows signs of structure flip or ChoCH + BoS , it could present a fresh long setup opportunity.
– As always, only act on the trade if multiple confluences align — don’t anticipate, let the market confirm.
📈 Summary:
Bias: Watching for a bullish reversal from the 3359–3345 zone.
Setup Condition: Wait for clear LTF confirmation before entering.
Risk Management: Stick to 1:3 RR — 40 pip SL and 120 pip TP as per system.
Let the market come to your setup. Patience is your greatest edge.
📘 Shared by @ChartIsMirror

GOLD BUY ZONES Gold Buy Zone We Have
Bullish Engulfing Area ( 3317 - 3311 )
Order Block Area ( 3304 - 3295 )
Target We Are Expect Previous High Lets Gooo

Gold Falls After Rejection at 3350 – Eyes on Short-Term Pullback📊 Market Drivers:
• Gold spiked to $3,350/oz early in the day but later dropped to $3,310/oz as profit-taking kicked in and U.S. yields recovered slightly.
• Market is in a wait-and-see mode ahead of PCE inflation data on Friday, limiting upside momentum late in the session.
📉 Technical Analysis:
• Key resistance: $3,345–3,350 (daily high)
• Nearest support: $3,310 – session low; then $3,290
• EMA09: Price trading above EMA09, but below EMA21, signaling a neutral bias
• Candle/momentum: Formed shooting star reversal near $3,348 on H1 with declining volume → short-term weakness ahead
📌 Outlook:
Gold may pull back toward $3,300–3,290 short-term if USD rebounds and selling persists. But medium-term bullish bias remains if inflation data disappoints and USD continues weakening.
💡 Trade Ideas:
🔻 SELL XAU/USD at: 3,335–3,345
🎯 TP: 3,315
❌ SL: 3,352
🔺 BUY XAU/USD at: 3,295–3,305
🎯 TP: 3,315
❌ SL: 3,285

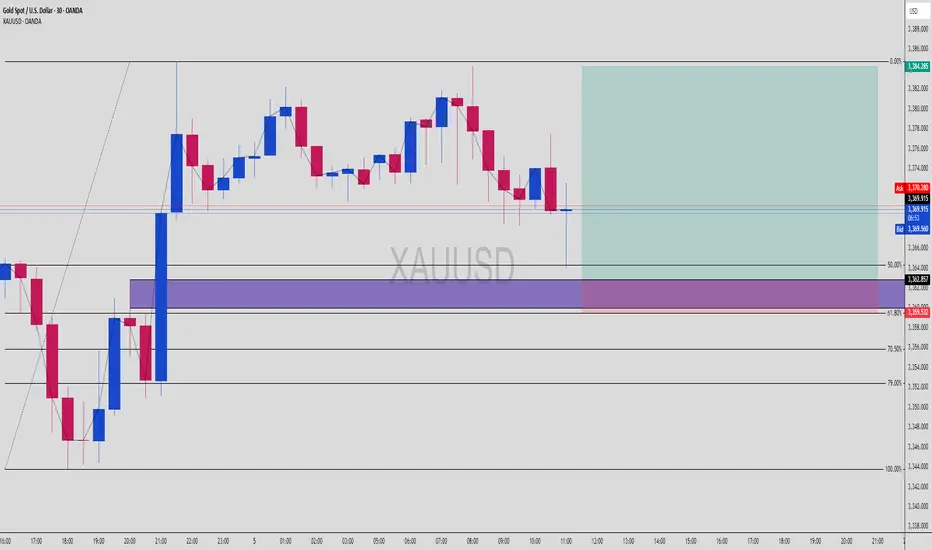
XAUUSD Reversal Zone Hit? OB + 61.8% Fib Tap In Progress!Gold (XAUUSD) | 30-Min Buy Setup – Smart Money Discount Reversal in Motion
We’ve got price doing exactly what Smart Money traders expect:
Impulse up → Pullback → Tap into OB inside discount → Launch 🚀
🔍 Breakdown:
Market Context:
Strong bullish impulse leg broke previous highs — a confirmed market structure shift
Pullback is targeting the refined Order Block + multiple fib confluences
Eyeing continuation toward 3,384.285 as main target
Key Confluences:
✅ OB Zone (purple): ~3,362.857
✅ Fib Levels:
50% = 3,364.000
61.8% = 3,359.532
70.5% = 3,356.000
79% = 3,352.000
✅ Perfect Entry Reaction: Price is starting to show a wick & stall around OB top edge (3,362)
Smart Money Entry Logic:
Price dropped from a recent high into a clean imbalance + OB area
Liquidity sweep below recent lows is setting up the reversal
Discount levels = ideal entry zone for institutional re-accumulation
Execution Plan:
Watch for M5–M15 confirmation:
Bullish engulfing or BOS inside the OB zone
Entry: Limit in OB or aggressive confirmation candle
SL: Below 3,352 (beneath 79% + OB bottom)
TP: 3,384 = last swing high
✅ RRR = 1:3+ — sniper-approved 😎
🎯 Game Plan Summary:
🔹 Entry Area 3,362.857 (OB top) → 3,356.000 (deep fib)
🔻 SL Zone Below 3,352
📈 Target 3,384.285 (premium high)
🧠 RRR Potential 1:3+ with structure & fib backing it up
💬 Pro Tip:
Let the market tap liquidity + react. No entry? No FOMO.
You don’t chase — you snipe from the OB treehouse. 🥷🎯
✅ Drop “Gold Ninja Setup” in the comments if you’re planning to catch this
📥 Save this chart — entries like this don’t show up every day
🚨 Follow @ChartNinjas88 for daily Smart Money sniper plays on XAUUSD & FX pairs
Gold Continues to Rise Amid Increased Safe-Haven Demand📊 Market Overview:
Gold prices surged on June 2, 2025, reaching multi-week highs as investors sought safe-haven assets amid escalating geopolitical tensions and trade war concerns. U.S. President Donald Trump's announcement to double tariffs on steel and aluminum imports to 50%, along with Ukraine's drone attacks on Russian facilities, prompted investors to flock to gold as a secure investment.
📉 Technical Analysis:
• Key Resistance: $3,380 – $3,405
• Nearest Support: $3,320 – $3,295
• EMA: Price is above EMA 09 → uptrend.
• Candlestick Patterns / Volume / Momentum: RSI(14) at 65 , MACD(12,26) signaling buy, indicating continued upward momentum.
📌 Outlook:
Gold may continue its short-term uptrend if it holds above the $3,320 support level. However, caution is advised due to potential technical corrections as RSI indicates overbought conditions.
💡 Suggested Trading Strategy:
SELL XAU/USD at: $3,380 – $3,385
o 🎯 TP: $3,320
o ❌ SL: $3,405
BUY XAU/USD at: $3,295 – $3,320
o 🎯 TP: $3,380
o ❌ SL: $3,270

Gold Breaks 3300 – Rally or Pullback Ahead?Gold has just broken through the critical support level at 3300 USD/oz and is currently trading around 3307. This movement aligns with previous forecasts, as gold continues to maintain a short-term bullish cycle. The next target investors are eyeing is the 3350 zone — a new resistance level that could define the upcoming trend.
📈 Technical Analysis:
• EMA 09: Candles are consistently closing above the EMA 09 line, indicating that bullish momentum remains dominant.
• Momentum remains strong, though profit-taking pressure could emerge as prices approach the 3310–3320 range.
• Short-term support: 3290 – a potential rebound area in case of a pullback.
• Major resistance ahead: 3350 – a key level that must be breached to confirm continued upside momentum.
💡 Short-Term Trade Scenarios:
🔻 SELL XAU/USD
Entry Zone: 3348 – 3350
Take Profit (TP): 3328 – 3330
Stop Loss (SL): 3360
🔺 BUY XAU/USD
Entry Zone: 3305 – 3307
Take Profit (TP): 3325 – 3327
Stop Loss (SL): 3295

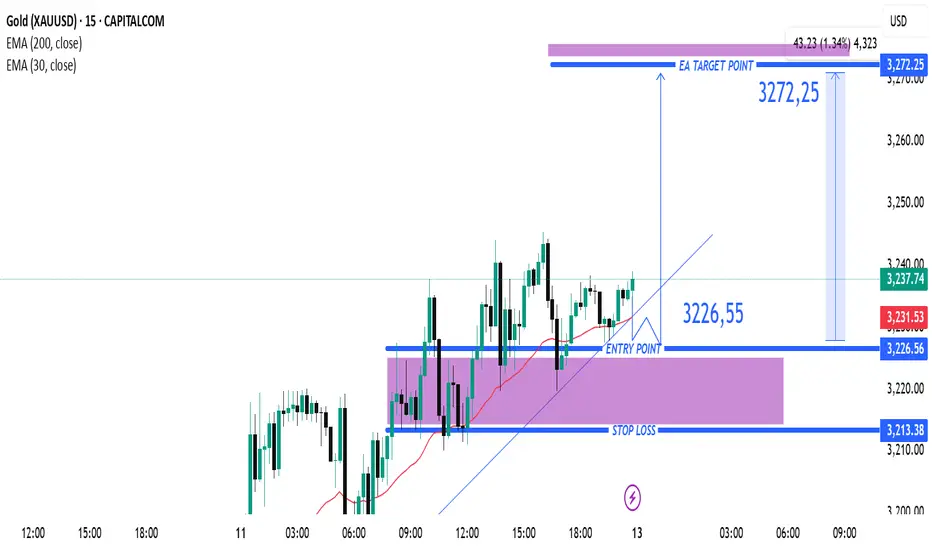
Gold (XAUUSD) 15-Min Buy Setup: Bullish Breakout with High Risk-Instrument: XAUUSD (Gold vs. US Dollar)
Timeframe: 15 minutes
Indicators:
EMA 200 (Blue): 3,170.78 (long-term trend indicator)
EMA 30 (Red): 3,231.53 (short-term trend indicator)
---
Key Levels:
Entry Point: 3,226.55 (highlighted with a blue arrow and line)
Stop Loss: 3,213.38 (purple zone bottom)
Target (Take Profit): 3,272.25
---
Trade Setup:
Type: Long (Buy) Position
Risk-to-Reward Ratio:
Risk: ~13.17 points (from 3,226.55 to 3,213.38)
Reward: ~45.7 points (from 3,226.55 to 3,272.25)
R/R Ratio: Approximately 3.5:1, which is favorable
---
Market Context:
Price is curren
Gold (XAUUSD) Bullish Breakout Setup – Targeting 3,394.56 After EMA 30 (Red Line): Currently at 3,109.56
EMA 200 (Blue Line): Currently at 3,064.85
Price is above both EMAs, indicating bullish momentum in the short and long term.
📈 Trade Setup:
Entry Point: Around 3,162.15
Stop Loss Zone: Below the purple support box around 3,109–3,141 (right above the 30 EMA)
Target (Take Profit): 3,394.56 — marked as "EA TARGET POINT"
📊 Strategy Outlook:
Bullish Setup: The price recently broke out of a resistance zone (purple area) and retested it, confirming the breakout.
The risk-to-reward ratio appears favorable, as the target is significantly higher than the stop loss.
The upward price projection suggests confidence in a strong bullish continuation.
⚠️ Things to Watch:
Volume confirmation and price action near the entry level.
If price closes below the 30 EMA, it may invalidate the setup.
Always consider broader macroeconomic or fundamental factors when trading gold (e.g., USD strength, interest rates, geopolitical tension).

GOLD WEEKLY CHART MID/LONG TERM ROUTE MAP UDPATEDWeekly GOLD Analysis – Quantum Trading Mastery
Hello Everyone,
Here’s the latest update on the GOLD weekly chart we’ve been diligently tracking and trading. Below is a comprehensive breakdown of the current range and key levels we’ve identified.
Recap of Last Week’s Analysis:
Last week, our predictions aligned perfectly with market movements:
* A strong resistance level at 2790 caused a short-term reversal near 2735.
* The FVG acted as dynamic support at 2735, sustaining the bullish momentum.
* The EMA5 crossed and locked above the key level at 2735, solidifying upward movement.
* As predicted, the resistance was broken, leading to a new all-time high of 2817.
Our analysis delivered precise predictions, allowing you to trade confidently and minimize risks.
What’s Next for GOLD This Week?
Key Level: 2735
Bullish Targets:
* TP1: 2877
* TP2: 3018
* TP3: 3160
Bearish Targets:
* 2735
* 2680
* 2595
This week, we have identified two critical GOLDTURN levels at 2735 and 2595. While we anticipate GOLD reaching TP1 at 2877, there may be short-term reversals around these key levels and GOLDTURN zones.
Recommendations:
To better understand the support structure and identify optimal dip-buying opportunities, review our smaller time-frame analyses (daily, 12H, 4H, and 1H). These insights will help you navigate the market with precision, keeping long-term gaps in perspective.
We’ll continue to provide daily updates and insights to keep you informed.
Thank you for your continued support! Don’t forget to like, comment, and share this post to help others benefit as well.
The Quantum Trading Mastery

Gold (XAUUSD) Reversal Setup: Buy Opportunity from Demand Zone t# GOLD (XAUUSD)
Timeframe: 30-minute
Indicators:
EMA 30 (Red): 3,000.22
EMA 200 (Blue): 3,042.92
🔍 Price Action & Zones
Current Price: 2,982.27
Support Zone (Demand Zone): ~2,940.27 (highlighted in purple, labeled as STOP LOSS)
Resistance Zone (Supply Zone): ~3,040.17–3,042.92 (labeled as EA TARGET POINT)
📈 Trade Idea (Based on Drawing)
Strategy: Buy from demand zone, targeting supply zone
Entry: Near 2,940.27
Stop Loss: Slightly below 2,940.27
Target: ~3,040.17
Risk to Reward: ~1:2.6 (visually)
📊 EMA Dynamics
Bearish Bias in the Medium Term: Price is trading below the 200 EMA, indicating an overall bearish trend.
Short-Term Weakness: The price has also dropped below the 30 EMA, confirming bearish momentum in the short run.
🔄 Possible Scenario
Price is currently heading back down toward the demand zone, where a bounce is anticipated.
If it respects that zone, we may see a reversal toward the target zone at ~3,040.
If it breaks below 2,940, the setup would be invalidated (stop loss hit).
⚠️ Things to Watch
Rejection or support confirmation at 2,940 zone is key before entry.
Be cautious of continued bearish momentum if economic news or global risk sentiment shifts.
Look for bullish reversal patterns (e.g. hammer, bullish engulfing) at the demand zone for confirmation.

Gold (XAU/USD) Intraday Buy Setup – Demand Zone Reversal with 3.Timeframe: Appears to be intraday (possibly 5-15 minutes).
Indicators:
EMA 30 (red): Showing recent bearish momentum.
EMA 200 (blue): Positioned above, indicating a longer-term bearish trend.
Candlestick Pattern: After a steep drop, price shows signs of consolidation and potential reversal.
📌 Trade Setup (Long/Bullish Bias)
Entry Zone: Around $2,963.2
Price is expected to pull back into this purple demand zone before moving up.
Stop Loss (SL): $2,956.1
Placed below the support zone to limit downside risk.
Take Profit (TP / Target Point): $2,988.2
A previous supply zone near the EMA 30, where selling pressure could return.
📊 Risk-Reward Ratio
Risk: $2,963.2 - $2,956.1 = $7.1
Reward: $2,988.2 - $2,963.2 = $25
RRR (Reward-to-Risk Ratio): ~3.5:1
This is a solid ratio, suggesting a high-potential trade if the setup plays out.
📈 Bullish Scenario
Price pulls back into the demand zone (entry).
A bullish candlestick confirmation or wick rejection could trigger a buy.
Target is the previous structure + EMA zone.

Gold (XAU/USD) Technical Analysis: Key Resistance Test Before BrThis chart represents a Gold (XAU/USD) 30-minute timeframe analysis from TradingView. Here are the key takeaways:
Technical Indicators & Levels
Exponential Moving Averages (EMAs)
200 EMA (Blue Line): 3,110.97 – A long-term trend indicator.
30 EMA (Red Line): 3,134.65 – A short-term trend indicator.
Key Levels
Resistance Point: Around 3,136.56.
Support Zone (Stop Loss Level): 3,103.16.
Target Point: 3,167.44, indicating a potential 1.62% upside.
Potential Trade Setup
Scenario 1 (Bullish Case):
If price breaks above resistance (3,136.56) and holds, the next target is 3,167.44.
A bullish breakout could indicate further momentum.
Scenario 2 (Bearish Case):
If price fails to break resistance and drops, it could test the support zone around 3,103.16.
A break below this level might lead to further downside.
Pattern Analysis:
The chart suggests a potential retest of resistance before a breakout.
A possible accumulation phase before a strong move.
Conclusion
Bullish above 3,136.56, targeting 3,167.44.
Bearish below 3,103.16, watching for downside risk.
The 200 EMA (3,110.97) could act as dynamic support.

GOLD MONTHLY LONG TERM RANGE ROUTE MAP ANALYSISMonthly Chart Gold (9th Feb 2024)
Dear Traders,
Attached is the updated Monthly Chart Roadmap for GOLD, showcasing our meticulous analysis and 100% target accuracy since October 2023. The Golden Circle areas on the chart emphasize our precise predictions and successful target achievements over the months.
Previous Chart Highlights:
* GOLD successfully hit TP1 (2286.35) and TP2 (2603.46), with the monthly candle closing above TP2.
* EMA5 crossed and locked above the TP2 level at 2603.46, confirming strong upward momentum.
* The EMA5 detachment process was successfully completed.
* The Fair Value Gap (FVG) at 2790 provided robust support, facilitating a push toward higher levels.
What’s Next for GOLD?
This chart update includes revised entry levels, weighted target levels, and two critical GOLDTURN levels: 2742 and 2595. These levels act as strong support zones, where potential reversals may occur. If a reversal happens, prices are likely to retest any of these levels (marked in red) before bouncing back.
Pay close attention to EMA5 near the Entry Level of 2742.55. If EMA5 crosses and locks above 2742.55, it will confirm bullish momentum and make the target of TP1 (2961) achievable with ease. Although short-term bearish movements may occur, the broader picture on the monthly chart suggests a long-term bullish trend. Temporary pullbacks strengthen the trend and provide excellent dip-buying opportunities near support levels, minimizing risk.
Recommendations:
For a detailed understanding of support structures and to identify ideal buying opportunities, refer to our smaller time frame analyses, including weekly, daily, 12H, 4H, and 1H charts. These provide actionable insights while aligning with the bigger picture of long-term bullish momentum.
As always, we’re committed to keeping you informed with daily updates and insights. Don’t forget to show your support by liking, commenting, and sharing this post. Stay tuned for more updates on our Trading View channel.
Trade Safe with Confidence!
The Quantum Trading Mastery

GOLD 4H CHART ANAYLSIS / BULLISH OR BEARISH? READ CAPTION PLZ4H Gold Analysis – 7th Feb 2024
Dear Traders,
Today's market movement aligns with our strategy of buying dips. Here's a summary of key insights:
Previous Chart Review (5th Feb)
* Target 1 (2850.15) ✅ – Successfully hit
* Target 2 (2876.95) ✅ – Successfully hit
* Target 3 (2903.76) – Pending
Key Resistance Levels Activated: 2850, 2876
Goldturn Levels Hit: 2852, 2828
What is next for Gold? Bullish or Bearish?
* Price Action Expectation: Movement between Goldturn levels with EMA5 confirmation for trend direction.
* Strategy: Monitor EMA5 crosses for trade entries.
Bearish Case
* If EMA5 stays below 2850, expect a retest of Goldturn levels.
* Scenario 1: Below 2823, likely drop to 2803.
* Scenario 2: Below 2803, expect 2776.
* Scenario 3: Below 2776, target 2747 (major demand zone).
Bullish Case
* Scenario 1: Above 2852, target 2876 ✅ DONE
* Scenario 2: Above 2876, target 2903.
* Scenario 3: Above 2903, target 2925.85.
Trading Strategy
Short-Term:
Use 1H/4H timeframes for pullbacks at Goldturn levels.
Target 30-40 pips per trade for optimized risk management.
Long-Term:
Maintain a bullish bias, viewing pullbacks as buying opportunities.
Avoid chasing tops; buy dips from key levels for better trade positioning.
Trade with confidence and discipline. Stay updated with our daily insights to stay ahead.
Support us with likes, comments, boosts, and follows!
📉💰 The Quantum Trading Mastery
