Beautiful retracement!DHI Analysis (Nasdaq)
CMP 149.64 (02-02-2026)
Beautiful retracement till Golden Pocket Zone around 113 - 115.
Bullish Divergence appearing on Weekly tf.
Crossing & Sustaining 195 may lead it towards 245 - 247.
However, if 113 is broken in any case,we may witness further selling pressure.
Goldenpocket

Golden Pocket Zone !LPX Analysis (Nasdaq)
CMP 85.03 (02-02-2026)
Currently at a Very Strong Retracement Level.
Golden Pocket Zone.
Sustaining 73 may lead it towards the double
top zone around 120 - 123.
Crossing this zone with Good Volumes, may trigger
ABCD pattern targeting 145 - 147.

xagusd to $70?is xagusd going to find support here on the 6 month chart?
- mid bollinger band
- corrective poc from ATH to 2020 low
- golden pocket retrace of the move up
- candle apporaching fibo circle
- diagonal breakout retest

BTC 30% Pullback: Local Floor is inBTC now at "Golden Pocket" Retracement Level:
The fact that a 30% pullback is coinciding with a Golden Pocket Fib Retracement paired with the current Macro conditions makes Long BTC at this level an asymmetrical bet.
Math / structure of the move
0.618 is the golden ratio, and 0.786 is roughly its square root – both come directly from the Fibonacci sequence. A pullback into 61.8–78.6% is deep enough to shake out weak hands and run liquidity, but not so deep that it fully invalidates the prior impulse. That makes it a natural “last chance” zone for trend continuation.
Orderflow & crowd psychology
A lot of traders, bots, and educational content focus on 0.618 / 0.786 as “golden pocket / OTE” style zones, so limit orders, stop orders and algorithms cluster there. In crypto, where retail TA is everywhere, this becomes self-fulfilling: price often spikes into 0.618–0.786, sweeps stops, then reverses.
Sneak Peak of the HTF Indicator I am developing for the upcoming launch of Glitch Capital . A multi-timeframe breakout- and trend-following Indicator Suite I will be launching soon.
Here you can see the Glitch Sniper Algo firing the first Buy Signals since this latest pullback. This is a sneak peak of another Indicator from the Glitch Suite I will launch soon:
30% drawdowns are normal in Bitcoin bull markets, not rare “black swans.”
A near perfect 30% pullback from ATH during a Bull Market is a known Phenomena during Crypto Bull Markets
Here’s how it looks historically:
2013 bull market: At least two 30–40% corrections on the way up.
2015–2017 bull market: Study of this cycle shows “at least nine large drawdowns” with an average correction of about 37% from peak to trough. Community analysis of the 2017 leg alone often highlights ~6 separate ~30% dips between 2016–2017 before the final top.
2011–2021 overall: About 13 drawdowns of more than 30% across that decade (bull + bear), underlining how routine deep pullbacks are in BTC.
Glassnode / market analysts: Repeatedly describe 30–40% corrections as “typical” in BTC bull markets, i.e. part of a healthy uptrend rather than a trend-break by default.
If you compress that into a rule of thumb:
In a strong Bitcoin bull cycle you can easily see several pullbacks of ~30%+, roughly every few months. So when you see a ~30% dip in a confirmed bull market, historically it’s been common and often buyable, not an automatic end-of-cycle signal.

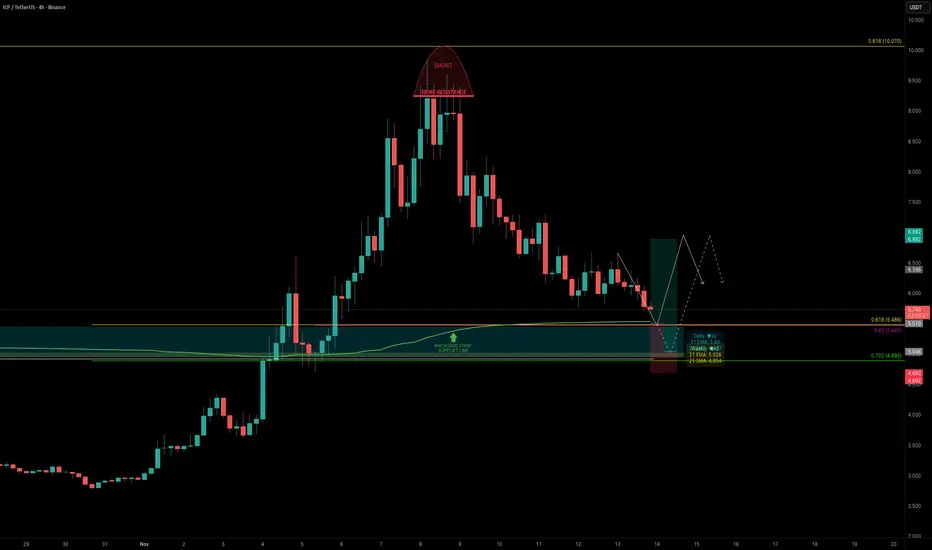
ICP — Identifying the Next High-Probability Long OpportunityICP had a great start to November, rallying over +250% in just 8 days before topping out just below the 0.618 Fibonacci retracement (~$10), right at the $3B MC resistance.
Over the past 5 days, ICP has retraced -42% from the high. The key question now: where is the next high-probability long opportunity?
Key Confluences around the $5.5 Zone
One level that stands out strongly is the $5.5 zone, where several major supports align:
0.618 Fib retracement of the entire +250% rally
0.85 Fib retracement of the smaller internal wave aligns right with the major 0.618 level
Anchored VWAP (280 day) clustering right around $5.5, adding volume-weighted support
Quarterly VWAP currently sits near $5.62
Daily 21 EMA at $5.45
Weekly 21 EMA/SMA both at around $5
$5.5 = $3B market cap
Point of Control (POC) of the past ~280 days sits around $4.9, marking it as the final major support layer below
🟢 Trade Setup Plan
Entry Zone: $5.6 – $5.0
Stop-Loss: Below POC
Targets:
TP1: $6.0
TP2: $6.9 (VWAP resistance / 0.382 Fib)
TP3: 0.618 FR
Risk/Reward: 1:2+, depending on entry precision
🔍 Indicators used
Multi Timeframe 8x MA Support Resistance Zones → to identify support and resistance zones such as the daily/weekly 21 EMA/SMA.
➡️ Available for free. You can find it on my profile under “Scripts” and apply it directly to your charts for extra confluence when planning your trades.
_________________________________
💬 If you found this helpful, drop a like and comment!
BTC Approaches Golden Pocket for Potential Lower-High ReversalBitcoin on the 4H chart has shown clear recovery after the last major dump toward the $101.5K zone. Since then, price action has formed higher lows under a broken trendline, confirming early bullish structure. The current leg has extended toward $116K, but as the Fed meeting approaches, volatility is expected to increase with potential liquidity grabs on both sides.
The area between $109K–$108.5K remains a key golden pocket where long-side liquidations may occur before any reversal. A sustained bounce or double-bottom formation in this pocket could mark the next leg toward retesting the previous all-time high. As long as BTC holds above $100K psychological support, the market stays in distribution or early markup phase. Patience is key — wait for confirmation before entering long positions.

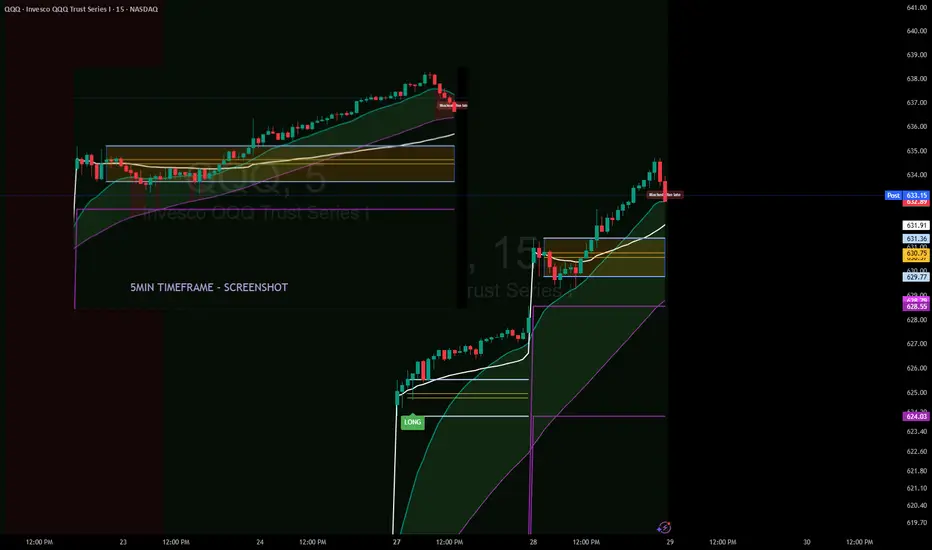
Recap: No Signal? No Problem. Reading Price Like a ProFellow Traders,
I had some time today to do a quick recap — let’s break it down.
Opening Morning
What happened? Exactly what needed to happen: nothing.
No signal. No golden pocket retracements. Nothing worth forcing a trade.
We saw a break of the ORB at 10:40 AM on the 5-minute chart. A bearish candle closed just below that level, but there was no signal giving any conviction of a further move.
Between 10:00 AM and 10:20 AM, the 5-minute candles also showed no real conviction. Even though they played right in the Golden Pocket, there was no close inside the pocket itself.
Looking for confluences in other signals — particularly the 0DTE Context Indicator — price action on both the 5-minute and 15-minute charts never pushed below any of the EMA, SMA, or VWAP lines. Again, no conviction for the bears to step in.
First Entry
I played the waiting game today. My first trade on QQQ 0DTE didn’t happen until 11:05 AM. When I saw price holding above my lines and refusing to break lower, I knew a trade was setting up to the upside.
You’re probably wondering what kind of contracts I took.
I typically trade CALL or PUT options with a Greek Delta of 0.40 or higher, which puts me just under an ITM option. Once I’m in, I aim for a 50% profit target, which can come fast with the right move. The lower the Delta, the higher the risk — so I keep it tight.
If you want more details on how I time those entries, feel free to DM me.
Price Action Confirmation
After entering, I made a few additional plays as price began to push above my 0DTE Context Indicator lines. On the 5-minute chart, the candles between 12:05 PM and 12:20 PM played directly into the Golden Pocket — this gave me strong conviction that price was heading for new highs.
Final Thoughts
Today was a bit tricky. It required more patience and reading the tape than I would have liked. But as traders, we’ll see plenty of days like this. The key is to not overstay your welcome. Don’t force trades. Let price action finish its story before making your move.
I hope these recaps help you better understand how to use the indicators I’ve built. If you have any questions or feedback, drop a comment or DM me — I’d love to hear from you.
Thank you again for the continued support.
— TradeswithB
"Smart Money Alert | RTS Index Could Hit 40,000+"🚀 The next big wave isn’t coming — it’s already forming.
RTSI – The Birth of a New Macro Wave! 🌊
The RTS Index (RTSI) appears to have completed a multi-decade Elliott Wave cycle correction — setting the stage for a massive Wave 5 expansion.
📉 Wave Breakdown:
🌊 Wave 1: The early post-1998 surge — the birth of a new trend and Smart Money accumulation.
⚡ Wave 2: The healthy pullback that shook out weak hands while keeping higher lows intact.
🔥 Wave 3: The impulsive macro rally into the 2008 highs — peak euphoria and full market participation.
🌀 Wave 4: The long, drawn-out correction since 2008 — complex, choppy, and filled with liquidity sweeps.
🎯 Now, with price resting perfectly in the Golden Pocket (0.618–0.65 Fib zone) and showing accumulation footprints, Wave 5 could be ready to ignite.
📊 Confluence & Market Structure
✅ Wave 4 complete in Fibonacci support zone
✅ Liquidity grab beneath major structure lows
✅ Smart Money reaccumulation evident
✅ Structure shifting from range → markup
📈 Wave 5 Projection:
The 2.618 Fibonacci extension aligns with a macro target near 40,000+ — a potential generational move if confirmed ⚡
💼 Fundamental Context:
Despite geopolitical pressure, Russian equities remain deeply undervalued relative to global peers 📉
Commodity resilience + improving liquidity = the perfect backdrop for a bullish macro rotation ⚙️
If this count holds true, RTSI may be entering its Wave 5 super-cycle — where disbelief turns into momentum and patience turns into payoff 🌠
💬 Trader & Analysts!
Do you see the same wave count? Drop your analysis below! 👇
💎 Like if you believe Wave 5 is already loading… 🚀 — Team FIBCOS
#RTSI #ElliottWave #WaveTheory #SmartMoneyConcepts #Fibonacci #TechnicalAnalysis #MarketStructure #PriceAction #Wave5 #MacroCycle #GoldenPocket #BullishSetup #FibConfluence #SmartMoney #TradingView #WaveAnalysis

Ep. 4 - BTC Prediction By Channels, Secret Fib & Unique Gann FanBitcoin Price Prediction Using Channels, Fibonacci & Gann Fan | Signal & Structure Episode 4
In this concise yet powerful episode, we combine three advanced technical analysis tools to identify high-probability support zones for Bitcoin's current correction. This multi-confluence approach demonstrates how stacked logarithmic channels, Fibonacci retracements, and Gann fans work together to pinpoint critical price levels.
Techniques Demonstrated:
1. Channel Validation Theory
- Proves that any trend line can become a valid channel
- Shows how to convert the COVID crash to bear market bottom trendline into a working channel
- Demonstrates perfect alignment with historical tops
2. Stacked Channel Refinement
- Creates a smaller channel where the top touches the midline of the larger channel
- This subdivides the original channel into quarters
- Provides additional confluence levels for support/resistance
3. Fibonacci Retracement Application
- Maps the key retracement levels from recent bottom to top
- Focuses on the "Golden Pocket" (0.618-0.786)
- Identifies 0.702 as the Optimal Trade Entry (OTE) level
4. Gann Fan on Logarithmic Scale (Unique Technique)
- Anchors 45-degree angle from the peak
- Aligns Gann Fan 1x1 line with the 45-degree angle
- Uses Gann lines to track momentum decay:
- 1/8 → 1/4 → 1/3 (bearish progression)
- 1/1 as recovery signal
- 8/1 as ultimate resistance breakout
Key Confluence Zone Identified:
The analysis reveals a critical support box between:
- 0.618 - 0.786 Fibonacci levels
- Validated by 1/3 Gann Fan line
- Supported by stacked channel structure
This triple confluence creates a high-probability reversal zone where multiple technical factors align.
Trading Insights:
Current Market Position:
- Price following bearish momentum path along Gann lines
- Moving from 1/8 toward 1/3 line
- Range-bound action expected until 1/1 line reclaimed
Recovery Signals to Watch:
- Breaking above 1/1 Gann line (45-degree angle) = trend recovery
- Ultimate bullish confirmation: Breaking 8/1 line
- Support zone provides optimal risk/reward entry area
Technical Setup:
- Timeframe: Weekly chart
- Scale: Logarithmic (essential for both channels and Gann)
- Tools: TradingView's Fib Retracement, Gann Fan, Parallel Channel
This episode demonstrates how combining multiple technical tools on logarithmic scale can identify precise support/resistance zones. The convergence of three independent methods at the same price area significantly increases the probability of a meaningful reaction.
The unique application of Gann Fan on log scale, aligned with the 45-degree angle, provides a momentum roadmap that most traders miss. This technique is particularly powerful for tracking trend strength degradation and identifying potential reversal points.
Feel free to teach out for partnership opportunities. I'm open to provide TA and educational services.

Looking for Zuari's Golden Zone - Fib RetracementZuari's fib retracement on the daily chart on the run up from 200 to 390 shows a clear pullback to 38.2% followed by a failed attempt to break 100% in a seeming double top formation around 390, invalidating immediate bullish momentum.
Daily Macd and RSI look weak with bearish divergences forming against PA, denoted with green brush lines showing both indicators with lower highs against price's equal high.
A retest of the golden zone (61.8% to 78.6%) puts us between roughly 240 and 275, which should offer a high probability zone for accumulation and eventually a bounce.
Look out for confluences of major fib levels with 1d 50ma, 99ma and 200ma. 61.8% also has a horizontal confluence with the Dec 3rd peak, and 78.6% has horizontal confluence with April 24th peak, also potentially infleuntial to support levels.

The Golden Pocket: Fibonacci’s Sweet Spot in TradingHello, traders! 😎
If the crypto market had a VIP lounge, the golden pocket would have a permanent reservation. It’s that elusive, almost mystical zone in the Fibonacci retracement where price often decides its fate. Will it make a heroic comeback… or lose steam entirely? Before we dive in, one thing needs to be crystal clear: the golden pocket in trading is not a magic wand. On its own, it’s just a mathematical range. Used without confirmation from other indicators, volume analysis, or broader market context, it can lead you straight into a trap. Professional traders and algorithms treat it as one tool in a much BIGGER TOOLBOX .
What Is the Golden Pocket in Trading?
In technical terms, the golden pocket refers to a specific slice of the Fibonacci retracement scale, typically between 61.8% and 65%. These numbers aren’t random. The 61.8% figure comes from the Fibonacci sequence, a ratio found in nature’s architecture — spirals of seashells, galaxies, flower petals — and eerily echoed in financial markets. The small range between 61.8% and 65% is what traders call the Fibonacci golden pocket or golden pocket fib levels.
Here’s the logic: when an asset trends up but starts to pull back, it often retraces a portion of that move before continuing. The fib retracement golden pocket tends to be the last meaningful zone where buyers step in before momentum breaks completely. In a downtrend, it works the same way but inverted — the price rallying into the golden pocket often finds sellers ready to push it back down.
Why does it matter? Market behavior is, in part, a reflection of human psychology. Many traders — from retail to institutions — watch these levels, which makes reactions here more probable. Add in algorithms coded to act at certain Fibonacci ratios, and you have a cluster of activity that can turn the golden pocket into a genuine battleground.
But, and here’s that warning again, a retracement into the golden pocket alone doesn’t guarantee a reversal. Without confluence from other tools (trendlines, moving averages, volume spikes, momentum oscillators), it’s simply a potential reaction zone.
Why the Golden Pocket Works (Sometimes)
The golden pocket trading concept thrives on repetition. Over years of chart history across markets — stocks, forex, crypto — this small Fibonacci zone has been tested again and again. It often coincides with areas of previous support/resistance or with liquidity zones where large orders are waiting.
Think of it like this: if price is a runner and the market is a racetrack, the golden pocket is the point where the runner slows down to decide whether to push for another lap or leave the track. Sometimes they sprint ahead, sometimes they collapse, but the decision often happens there.
In crypto, this zone is particularly watched because of the market’s volatility. Bitcoin, Ethereum, and other majors have shown countless reactions here, which keeps the cycle going. Traders believe in it because it’s worked before, and because traders believe in it, it works again… until it doesn’t. That’s the critical point. IT DOESN’T ALWAYS WORK . Treating it as gospel is one of the fastest ways to get stopped out. Smart traders always ask: What else confirms this zone?
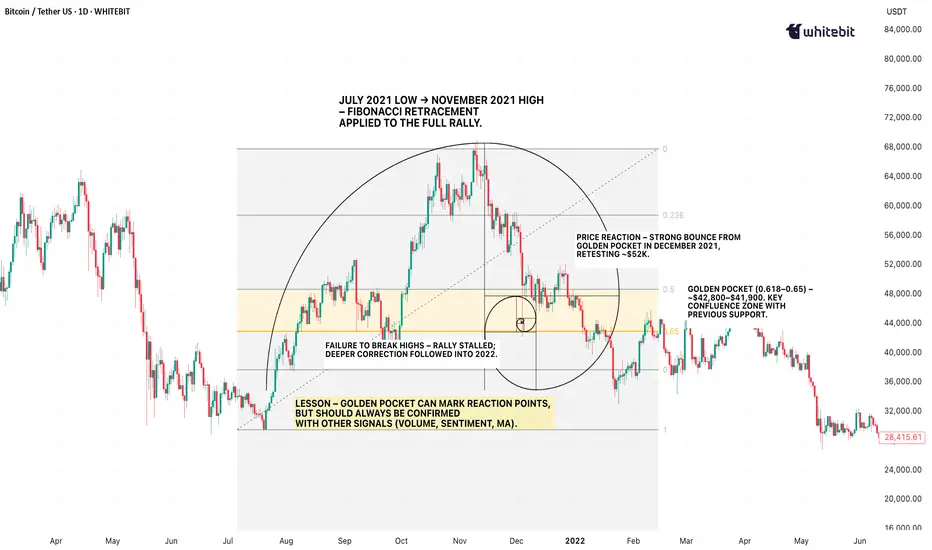
A Real Bitcoin Example
Let’s jump back to September 2021. Bitcoin had rallied from its July swing low around $29,000 to the early September high near $52,900. Then, a correction began.
If you plotted a Fibonacci retracement from that July low to the September high, the pullback landed almost perfectly in the golden pocket range between $42,800 and $41,900. On the chart, this wasn’t just a random number zone — it aligned with a previous area of consolidation and a visible liquidity shelf.
The market reaction? Price respected the zone, paused for a few sessions, then bounced to retest the $52K area. However, here’s the twist — it didn’t break new highs. By November, the rally failed, and BTC entered a deeper correction.
That single example tells you everything you need to know: the golden pocket can be a reaction point, but not a guaranteed trend reversal. Those who combined it with volume divergence, macro sentiment, and moving averages saw the warning signs early. Those who didn’t… learned a painful lesson.
The Takeaway
The golden pocket fibonacci is one of those charting concepts that sticks in traders’ minds because it’s both elegant and, at times, eerily accurate. It’s a reflection of how price action can mirror natural ratios found in the world around us.
But markets are not bound by mathematics alone — they’re driven by liquidity, sentiment, and macroeconomic forces. The golden pocket in trading works best when it’s part of a confluence: combine it with other technical indicators, volume profile analysis, or key horizontal levels.
On its own? It’s just a pretty number. In the right hands, with the right supporting evidence, it’s a zone where history has shown the market likes to make decisions.
SOL's Golden Pocket: Is This the Bottom?SOL just tapped into the golden pocket zone and swept sell-side liquidity. Creating a high-probability long opportunity.
🟢 Long Setup:
Entry Zone: $156.67 – $151.50
Stop Loss: Below $150 (clear invalidation)
Target: $172
Risk:Reward: solid R:R setup
Why This Zone? Confluence Breakdown:
Golden Pocket retracement (0.618–0.666)
1.272 Trend-Based Fib Extension
Monthly Order Block
0.5 Fib Speed Fan support
Key Level at $154.81
Anchored VWAP support layer
Pitchfork 0.618/0.666 alignment
SSL (Sell-Side Liquidity) swept
nPOC at ~$152 offers a prime entry if we see another leg down
💡 Tip: Ladder in entries within the zone and size up near nPOC if price dips further. Manage risk carefully and watch how price reacts at the zone.
🧠 Educational Insight
Golden pockets (the 0.618–0.666 Fibonacci zone) are some of the most respected levels in trading often acting as key reversal zones, especially when stacked with other tools. In this case, we’ve got a rare confluence: anchored VWAP, nPOC, monthly OB, SSL sweep etc. all lining up with the golden pocket.
When multiple technical factors align, they don’t just increase probability, they give you a tighter invalidation and a better risk-to-reward setup. That’s how professional traders spot sniper entries.
_________________________________
💬 If you found this helpful, drop a like and comment!

$Btc Bounce Signal is Locking in on the $108.5k Golden Pocket Bitcoin recently formed a higher low around the $111,600 level, which is an important structure to watch. This setup is still bearish in nature because if BTC loses this $111.6K support, it will confirm a deeper bearish trend taking hold. Right now, BTC is pulling back after being rejected at $115,000 and heading towards this crucial $111.6K zone.
If this support holds, we might see some relief or a bounce. But if it breaks, the next key area is the Fibonacci Golden Pocket between $107,000 and $108,000 — a critical level where bulls often try to defend. Failure to hold even the Golden Pocket would strengthen the bearish outlook further.
BTC is at a decisive point, and traders should closely watch how price behaves around these levels to understand if a recovery or a deeper drop is on the cards.

GOLD - Strong Trendline & Golden Pocket ContinuationMarket Context
Gold is currently trading within a rising wedge structure on the 4-hour timeframe. This formation typically represents a tightening market, where buyers continue to push higher — but with decreasing momentum. The confluence of both trendlines and repeated Golden Pocket bounces makes this setup technically rich and worth watching closely.
Golden Pocket & Trendline Confluence
Throughout the recent move up, price has consistently reacted to the 0.618–0.65 Fibonacci retracement zone — often referred to as the Golden Pocket. Each major retracement has found support not only at this zone but also at a rising trendline, showing strong alignment between horizontal and diagonal demand. This dual-layer support has repeatedly led to sharp rebounds, reinforcing the bullish structure.
What Comes Next?
Price is currently sitting just below the upper resistance of the wedge. If history repeats, a retracement toward the lower trendline could be the next logical step. A reaction in the same region — where the Golden Pocket once again overlaps the trendline — could offer a high-probability long opportunity for continuation toward the top of the wedge or even a breakout.
Alternatively, if price breaks below the trendline with conviction, it could signal exhaustion in the current structure, potentially flipping the bias toward a broader correction.
Final Thoughts
This is a textbook example of how technical confluence can guide trade planning — especially in clean, trending environments like this. Remember: patience is key. Let the market come to your levels.
If you enjoyed this breakdown, a like would go a long way — and feel free to share your thoughts or ideas in the comments below!

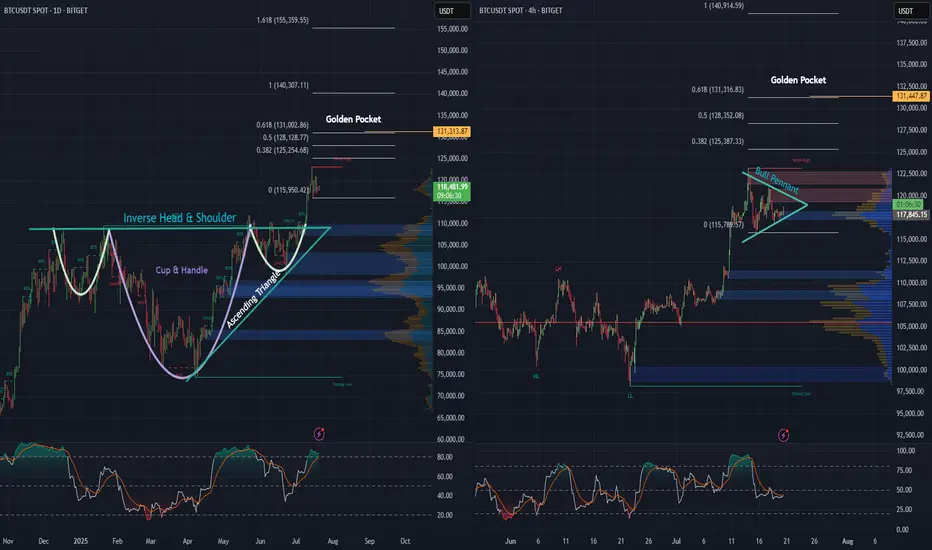
BTC daily, and 4 hr. Bullish Patterns Stack Up!Looking at the Daily and 4-hour charts for BTC, we can see multiple bullish formations unfolding.
An inverse head and shoulders - daily
A cup and handle - daily
An ascending triangle - daily
Price action looks strong, as we’ve begun the breakout from the neckline on the inverse H&S, as well as the cup and handle and ascending triangle simultaneously, and momentum is building fast.
Also, on the 4-hour chart, there’s a pretty substantial bull pennant taking shape. A breakout here could be the next leg up, and the push needed to keep momentum alive.
Zooming out, when we apply the trend-based Fibonacci extension, it reveals a $131,000 golden pocket, on both the the daily as well as the 4 hr. And that could be a major upside target if these bullish structures hold.
Stay tuned to see if BTC continues its move and sets a new all-time high.
RCI, Bear Flag On The Daily As Well As The 4hr Analyzing both the daily and 4-hour charts reveals a very prominent bear flag, which has formed following a steep decline. This pattern is often indicative of further downward movement, and it's hard to ignore the implications.
Word on the street is that they're currently in dire straits. Since the Shaw acquisition, they've hemorrhaged 11 billion in valuation. The situation is exacerbated by declining revenues and missed growth targets. In short, it's not looking promising.
If the trend continues downward, we might see the price testing the $19 USD mark sooner rather than later.
For those who are currently long on this or have any vested interest, it might be prudent to reconsider your position and cut your losses before it's too late.

Bitcoin - Will the $100K Level Hold?Since reaching its all-time high (ATH) on May 22nd at an impressive $112,000, Bitcoin (BTC) has entered a corrective phase that has caught the attention of traders and analysts alike. After a strong and relentless move to the upside, such a phase is not uncommon in crypto markets, where rapid rallies are often followed by cooling-off periods. As of now, BTC is trading at around $101,000, marking a decline from its peak but still maintaining a significant portion of its recent gains. This retracement has not only been healthy in terms of price structure but also offers potential opportunities for those closely monitoring key technical levels.
4H FVG
One important aspect of the move leading up to the ATH was the formation of a 4H Fair Value Gap (FVG). These imbalances, left behind during aggressive moves in the market, are often revisited and filled as part of a broader effort by price to return to equilibrium. The current FVG spans from approximately $100,500 to $99,800. This range is especially noteworthy, as such gaps tend to act as magnets for price action, creating zones of potential support where buyers may step in to defend the structure. As BTC approaches this region, it's plausible to expect at least a temporary bounce, particularly if market sentiment remains constructive.
Golden Pocket Fibonacci
Adding further weight to this zone is the confluence of the Golden Pocket, the area between the 0.618 and 0.65 Fibonacci retracement levels, derived from the latest upward leg. This specific Fibonacci region is widely regarded in technical analysis as a high-probability reversal zone, often attracting significant buying interest. Interestingly, the Golden Pocket aligns almost perfectly with the aforementioned FVG, both residing in the $100,500 to $99,800 range. The overlapping of these two technical indicators strengthens the case for this area to act as a firm support level, or at the very least, a point where the ongoing correction could take a breather.
Conclusion
Taken together, the alignment of the 4H FVG and the Golden Pocket around the $100,000 mark creates a technically compelling scenario. The psychological impact of a round number like $100,000 only adds to its potential as a battleground between buyers and sellers. If this zone holds, it could spark a notable bounce, either a temporary relief rally or potentially the beginning of a renewed leg to the upside, depending on broader market conditions.
Thanks for your support.
- Make sure to follow me so you don't miss out on the next analysis!
- Drop a like and leave a comment!

XRP Correction Complete? — Long Setup Aligned with Fib & OBXRP has completed a 5-wave impulse move. As expected, XRP is now in a corrective phase, pulling back after rejecting from a key resistance — and it’s doing so with technical precision.
The question now: where is the next high-probability long setup? Let’s break it down.
🧠 Market Structure & Key Zones
Using Fibonacci retracement from the base of the 5-wave impulse, we now have a potential golden pocket target aligned with major confluence.
🔽 Support Zone
🔹 0.618 Fib retracement: $2.2982
🔹 Daily Bullish Order Block: $2.2949
🔹 Daily 21 EMA: $2.329
🔹 Daily 21 SMA: $2.301
🔹 Liquidity pool
🔹 0.786 Fib Speed Fan (only if price drops between May 17–18)
This creates a high-confluence support cluster at ~$2.3 — a prime candidate for a long re-entry.
🟢 Long Trade Setup
Entry: Ladder between $2.32 and $2.28
Stop-loss: ~$2.21
Target: $2.7175 (0.618 Fib retracement of the corrective downtrend)
R:R: ~5:1
🔴 Short Setup (Conditional)
Trigger: Rejection at $2.7175
Entry: ~$2.7175
Stop-loss: Above $2.8033 (0.666 Fib) → set at ~$2.811
Take Profit: ~$2.56 or lower
R:R: ~2:1+ (dependent on entry confirmation and PA behaviour)
Shorts only valid if a clear rejection or SFP pattern emerges. If momentum is strong, this level may break — so wait for structure to confirm.
📘 Educational Insight: Why Confluence Matters
Too often, traders chase single-indicator signals. But real edge comes from confluence — when multiple tools (Fibs, MAs, Order Blocks, Liquidity, VWAPs, FVG, Speed Fans etc.) agree on the same zone. This alignment not only increases confidence in your entry, but also sharpens your risk management.
Think of it as building a case — the more aligned evidence you have, the stronger your trade thesis becomes.
📌 Summary
XRP is in a corrective phase after a 5-wave impulse
Clean rejection from weekly resistance → continuation of bearish trend
Long zone: ~$2.3
SL: ~$2.21 | TP: $2.7175 | R:R ~5:1
Optional short: $2.7175 rejection → SL $2.811 | TP $2.56
Precision isn’t about predicting — it’s about being ready when the chart speaks with clarity. Patience makes probability powerful.
___________________________________
If you found this helpful, leave a like and comment below! Got requests for the next technical analysis? Let me know.

Gold - Small rejection before $3400?Gold has been in a clear downtrend on the 4-hour timeframe, and during one of its recent declines, it left behind a 4-hour Fair Value Gap (FVG). Price is now climbing back toward this imbalance zone, suggesting that a critical test of resistance may be approaching.
Bounce from strong support
Just a few days ago, Gold found solid footing at a strong support area, which triggered a bounce. Since then, it has been pushing higher and is now nearing the 4-hour FVG. This zone represents a significant area of imbalance left unfilled during the prior selloff, and it's highly likely that price will react once it reaches this region.
FVG and Golden Pocket
Interestingly, this FVG aligns closely with the golden pocket, which lies between 3315 and 3325. While the golden pocket sits slightly above the midpoint of the FVG, there's a good chance Gold could tap into that area before showing signs of a pullback or rejection from the FVG itself.
Target to the downside
If price fails to break above this zone and reverses, the logical target to the downside would be the 3250 level. This area has acted as a key resistance in recent sessions, and if retested from above, it could serve as a strong support base for another potential leg higher.
Target if we break above the FVG
On the other hand, if Gold manages to break cleanly through the FVG with strong volume and momentum, the path could open toward a move up to the recent highs around 3430. In that scenario, the bullish continuation would likely require sustained buying interest and increased market participation to carry through.
Thanks for your support.
- Make sure to follow me so you don't miss out on the next analysis!
- Drop a like and leave a comment!

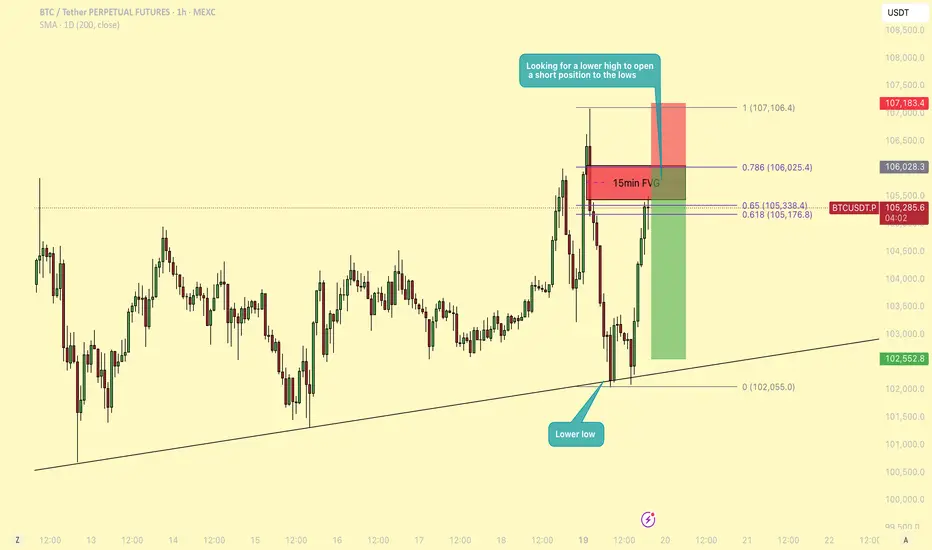
BTC - Will BTC revisit $102k or is a pump imminent?Bitcoin (BTC) has been in a consolidation phase for an extended period, marked by a lack of strong directional momentum and characterized by ranging price action. This type of market environment often leads to both liquidity grabs and choppy movement, and traders need to remain especially vigilant about key levels and structure shifts.
Liquidity grab
Yesterday, BTC managed to sweep the recent highs, grabbing liquidity above a short-term resistance zone before reversing and moving lower. This move appears to have been a classic stop-hunt or liquidity sweep, which was followed by a strong rejection. As price moved down from those highs, it left behind an unfilled gap on the 15-minute chart, what many refer to as a Fair Value Gap (FVG). This gap now acts as a magnet for price and is a key area to watch as we approach it again.
Market structure
On the 1-hour timeframe, BTC has now printed a lower low, suggesting a short-term shift in market structure to the downside. This structural break opens up the possibility for a lower high to form, setting up a classic trend continuation scenario. From a technical standpoint, the expectation would be for BTC to now create a lower high and then push lower, potentially targeting the range lows from yesterday and today. This provides an opportunity for a short setup with a favorable risk-to-reward (RR) ratio, estimated to be around 3:1, if the entry and stop are managed around the key resistance and structural levels.
Fibonaccy that aligns with the FVG
Currently, BTC is sitting at the Golden Pocket, the region between the 0.618 and 0.65 Fibonacci retracement levels. This area often serves as a reaction zone for price, and we are seeing some hesitation here. Interestingly, this Golden Pocket sits just below the aforementioned 15-minute FVG, and price appears to be gravitating toward this inefficiency, potentially looking to fill it before making a more decisive move.
What adds to the confluence at this level is the 0.786 Fibonacci retracement, which aligns almost perfectly with the top boundary of the Fair Value Gap. While many traders look to enter short positions at the 50% mark of the FVG, this added confluence makes the 0.786 + FVG top zone a more compelling entry point. This would allow for a tighter stop just above the gap or structure high, and thus improves the risk-to-reward ratio slightly compared to a more conservative FVG entry.
Conclusion
In summary, the plan would be to wait for BTC to either fill the FVG and reach the 0.786 level or show strong rejection signs there. A rejection from this zone would confirm the lower high thesis and offer a solid short setup aiming for a move back to the range low. With the current setup, market structure, and confluence levels lining up, this trade idea presents a tactical opportunity with clear invalidation and high RR potential.
Master HBAR with Fibonacci: The Golden Pocket BlueprintSince topping out at $0.20151, HBAR has spent the last nine days in a corrective pullback. Digging into a rich confluence of supports that offers a long trade setup. Here’s how to spot the high‑probability entries, manage your risk, and scale out for maximum reward.
Current Context
Two days ago, price was firmly rejected at the weekly open ($0.19029) right alongside the anchored VWAP drawn from the $0.28781 swing high.
HBAR now trades below the monthly open ($0.18210), the weekly open ($0.19029), and the daily open ($0.18024), sitting at about $0.177.
Just beneath today’s level lies the swing low at $0.17543. Breaching this could flush out stops before any meaningful bounce.
The Golden Support Zone
All signals converge between $0.170 and $0.1725:
The anchored VWAP from the $0.12488 low sits at around $0.17.
The 0.618 fib retracement of the $0.15396→$0.20239 move falls at $0.17246. Just under the swing low where the liquidity lies.
The secondary 0.666 fib retracement lands at $0.17014, reinforcing that floor.
Volume‑profile analysis of the past 27 days pins its Point of Control right at $0.17, great confluence with the anchored VWAP.
This “golden pocket” is your pivot for a low‑risk, high‑probability long.
Long Trade Setup
Ladder buy orders between the swing low ($0.17543) and the 0.666 fib at $0.17014.
Aim to average in around $0.1725.
Place a single stop‑loss just below $0.17
Scaling Your Exits
First Partial Exit at the monthly open ($0.18210). This offers roughly a 2:1 R:R.
Second Exit Zone around the weekly open and VWAP resistance (~$0.19) for about a 3:1 R:R.
Final Target at the 0.618 fib retracement of the entire down‑wave (from $0.28781 to $0.12488) near $0.2256. An astounding 10:1 payoff for the patient trader.
Keep in mind a potential false‑break (SFP) at $0.17543: if price briefly dips below then snaps back up, with increased volume.
Short Trade Setup
For traders looking to play the downside from the “golden pocket” flip, here’s a clear short strategy:
Entry Zone: Ladder short entries between the 0.618 fib at $0.22557 and the 0.666 fib at $0.23339.
Confluence: The 0.666 level aligns perfectly with the negative 0.618 fib from the prior swing, creating a resistance zone.
Stop‑Loss: Place your stop just above $0.23339, invalidating the confluence.
Take‑Profit: Target a return to around $0.206, where you can lock in gains as HBAR retests its previous high.
By scaling into shorts across that fib band, you balance your risk and capture the high‑odds reversal offered by stacked Fibonacci confluence. Let the golden pocket guide both your longs and shorts!
Key Takeaways
Confluence is king: VWAPs, Fibonacci retracements, Liquidity and volume‑profile all align in the $0.170–$0.175 zone.
Risk control: One stop‑loss under $0.17 protects the entire laddered entry.
Tiered targets: Small wins at $0.182, larger as you clear $0.19, and a big payoff if HBAR rallies toward $0.225. Trail your SL accordingly.
Patience pays: Wait for price to enter the golden pocket, avoid chasing!
With these confluences lining up and clear levels to work from, HBAR’s next high‑probability long setup is staring you in the face. Trade smart, size appropriately, and let the market reward your discipline.
Happy Trading!
___________________________________
If you found this helpful, leave a like and comment below! Got requests for the next technical analysis? Let me know.

BTC - Golden Pocket test & what comes next?Bitcoin (BTC) has been steadily recovering from its January correction, entering a promising uptrend that has now brought it to a crucial technical juncture: the Golden Pocket Fibonacci zone, which lies between the 61.8% and 65% retracement levels. This area is widely watched by traders, as it often serves as a springboard for either significant reversals or continuation of the trend.
4H timeframe
On the 4H timeframe, BTC recently formed an ascending triangle, a classic bullish continuation pattern. The price managed to break above the triangle’s resistance, but it failed to hold above this level, closing back below the breakout zone. This lack of follow-through signals weakness and suggests that a short-term pullback could be imminent.
Daily timeframe
Turning to the daily chart, the situation becomes even clearer. After reaching the Golden Pocket, BTC printed a bearish engulfing candlestick, a strong reversal signal. The subsequent price action saw BTC break below both the 4H support and a daily FVG, further strengthening the case for a deeper correction or trend reversal. If this downward momentum continues, the next major support zone is likely between $89,000 and $91,000. This area marks an imbalance created during the previous rally and is a natural target for buyers to step in.
However, the bullish scenario is not entirely off the table. If BTC can reclaim and hold above the Golden Pocket, it would signal a resumption of the uptrend, with the next key target being the psychologically significant $100,000 level. For now, though, the technical structure suggests that a retracement toward the $89–91k zone is more likely before any attempt at new highs.
Conclusion
In summary, Bitcoin’s recent test of the Golden Pocket Fibonacci zone has resulted in a short-term rejection. The immediate outlook is cautious, with a likely retracement toward $89–91k. Traders should watch closely for confirmation signals in both price action and volume before making new commitments. A successful hold above the Golden Pocket would open the door for a rally toward $100,000, but for now, patience and careful observation are advised.
Thanks for your support.
- Make sure to follow me so you don't miss out on the next analysis!
- Drop a like and leave a comment!

Extremely Bullish.
Extremely Bullish.
Took Support from a very Important level around 136 - 140.
Hidden Bullish Divergence has appeared.
176 - 182 is a Resistance Zone.
Crossing & Sustaining 201, lead it towards 235 - 237.
On the flip side, 170 & 161 - 162 seems to be a Good Support level.
